Synthetic Data Generation Software Market Analysis, Size, and Forecast 2026-2030: North America (US, Canada, and Mexico), Europe (Germany, UK, and France), APAC (China, India, and Japan), Middle East and Africa (Saudi Arabia, UAE, and South Africa), South America (Brazil, Argentina, and Colombia), and Rest of World (ROW)

Synthetic Data Generation Software Market Analysis, Size, and Forecast 2026-2030:
North America (US, Canada, and Mexico), Europe (Germany, UK, and France), APAC (China, India, and Japan), Middle East and Africa (Saudi Arabia, UAE, and South Africa), South America (Brazil, Argentina, and Colombia), and Rest of World (ROW)

Published: Mar 2026 311 Pages SKU: IRTNTR81289

Market Overview at a Glance

$3.05 B
Market Opportunity
46.4%
CAGR 2025 - 2030
36.4%
North America Growth
$147.5 Mn
Structured tabular data segment 2024

Synthetic Data Generation Software Market Size 2026-2030

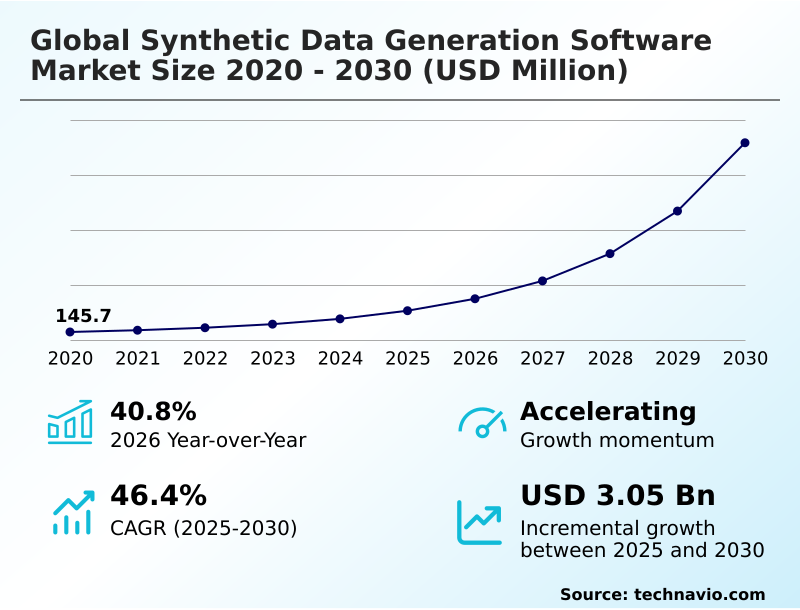
The synthetic data generation software market size is valued to increase by USD 3.05 billion, at a CAGR of 46.4% from 2025 to 2030. Escalating regulatory pressures to protect personal information will drive the synthetic data generation software market.

Major Market Trends & Insights

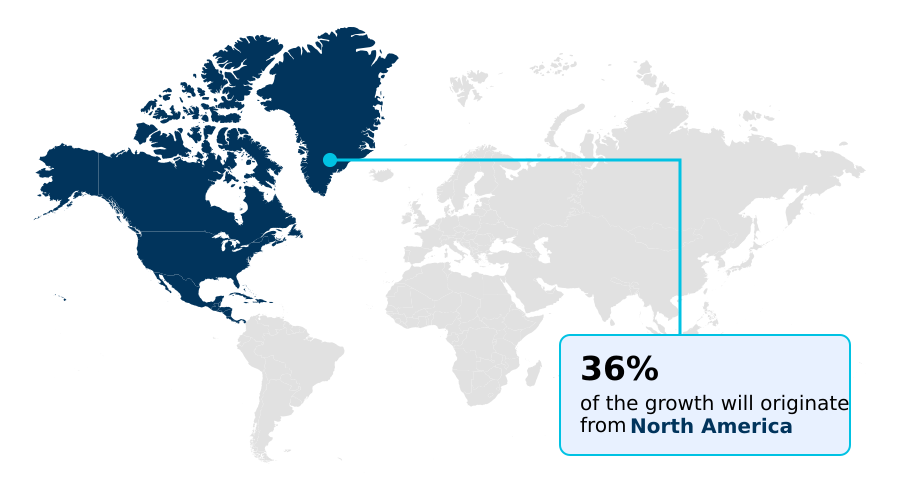
  • North America dominated the market and accounted for a 36.4% growth during the forecast period.
  • By Data Type - Structured tabular data segment was valued at USD 147.5 million in 2024
  • By End-user - BFSI segment accounted for the largest market revenue share in 2024

Market Size & Forecast

  • Market Opportunities: USD 3.44 billion
  • Market Future Opportunities: USD 3.05 billion
  • CAGR from 2025 to 2030 : 46.4%

Market Summary

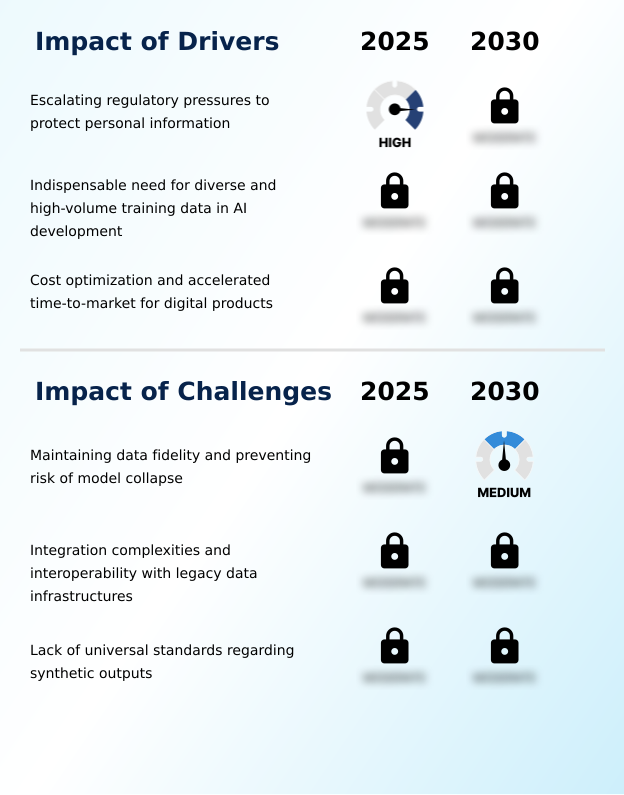
  • The synthetic data generation software market is expanding as organizations seek to balance innovation with stringent privacy mandates. The indispensable need for diverse and high-volume training data is a primary driver, particularly for complex AI and machine learning models where real-world data is scarce or biased.
  • Key trends include the integration of generative AI for high-fidelity data augmentation and the expansion of digital twins for simulating autonomous systems. For example, an automotive firm can generate millions of miles of driving data, including rare edge cases, to train self-driving algorithms without costly physical tests.
  • However, the market faces challenges in maintaining data fidelity and preventing model collapse, where AI models trained on synthetic data lose touch with reality. Additionally, integration with legacy systems and the lack of universal standards for synthetic outputs can hinder adoption. Success in this market depends on producing statistically identical, privacy-compliant datasets that accelerate development cycles and reduce costs.

What will be the Size of the Synthetic Data Generation Software Market during the forecast period?

Get Key Insights on Market Forecast (PDF) Request Free Sample

How is the Synthetic Data Generation Software Market Segmented?

The synthetic data generation software industry research report provides comprehensive data (region-wise segment analysis), with forecasts and estimates in "USD million" for the period 2026-2030, as well as historical data from 2020-2024 for the following segments.

  • Data type
    • Structured tabular data
    • Image and video data
    • Text and NLP data
    • Time series and sensor data
  • End-user
    • BFSI
    • Healthcare and life sciences
    • Retail and e-commerce
    • Automotive and mobility
    • Others
  • Application
    • AI and ML model training
    • Data privacy and compliance testing
    • Software testing and QA
    • Fraud detection and cybersecurity
  • Geography
    • North America
      • US
      • Canada
      • Mexico
    • Europe
      • Germany
      • UK
      • France
    • APAC
      • China
      • India
      • Japan
    • Middle East and Africa
      • Saudi Arabia
      • UAE
      • South Africa
    • South America
      • Brazil
      • Argentina
      • Colombia
    • Rest of World (ROW)

By Data Type Insights

The structured tabular data segment is estimated to witness significant growth during the forecast period.

The synthetic data generation software market is segmented by data type, with structured tabular data representing a foundational component. This segment involves creating artificial datasets for software testing and QA, which mirror the statistical properties of relational databases.

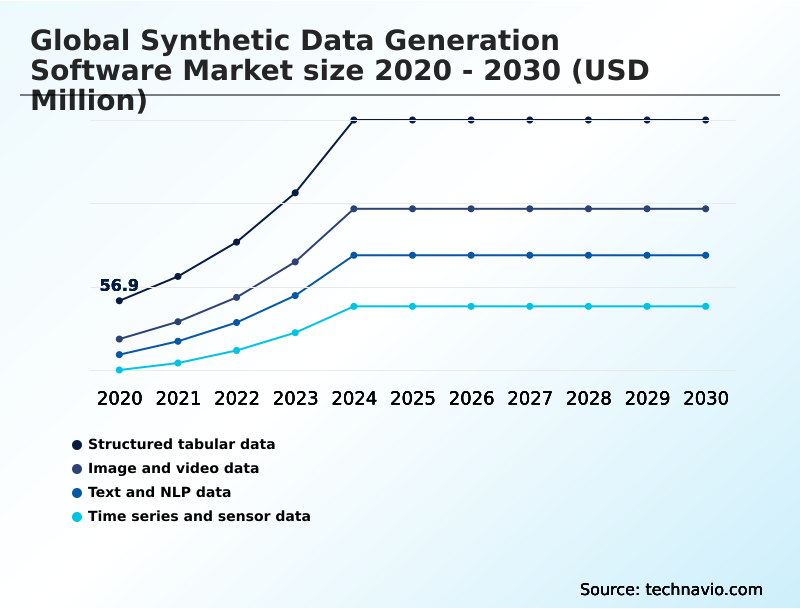
Organizations rely on these realistic synthetic datasets to bypass legal hurdles associated with sensitive information, improving test coverage by over 40% in some cases. The use of tabular data generation tools is critical for fraud detection and cybersecurity.

Other key segments include the generation of synthetic text and NLP data for training language models, as well as synthetic time series data for forecasting. This approach to data privacy and compliance testing is becoming a standard in data-centric operations.

Request Free Sample

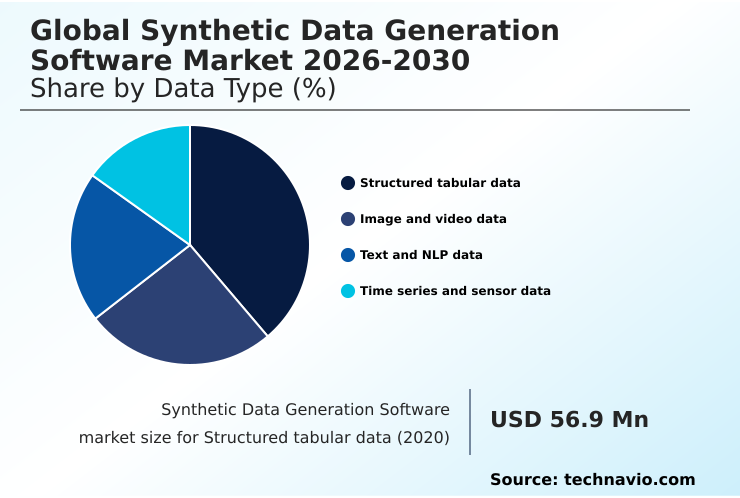
The Structured tabular data segment was valued at USD 147.5 million in 2024 and showed a gradual increase during the forecast period.

Request Free Sample

Regional Analysis

North America is estimated to contribute 36.4% to the growth of the global market during the forecast period.Technavio’s analysts have elaborately explained the regional trends and drivers that shape the market during the forecast period.

See How Synthetic Data Generation Software Market Demand is Rising in North America Request Free Sample

The geographic landscape is led by North America, which accounts for over 36% of the market’s incremental growth, driven by a mature technology ecosystem.

Here, the focus is on autonomous systems training data and synthetic healthcare data to comply with strict privacy laws. Firms leverage autonomous vehicle simulation data to accelerate development, with some reporting a 40% reduction in physical testing costs.

Meanwhile, APAC is the fastest-growing region, fueled by rapid digital transformation. The use of AI-powered data generation and real-time synthetic data generation is expanding, particularly for synthetic population modeling in smart city projects.

The application of physics-based sensor data and synthetic sensor data simulation is also gaining traction globally to mitigate AI bias with synthetic data and improve the performance of synthetic image and video data models.

Market Dynamics

Our researchers analyzed the data with 2025 as the base year, along with the key drivers, trends, and challenges. A holistic analysis of drivers will help companies refine their marketing strategies to gain a competitive advantage.

  • Strategic implementation of synthetic data is becoming a cornerstone for enterprise AI, addressing challenges across multiple domains. The benefits of synthetic data in machine learning are most evident in applications requiring vast, unbiased datasets. For instance, synthetic data for AI model training allows developers to overcome the limitations of scarce real-world information.
  • Companies are increasingly focused on the best practices for synthetic data quality to ensure their models are robust. In regulated industries, synthetic data for data privacy compliance is crucial, with specific synthetic data generation software for healthcare and synthetic data generation tools for finance enabling innovation under strict legal frameworks like GDPR.
  • The cost of synthetic data generation vs real data presents a compelling economic advantage, often reducing procurement expenses by more than 60%. Use cases are expanding rapidly, from synthetic data for software development testing to complex synthetic data generation in digital twins.
  • Specialized techniques are emerging to address how to generate synthetic tabular data and for synthetic data for NLP model development. As firms work to resolve challenges in synthetic data fidelity, the use of synthetic data to reduce AI bias and power synthetic data for fraud detection models is becoming standard practice.
  • Comparing synthetic data generation methods helps organizations select the right approach, whether for synthetic data for retail customer analytics, synthetic image data generation for AI, synthetic data for time series forecasting, or synthetic data generation for autonomous vehicles.

What are the key market drivers leading to the rise in the adoption of Synthetic Data Generation Software Industry?

  • Escalating regulatory pressures to protect personal information serve as a key driver for the synthetic data generation software market.

  • The primary driver for the market is the escalating need for high-quality AI training data generation, which traditional data collection methods cannot satisfy.
  • Technologies such as generative adversarial networks are enabling automated data augmentation and balancing imbalanced datasets, which is critical for synthetic data for ML models.
  • By facilitating edge case data generation and statistical property mirroring, organizations can train more robust systems, improving failure detection rates by as much as 30%.
  • The ability to use data de-identification techniques for creating synthetic financial data or for real-world evidence simulation in healthcare accelerates innovation while ensuring compliance. This AI-powered data generation provides a scalable and cost-effective alternative, enabling privacy-safe innovation.

What are the market trends shaping the Synthetic Data Generation Software Industry?

  • The increasing emphasis on robust privacy compliance is driving the proliferation of privacy-enhancing technologies, establishing a primary market trend.

  • Key market trends are centered on the adoption of advanced generative AI for data creation and the use of privacy-enhancing technologies. The development of generative diffusion models enables the production of high-fidelity, multi-modal synthetic data, including sophisticated synthetic data for computer vision, which can improve model accuracy by over 25%.
  • This trend toward privacy-preserving data synthesis is critical for industries handling sensitive information. Furthermore, digital twin simulation and algorithmic bias mitigation are gaining prominence, with AI model fine-tuning data being generated to ensure fairness and robustness.
  • As enterprises scale their AI initiatives, the demand for a seamless synthetic data API to ensure cross-database consistency and facilitate automated data augmentation is growing, with integration speeds improving by up to 60% in modern environments.

What challenges does the Synthetic Data Generation Software Industry face during its growth?

  • A key challenge affecting industry growth is the difficulty of maintaining data fidelity while preventing the risk of model collapse in generative models.

  • A significant market challenge is ensuring data fidelity validation and preventing model collapse, where AI systems degrade after training on artificial data. The lack of standardized synthetic data quality metrics makes it difficult for organizations to trust the outputs of variational autoencoders and other generative models.
  • Integrating a synthetic data platform with legacy systems is another hurdle, often increasing implementation costs by 20-30%. For enterprises adopting agile workflows, creating synthetic test data for DevOps must be seamless, yet complexities in structured tabular data synthesis persist.
  • Achieving GDPR compliant data generation requires sophisticated secure data sharing environments to produce high-fidelity synthetic data that is both useful and fully anonymized, a balance that remains technically demanding.

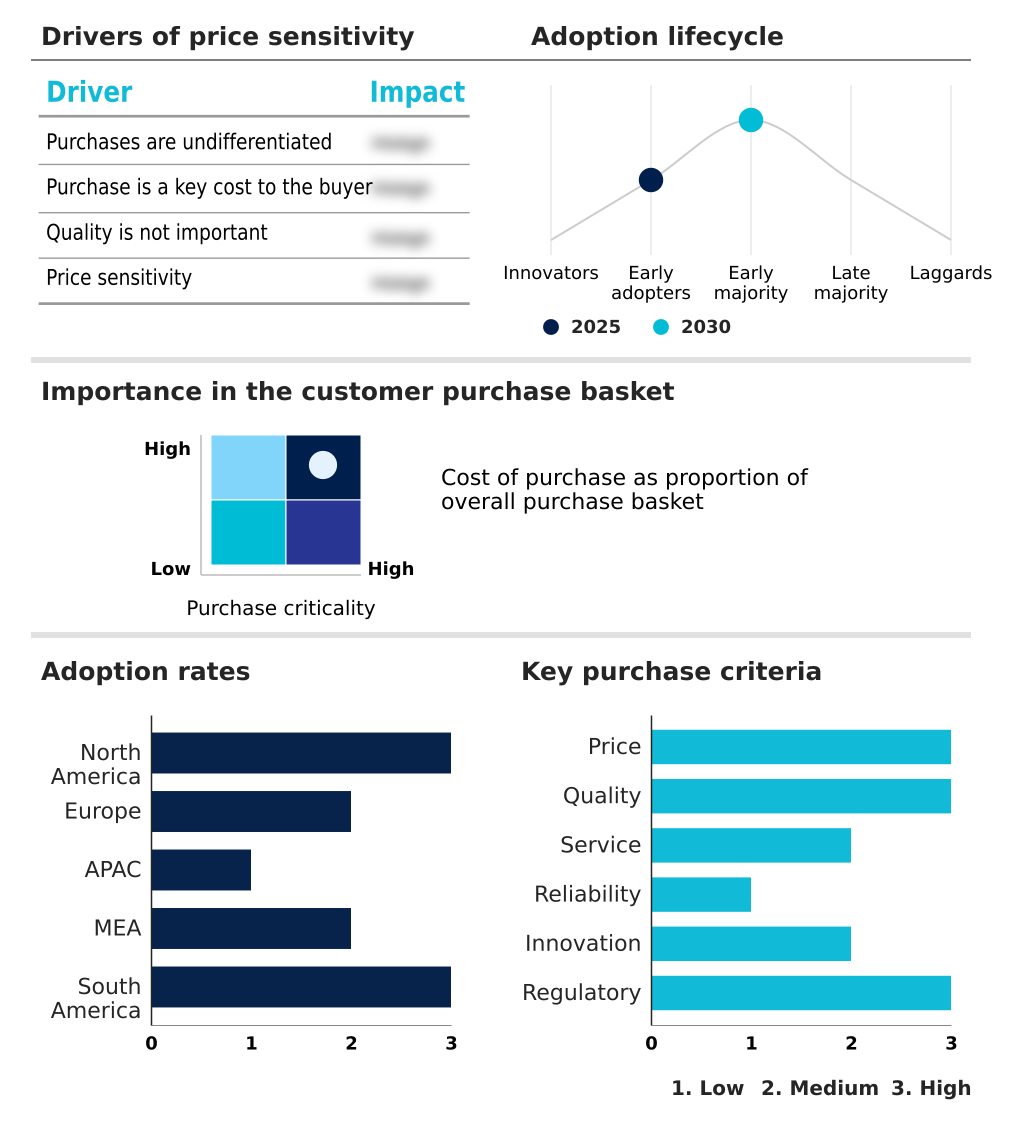
Exclusive Technavio Analysis on Customer Landscape

The synthetic data generation software market forecasting report includes the adoption lifecycle of the market, covering from the innovator’s stage to the laggard’s stage. It focuses on adoption rates in different regions based on penetration. Furthermore, the synthetic data generation software market report also includes key purchase criteria and drivers of price sensitivity to help companies evaluate and develop their market growth analysis strategies.

Customer Landscape of Synthetic Data Generation Software Industry

Competitive Landscape

Companies are implementing various strategies, such as strategic alliances, synthetic data generation software market forecast, partnerships, mergers and acquisitions, geographical expansion, and product/service launches, to enhance their presence in the industry.

Aetion Inc. - Offerings include specialized software for creating artificial datasets that replicate real-world statistical properties for privacy-safe analytics and advanced AI model training.

The industry research and growth report includes detailed analyses of the competitive landscape of the market and information about key companies, including:

  • Aetion Inc.
  • Capgemini SE
  • Databricks Inc.
  • GenRocket Inc.
  • Google LLC
  • Gretel AI
  • K2View
  • MDClone Ltd.
  • MOSTLY AI
  • NVIDIA Corp.
  • Parallel Domain
  • Rendered.ai
  • SAS Institute Inc.
  • Scale AI
  • Synth Studio
  • Synthesized Ltd
  • Syntho
  • Tonic AI Inc.
  • Unity Technologies Inc.
  • YData

Qualitative and quantitative analysis of companies has been conducted to help clients understand the wider business environment as well as the strengths and weaknesses of key industry players. Data is qualitatively analyzed to categorize companies as pure play, category-focused, industry-focused, and diversified; it is quantitatively analyzed to categorize companies as dominant, leading, strong, tentative, and weak.

Recent Development and News in Synthetic data generation software market

  • In October 2025, Accenture acquired Decho, a UK-based consultancy, to bolster its AI and technology advisory services in sectors including healthcare and government.
  • In November 2025, SAS Institute Inc. launched its SAS Data Maker solution on the Microsoft marketplace, expanding the accessibility of its synthetic data offerings.
  • In April 2025, Tonic AI Inc. completed its acquisition of Fabricate, strengthening its position in the market for synthetic data solutions for software and AI development.
  • In June 2025, Meta invested USD 14 billion in Scale AI to enhance its AI model training capabilities and data infrastructure.

Dive into Technavio’s robust research methodology, blending expert interviews, extensive data synthesis, and validated models for unparalleled Synthetic Data Generation Software Market insights. See full methodology.

Market Scope
Page number 311
Base year 2025
Historic period 2020-2024
Forecast period 2026-2030
Growth momentum & CAGR Accelerate at a CAGR of 46.4%
Market growth 2026-2030 USD 3053.6 million
Market structure Fragmented
YoY growth 2025-2026(%) 40.8%
Key countries US, Canada, Mexico, Germany, UK, France, The Netherlands, Italy, Spain, China, India, Japan, South Korea, Australia, Indonesia, Saudi Arabia, UAE, South Africa, Israel, Turkey, Brazil, Argentina and Colombia
Competitive landscape Leading Companies, Market Positioning of Companies, Competitive Strategies, and Industry Risks

Request Free Sample

Research Analyst Overview

  • The synthetic data generation software market is defined by its role in enabling privacy-safe innovation across industries. At its core, the technology leverages generative adversarial networks and variational autoencoders to facilitate secure data sharing environments and real-time synthetic data generation.
  • The adoption of generative diffusion models is further advancing the creation of high-fidelity synthetic data, which is essential for AI model fine-tuning data and automated data augmentation. A key boardroom consideration is the use of digital twin simulation, which can eliminate millions in capital expenditures on physical testing facilities by using physics-based sensor data.
  • The market addresses critical needs such as data privacy and compliance testing, software testing and QA, and fraud detection and cybersecurity. Ensuring cross-database consistency and robust synthetic data quality metrics are central to overcoming technical hurdles.
  • Advanced techniques provide differential privacy guarantees, support algorithmic bias mitigation, and enable structured tabular data synthesis alongside synthetic time series data, synthetic text and NLP data, and synthetic image and video data.
  • From data de-identification techniques and statistical property mirroring to real-world evidence simulation and synthetic population modeling, the technology provides the foundational data for autonomous systems training data while preventing model collapse.

What are the Key Data Covered in this Synthetic Data Generation Software Market Research and Growth Report?

  • What is the expected growth of the Synthetic Data Generation Software Market between 2026 and 2030?

    • USD 3.05 billion, at a CAGR of 46.4%

  • What segmentation does the market report cover?

    • The report is segmented by Data Type (Structured tabular data, Image and video data, Text and NLP data, and Time series and sensor data), End-user (BFSI, Healthcare and life sciences, Retail and e-commerce, Automotive and mobility, and Others), Application (AI and ML model training, Data privacy and compliance testing, Software testing and QA, and Fraud detection and cybersecurity) and Geography (North America, Europe, APAC, Middle East and Africa, South America)

  • Which regions are analyzed in the report?

    • North America, Europe, APAC, Middle East and Africa and South America

  • What are the key growth drivers and market challenges?

    • Escalating regulatory pressures to protect personal information, Maintaining data fidelity and preventing risk of model collapse

  • Who are the major players in the Synthetic Data Generation Software Market?

    • Aetion Inc., Capgemini SE, Databricks Inc., GenRocket Inc., Google LLC, Gretel AI, K2View, MDClone Ltd., MOSTLY AI, NVIDIA Corp., Parallel Domain, Rendered.ai, SAS Institute Inc., Scale AI, Synth Studio, Synthesized Ltd, Syntho, Tonic AI Inc., Unity Technologies Inc. and YData

Market Research Insights

  • Market dynamics are shaped by the need for privacy-preserving data synthesis and generative AI for data creation. The use of synthetic data for ML models is a key factor, with a focus on creating realistic synthetic datasets for AI training data generation.
  • Enterprises that adopt a synthetic data platform can accelerate development timelines by over 50% compared to traditional data acquisition methods. Furthermore, using synthetic financial data or synthetic healthcare data allows organizations to innovate while reducing compliance risks, with some achieving a 99% reduction in re-identification risk.
  • The application of multi-modal synthetic data and edge case data generation is becoming crucial for developing robust and unbiased AI systems, delivering a clear competitive advantage.

We can help! Our analysts can customize this synthetic data generation software market research report to meet your requirements.

Get in touch

1. Executive Summary

1.1 Market overview

Executive Summary - Chart on Market Overview
Executive Summary - Data Table on Market Overview
Executive Summary - Chart on Global Market Characteristics
Executive Summary - Chart on Market by Geography
Executive Summary - Chart on Market Segmentation by Data Type
Executive Summary - Chart on Market Segmentation by End-user
Executive Summary - Chart on Market Segmentation by Application
Executive Summary - Chart on Incremental Growth
Executive Summary - Data Table on Incremental Growth
Executive Summary - Chart on Company Market Positioning

2. Technavio Analysis

2.1 Analysis of price sensitivity, lifecycle, customer purchase basket, adoption rates, and purchase criteria

2.2 Criticality of inputs and Factors of differentiation

Chart on Overview on criticality of inputs and factors of differentiation

2.3 Factors of disruption

Chart on Overview on factors of disruption

2.4 Impact of drivers and challenges

Chart on Impact of drivers and challenges in 2025 and 2030

3. Market Landscape

3.1 Market ecosystem

Chart on Parent Market
Data Table on - Parent Market

3.2 Market characteristics

Chart on Market characteristics analysis

3.3 Value chain analysis

Chart on Value chain analysis

4. Market Sizing

4.1 Market definition

Data Table on Offerings of companies included in the market definition

4.2 Market segment analysis

Market segments

4.3 Market size 2025

4.4 Market outlook: Forecast for 2025-2030

Chart on Global - Market size and forecast 2025-2030 ($ million)
Data Table on Global - Market size and forecast 2025-2030 ($ million)
Chart on Global Market: Year-over-year growth 2025-2030 (%)
Data Table on Global Market: Year-over-year growth 2025-2030 (%)

5. Historic Market Size

5.1 Global Synthetic Data Generation Software Market 2020 - 2024

Historic Market Size - Data Table on Global Synthetic Data Generation Software Market 2020 - 2024 ($ million)

5.2 Data Type segment analysis 2020 - 2024

Historic Market Size - Data Type Segment 2020 - 2024 ($ million)

5.3 End-user segment analysis 2020 - 2024

Historic Market Size - End-user Segment 2020 - 2024 ($ million)

5.4 Application segment analysis 2020 - 2024

Historic Market Size - Application Segment 2020 - 2024 ($ million)

5.5 Geography segment analysis 2020 - 2024

Historic Market Size - Geography Segment 2020 - 2024 ($ million)

5.6 Country segment analysis 2020 - 2024

Historic Market Size - Country Segment 2020 - 2024 ($ million)

6. Qualitative Analysis

6.1 Impact of AI on the Global Synthetic Data Generation Software Market

7. Five Forces Analysis

7.1 Five forces summary

Five forces analysis - Comparison between 2025 and 2030

7.2 Bargaining power of buyers

Bargaining power of buyers - Impact of key factors 2025 and 2030

7.3 Bargaining power of suppliers

Bargaining power of suppliers - Impact of key factors in 2025 and 2030

7.4 Threat of new entrants

Threat of new entrants - Impact of key factors in 2025 and 2030

7.5 Threat of substitutes

Threat of substitutes - Impact of key factors in 2025 and 2030

7.6 Threat of rivalry

Threat of rivalry - Impact of key factors in 2025 and 2030

7.7 Market condition

Chart on Market condition - Five forces 2025 and 2030

8. Market Segmentation by Data Type

8.1 Market segments

Chart on Market Segmentation by Data Type - Market share 2025-2030 (%)
Data Table on Market Segmentation by Data Type - Market share 2025-2030 (%)

8.2 Comparison by Market Segmentation by Data Type

Chart on Comparison by Market Segmentation by Data Type
Data Table on Comparison by Market Segmentation by Data Type

8.3 Structured tabular data - Market size and forecast 2025-2030

Chart on Structured tabular data - Market size and forecast 2025-2030 ($ million)
Data Table on Structured tabular data - Market size and forecast 2025-2030 ($ million)
Chart on Structured tabular data - Year-over-year growth 2025-2030 (%)
Data Table on Structured tabular data - Year-over-year growth 2025-2030 (%)

8.4 Image and video data - Market size and forecast 2025-2030

Chart on Image and video data - Market size and forecast 2025-2030 ($ million)
Data Table on Image and video data - Market size and forecast 2025-2030 ($ million)
Chart on Image and video data - Year-over-year growth 2025-2030 (%)
Data Table on Image and video data - Year-over-year growth 2025-2030 (%)

8.5 Text and NLP data - Market size and forecast 2025-2030

Chart on Text and NLP data - Market size and forecast 2025-2030 ($ million)
Data Table on Text and NLP data - Market size and forecast 2025-2030 ($ million)
Chart on Text and NLP data - Year-over-year growth 2025-2030 (%)
Data Table on Text and NLP data - Year-over-year growth 2025-2030 (%)

8.6 Time series and sensor data - Market size and forecast 2025-2030

Chart on Time series and sensor data - Market size and forecast 2025-2030 ($ million)
Data Table on Time series and sensor data - Market size and forecast 2025-2030 ($ million)
Chart on Time series and sensor data - Year-over-year growth 2025-2030 (%)
Data Table on Time series and sensor data - Year-over-year growth 2025-2030 (%)

8.7 Market opportunity by Market Segmentation by Data Type

Market opportunity by Market Segmentation by Data Type ($ million)
Data Table on Market opportunity by Market Segmentation by Data Type ($ million)

9. Market Segmentation by End-user

9.1 Market segments

Chart on End-user - Market share 2025-2030 (%)
Data Table on End-user - Market share 2025-2030 (%)

9.2 Comparison by End-user

Chart on Comparison by End-user
Data Table on Comparison by End-user

9.3 BFSI - Market size and forecast 2025-2030

Chart on BFSI - Market size and forecast 2025-2030 ($ million)
Data Table on BFSI - Market size and forecast 2025-2030 ($ million)
Chart on BFSI - Year-over-year growth 2025-2030 (%)
Data Table on BFSI - Year-over-year growth 2025-2030 (%)

9.4 Healthcare and life sciences - Market size and forecast 2025-2030

Chart on Healthcare and life sciences - Market size and forecast 2025-2030 ($ million)
Data Table on Healthcare and life sciences - Market size and forecast 2025-2030 ($ million)
Chart on Healthcare and life sciences - Year-over-year growth 2025-2030 (%)
Data Table on Healthcare and life sciences - Year-over-year growth 2025-2030 (%)

9.5 Retail and e-commerce - Market size and forecast 2025-2030

Chart on Retail and e-commerce - Market size and forecast 2025-2030 ($ million)
Data Table on Retail and e-commerce - Market size and forecast 2025-2030 ($ million)
Chart on Retail and e-commerce - Year-over-year growth 2025-2030 (%)
Data Table on Retail and e-commerce - Year-over-year growth 2025-2030 (%)

9.6 Automotive and mobility - Market size and forecast 2025-2030

Chart on Automotive and mobility - Market size and forecast 2025-2030 ($ million)
Data Table on Automotive and mobility - Market size and forecast 2025-2030 ($ million)
Chart on Automotive and mobility - Year-over-year growth 2025-2030 (%)
Data Table on Automotive and mobility - Year-over-year growth 2025-2030 (%)

9.7 Others - Market size and forecast 2025-2030

Chart on Others - Market size and forecast 2025-2030 ($ million)
Data Table on Others - Market size and forecast 2025-2030 ($ million)
Chart on Others - Year-over-year growth 2025-2030 (%)
Data Table on Others - Year-over-year growth 2025-2030 (%)

9.8 Market opportunity by End-user

Market opportunity by End-user ($ million)
Data Table on Market opportunity by End-user ($ million)

10. Market Segmentation by Application

10.1 Market segments

Chart on Application - Market share 2025-2030 (%)
Data Table on Application - Market share 2025-2030 (%)

10.2 Comparison by Application

Chart on Comparison by Application
Data Table on Comparison by Application

10.3 AI and ML model training - Market size and forecast 2025-2030

Chart on AI and ML model training - Market size and forecast 2025-2030 ($ million)
Data Table on AI and ML model training - Market size and forecast 2025-2030 ($ million)
Chart on AI and ML model training - Year-over-year growth 2025-2030 (%)
Data Table on AI and ML model training - Year-over-year growth 2025-2030 (%)

10.4 Data privacy and compliance testing - Market size and forecast 2025-2030

Chart on Data privacy and compliance testing - Market size and forecast 2025-2030 ($ million)
Data Table on Data privacy and compliance testing - Market size and forecast 2025-2030 ($ million)
Chart on Data privacy and compliance testing - Year-over-year growth 2025-2030 (%)
Data Table on Data privacy and compliance testing - Year-over-year growth 2025-2030 (%)

10.5 Software testing and QA - Market size and forecast 2025-2030

Chart on Software testing and QA - Market size and forecast 2025-2030 ($ million)
Data Table on Software testing and QA - Market size and forecast 2025-2030 ($ million)
Chart on Software testing and QA - Year-over-year growth 2025-2030 (%)
Data Table on Software testing and QA - Year-over-year growth 2025-2030 (%)

10.6 Fraud detection and cybersecurity - Market size and forecast 2025-2030

Chart on Fraud detection and cybersecurity - Market size and forecast 2025-2030 ($ million)
Data Table on Fraud detection and cybersecurity - Market size and forecast 2025-2030 ($ million)
Chart on Fraud detection and cybersecurity - Year-over-year growth 2025-2030 (%)
Data Table on Fraud detection and cybersecurity - Year-over-year growth 2025-2030 (%)

10.7 Market opportunity by Application

Market opportunity by Application ($ million)
Data Table on Market opportunity by Application ($ million)

11. Customer Landscape

11.1 Customer landscape overview

Analysis of price sensitivity, lifecycle, customer purchase basket, adoption rates, and purchase criteria

12. Geographic Landscape

12.1 Geographic segmentation

Chart on Market share by geography 2025-2030 (%)
Data Table on Market share by geography 2025-2030 (%)

12.2 Geographic comparison

Chart on Geographic comparison
Data Table on Geographic comparison

12.3 North America - Market size and forecast 2025-2030

Chart on North America - Market size and forecast 2025-2030 ($ million)
Data Table on North America - Market size and forecast 2025-2030 ($ million)
Chart on North America - Year-over-year growth 2025-2030 (%)
Data Table on North America - Year-over-year growth 2025-2030 (%)
Chart on Regional Comparison - North America
Data Table on Regional Comparison - North America

12.3.1 US - Market size and forecast 2025-2030

Chart on US - Market size and forecast 2025-2030 ($ million)
Data Table on US - Market size and forecast 2025-2030 ($ million)
Chart on US - Year-over-year growth 2025-2030 (%)
Data Table on US - Year-over-year growth 2025-2030 (%)

12.3.2 Canada - Market size and forecast 2025-2030

Chart on Canada - Market size and forecast 2025-2030 ($ million)
Data Table on Canada - Market size and forecast 2025-2030 ($ million)
Chart on Canada - Year-over-year growth 2025-2030 (%)
Data Table on Canada - Year-over-year growth 2025-2030 (%)

12.3.3 Mexico - Market size and forecast 2025-2030

Chart on Mexico - Market size and forecast 2025-2030 ($ million)
Data Table on Mexico - Market size and forecast 2025-2030 ($ million)
Chart on Mexico - Year-over-year growth 2025-2030 (%)
Data Table on Mexico - Year-over-year growth 2025-2030 (%)

12.4 Europe - Market size and forecast 2025-2030

Chart on Europe - Market size and forecast 2025-2030 ($ million)
Data Table on Europe - Market size and forecast 2025-2030 ($ million)
Chart on Europe - Year-over-year growth 2025-2030 (%)
Data Table on Europe - Year-over-year growth 2025-2030 (%)
Chart on Regional Comparison - Europe
Data Table on Regional Comparison - Europe

12.4.1 Germany - Market size and forecast 2025-2030

Chart on Germany - Market size and forecast 2025-2030 ($ million)
Data Table on Germany - Market size and forecast 2025-2030 ($ million)
Chart on Germany - Year-over-year growth 2025-2030 (%)
Data Table on Germany - Year-over-year growth 2025-2030 (%)

12.4.2 UK - Market size and forecast 2025-2030

Chart on UK - Market size and forecast 2025-2030 ($ million)
Data Table on UK - Market size and forecast 2025-2030 ($ million)
Chart on UK - Year-over-year growth 2025-2030 (%)
Data Table on UK - Year-over-year growth 2025-2030 (%)

12.4.3 France - Market size and forecast 2025-2030

Chart on France - Market size and forecast 2025-2030 ($ million)
Data Table on France - Market size and forecast 2025-2030 ($ million)
Chart on France - Year-over-year growth 2025-2030 (%)
Data Table on France - Year-over-year growth 2025-2030 (%)

12.4.4 The Netherlands - Market size and forecast 2025-2030

Chart on The Netherlands - Market size and forecast 2025-2030 ($ million)
Data Table on The Netherlands - Market size and forecast 2025-2030 ($ million)
Chart on The Netherlands - Year-over-year growth 2025-2030 (%)
Data Table on The Netherlands - Year-over-year growth 2025-2030 (%)

12.4.5 Italy - Market size and forecast 2025-2030

Chart on Italy - Market size and forecast 2025-2030 ($ million)
Data Table on Italy - Market size and forecast 2025-2030 ($ million)
Chart on Italy - Year-over-year growth 2025-2030 (%)
Data Table on Italy - Year-over-year growth 2025-2030 (%)

12.4.6 Spain - Market size and forecast 2025-2030

Chart on Spain - Market size and forecast 2025-2030 ($ million)
Data Table on Spain - Market size and forecast 2025-2030 ($ million)
Chart on Spain - Year-over-year growth 2025-2030 (%)
Data Table on Spain - Year-over-year growth 2025-2030 (%)

12.5 APAC - Market size and forecast 2025-2030

Chart on APAC - Market size and forecast 2025-2030 ($ million)
Data Table on APAC - Market size and forecast 2025-2030 ($ million)
Chart on APAC - Year-over-year growth 2025-2030 (%)
Data Table on APAC - Year-over-year growth 2025-2030 (%)
Chart on Regional Comparison - APAC
Data Table on Regional Comparison - APAC

12.5.1 China - Market size and forecast 2025-2030

Chart on China - Market size and forecast 2025-2030 ($ million)
Data Table on China - Market size and forecast 2025-2030 ($ million)
Chart on China - Year-over-year growth 2025-2030 (%)
Data Table on China - Year-over-year growth 2025-2030 (%)

12.5.2 India - Market size and forecast 2025-2030

Chart on India - Market size and forecast 2025-2030 ($ million)
Data Table on India - Market size and forecast 2025-2030 ($ million)
Chart on India - Year-over-year growth 2025-2030 (%)
Data Table on India - Year-over-year growth 2025-2030 (%)

12.5.3 Japan - Market size and forecast 2025-2030

Chart on Japan - Market size and forecast 2025-2030 ($ million)
Data Table on Japan - Market size and forecast 2025-2030 ($ million)
Chart on Japan - Year-over-year growth 2025-2030 (%)
Data Table on Japan - Year-over-year growth 2025-2030 (%)

12.5.4 South Korea - Market size and forecast 2025-2030

Chart on South Korea - Market size and forecast 2025-2030 ($ million)
Data Table on South Korea - Market size and forecast 2025-2030 ($ million)
Chart on South Korea - Year-over-year growth 2025-2030 (%)
Data Table on South Korea - Year-over-year growth 2025-2030 (%)

12.5.5 Australia - Market size and forecast 2025-2030

Chart on Australia - Market size and forecast 2025-2030 ($ million)
Data Table on Australia - Market size and forecast 2025-2030 ($ million)
Chart on Australia - Year-over-year growth 2025-2030 (%)
Data Table on Australia - Year-over-year growth 2025-2030 (%)

12.5.6 Indonesia - Market size and forecast 2025-2030

Chart on Indonesia - Market size and forecast 2025-2030 ($ million)
Data Table on Indonesia - Market size and forecast 2025-2030 ($ million)
Chart on Indonesia - Year-over-year growth 2025-2030 (%)
Data Table on Indonesia - Year-over-year growth 2025-2030 (%)

12.6 Middle East and Africa - Market size and forecast 2025-2030

Chart on Middle East and Africa - Market size and forecast 2025-2030 ($ million)
Data Table on Middle East and Africa - Market size and forecast 2025-2030 ($ million)
Chart on Middle East and Africa - Year-over-year growth 2025-2030 (%)
Data Table on Middle East and Africa - Year-over-year growth 2025-2030 (%)
Chart on Regional Comparison - Middle East and Africa
Data Table on Regional Comparison - Middle East and Africa

12.6.1 Saudi Arabia - Market size and forecast 2025-2030

Chart on Saudi Arabia - Market size and forecast 2025-2030 ($ million)
Data Table on Saudi Arabia - Market size and forecast 2025-2030 ($ million)
Chart on Saudi Arabia - Year-over-year growth 2025-2030 (%)
Data Table on Saudi Arabia - Year-over-year growth 2025-2030 (%)

12.6.2 UAE - Market size and forecast 2025-2030

Chart on UAE - Market size and forecast 2025-2030 ($ million)
Data Table on UAE - Market size and forecast 2025-2030 ($ million)
Chart on UAE - Year-over-year growth 2025-2030 (%)
Data Table on UAE - Year-over-year growth 2025-2030 (%)

12.6.3 South Africa - Market size and forecast 2025-2030

Chart on South Africa - Market size and forecast 2025-2030 ($ million)
Data Table on South Africa - Market size and forecast 2025-2030 ($ million)
Chart on South Africa - Year-over-year growth 2025-2030 (%)
Data Table on South Africa - Year-over-year growth 2025-2030 (%)

12.6.4 Israel - Market size and forecast 2025-2030

Chart on Israel - Market size and forecast 2025-2030 ($ million)
Data Table on Israel - Market size and forecast 2025-2030 ($ million)
Chart on Israel - Year-over-year growth 2025-2030 (%)
Data Table on Israel - Year-over-year growth 2025-2030 (%)

12.6.5 Turkey - Market size and forecast 2025-2030

Chart on Turkey - Market size and forecast 2025-2030 ($ million)
Data Table on Turkey - Market size and forecast 2025-2030 ($ million)
Chart on Turkey - Year-over-year growth 2025-2030 (%)
Data Table on Turkey - Year-over-year growth 2025-2030 (%)

12.7 South America - Market size and forecast 2025-2030

Chart on South America - Market size and forecast 2025-2030 ($ million)
Data Table on South America - Market size and forecast 2025-2030 ($ million)
Chart on South America - Year-over-year growth 2025-2030 (%)
Data Table on South America - Year-over-year growth 2025-2030 (%)
Chart on Regional Comparison - South America
Data Table on Regional Comparison - South America

12.7.1 Brazil - Market size and forecast 2025-2030

Chart on Brazil - Market size and forecast 2025-2030 ($ million)
Data Table on Brazil - Market size and forecast 2025-2030 ($ million)
Chart on Brazil - Year-over-year growth 2025-2030 (%)
Data Table on Brazil - Year-over-year growth 2025-2030 (%)

12.7.2 Argentina - Market size and forecast 2025-2030

Chart on Argentina - Market size and forecast 2025-2030 ($ million)
Data Table on Argentina - Market size and forecast 2025-2030 ($ million)
Chart on Argentina - Year-over-year growth 2025-2030 (%)
Data Table on Argentina - Year-over-year growth 2025-2030 (%)

12.7.3 Colombia - Market size and forecast 2025-2030

Chart on Colombia - Market size and forecast 2025-2030 ($ million)
Data Table on Colombia - Market size and forecast 2025-2030 ($ million)
Chart on Colombia - Year-over-year growth 2025-2030 (%)
Data Table on Colombia - Year-over-year growth 2025-2030 (%)

12.8 Market opportunity by geography

Market opportunity by geography ($ million)
Data Tables on Market opportunity by geography ($ million)

13. Drivers, Challenges, and Opportunity

13.1 Market drivers

Escalating regulatory pressures to protect personal information
Indispensable need for diverse and high-volume training data in AI development
Cost optimization and accelerated time-to-market for digital products

13.2 Market challenges

Maintaining data fidelity and preventing risk of model collapse
Integration complexities and interoperability with legacy data infrastructures
Lack of universal standards regarding synthetic outputs

13.3 Impact of drivers and challenges

Impact of drivers and challenges in 2025 and 2030

13.4 Market opportunities

Enhanced privacy compliance and proliferation of privacy-enhancing technologies
Integration of generative AI for high-fidelity data augmentation in large language models
Expansion of digital twins and simulated environments for autonomous systems

14. Competitive Landscape

14.1 Overview

14.2

Overview on criticality of inputs and factors of differentiation

14.3 Landscape disruption

Overview on factors of disruption

14.4 Industry risks

Impact of key risks on business

15. Competitive Analysis

15.1 Companies profiled

Companies covered

15.2 Company ranking index

15.3 Market positioning of companies

Matrix on companies position and classification

15.4 Aetion Inc.

Aetion Inc. - Overview
Aetion Inc. - Product / Service
Aetion Inc. - Key offerings
SWOT

15.5 GenRocket Inc.

GenRocket Inc. - Overview
GenRocket Inc. - Product / Service
GenRocket Inc. - Key offerings
SWOT

15.6 Google LLC

Google LLC - Overview
Google LLC - Product / Service
Google LLC - Key offerings
SWOT

15.7 MDClone Ltd.

MDClone Ltd. - Overview
MDClone Ltd. - Product / Service
MDClone Ltd. - Key offerings
SWOT

15.8 MOSTLY AI

MOSTLY AI - Overview
MOSTLY AI - Product / Service
MOSTLY AI - Key offerings
SWOT

15.9 NVIDIA Corp.

NVIDIA Corp. - Overview
NVIDIA Corp. - Business segments
NVIDIA Corp. - Key news
NVIDIA Corp. - Key offerings
NVIDIA Corp. - Segment focus
SWOT

15.10 Parallel Domain

Parallel Domain - Overview
Parallel Domain - Product / Service
Parallel Domain - Key offerings
SWOT

15.11 Rendered.ai

Rendered.ai - Overview
Rendered.ai - Product / Service
Rendered.ai - Key offerings
SWOT

15.12 SAS Institute Inc.

SAS Institute Inc. - Overview
SAS Institute Inc. - Product / Service
SAS Institute Inc. - Key news
SAS Institute Inc. - Key offerings
SWOT

15.13 Scale AI

Scale AI - Overview
Scale AI - Product / Service
Scale AI - Key offerings
SWOT

15.14 Synthesized Ltd

Synthesized Ltd - Overview
Synthesized Ltd - Product / Service
Synthesized Ltd - Key offerings
SWOT

15.15 Syntho

Syntho - Overview
Syntho - Product / Service
Syntho - Key offerings
SWOT

15.16 Tonic AI Inc.

Tonic AI Inc. - Overview
Tonic AI Inc. - Product / Service
Tonic AI Inc. - Key offerings
SWOT

15.17 Unity Technologies Inc.

Unity Technologies Inc. - Overview
Unity Technologies Inc. - Business segments
Unity Technologies Inc. - Key news
Unity Technologies Inc. - Key offerings
Unity Technologies Inc. - Segment focus
SWOT

15.18 YData

YData - Overview
YData - Product / Service
YData - Key offerings
SWOT

16. Appendix

16.1 Scope of the report

Market definition
Objectives
Notes and caveats

16.2 Inclusions and exclusions checklist

Inclusions checklist
Exclusions checklist

16.3 Currency conversion rates for US$

16.4 Research methodology

16.5 Data procurement

Information sources

16.6 Data validation

16.7 Validation techniques employed for market sizing

16.8 Data synthesis

16.9 360 degree market analysis

16.10 List of abbreviations

Research Methodology

Technavio presents a detailed picture of the market by way of study, synthesis, and summation of data from multiple sources. The analysts have presented the various facets of the market with a particular focus on identifying the key industry influencers. The data thus presented is comprehensive, reliable, and the result of extensive research, both primary and secondary.

INFORMATION SOURCES

Primary sources

  • Manufacturers and suppliers
  • Channel partners
  • Industry experts
  • Strategic decision makers

Secondary sources

  • Industry journals and periodicals
  • Government data
  • Financial reports of key industry players
  • Historical data
  • Press releases

DATA ANALYSIS

Data Synthesis

  • Collation of data
  • Estimation of key figures
  • Analysis of derived insights

Data Validation

  • Triangulation with data models
  • Reference against proprietary databases
  • Corroboration with industry experts

REPORT WRITING

Qualitative

  • Market drivers
  • Market challenges
  • Market trends
  • Five forces analysis

Quantitative

  • Market size and forecast
  • Market segmentation
  • Geographical insights
  • Competitive landscape

Interested in this report?

Get your sample now to see our research methodology and insights!

Download Now

Frequently Asked Questions

Synthetic Data Generation Software market growth will increase by USD 3053.6 million during 2026-2030.

The Synthetic Data Generation Software market is expected to grow at a CAGR of 46.4% during 2026-2030.

Synthetic Data Generation Software market is segmented by Data type (Structured tabular data, Image and video data, Text and NLP data, Time series and sensor data) End-user (BFSI, Healthcare and life sciences, Retail and e-commerce, Automotive and mobility, Others) Application (AI and ML model training, Data privacy and compliance testing, Software testing and QA, Fraud detection and cybersecurity)

Aetion Inc., Capgemini SE, Databricks Inc., GenRocket Inc., Google LLC, Gretel AI, K2View, MDClone Ltd., MOSTLY AI, NVIDIA Corp., Parallel Domain, Rendered.ai, SAS Institute Inc., Scale AI, Synth Studio, Synthesized Ltd, Syntho, Tonic AI Inc., Unity Technologies Inc., YData are a few of the key vendors in the Synthetic Data Generation Software market.

North America will register the highest growth rate of 36.4% among the other regions. Therefore, the Synthetic Data Generation Software market in North America is expected to garner significant business opportunities for the vendors during the forecast period.

US, Canada, Mexico, Germany, UK, France, The Netherlands, Italy, Spain, China, India, Japan, South Korea, Australia, Indonesia, Saudi Arabia, UAE, South Africa, Israel, Turkey, Brazil, Argentina, Colombia

  • Escalating regulatory pressures to protect personal information is the driving factor this market.

The Synthetic Data Generation Software market vendors should focus on grabbing business opportunities from the Data type segment as it accounted for the largest market share in the base year.
RIA - Research AI Assistant
Ask RIA