India Synthetic Leather Market Size 2025-2029
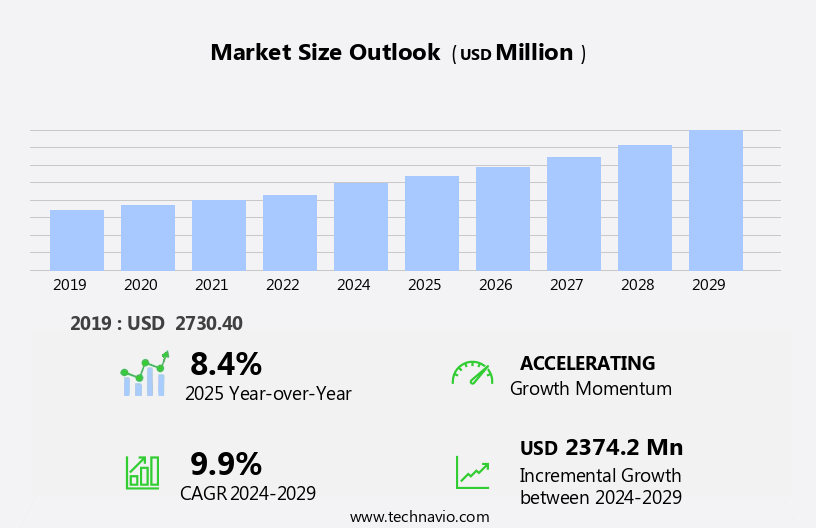
The India synthetic leather market size is forecast to increase by USD 2.37 billion at a CAGR of 9.9% between 2024 and 2029.
- The market is experiencing significant growth due to several key trends. One of the primary drivers is the increasing usage of polyurethane (PU) synthetic leather materials, which offer advantages such as durability, flexibility, and cost-effectiveness compared to natural leather. Another trend is the growing demand for customized synthetic leather, as consumers seek unique and personalized products. Additionally, synthetic leather is widely used in clothing, wallets, purses, luggage, boots, and shoes, further expanding its reach. However, concerns regarding the potential harmful effects of PU and polyvinyl chloride (PVC) on human health are posing challenges to the market's growth. Producers must address these concerns by investing in research and development of eco-friendly and safer synthetic leather alternatives. Overall, the market is expected to continue its expansion, driven by these trends and the ongoing demand for sustainable, cost-effective, and customizable alternatives to natural leather.
What will be the size of the India Synthetic Leather Market during the forecast period?
- The market encompasses the production and distribution of artificial materials resembling genuine leather, primarily composed of polyurethane (PU) and polyvinyl chloride (PVC). This market exhibits significant growth due to its versatility, durability, and cost-effectiveness compared to natural leather. Synthetic leather finds extensive applications in various industries, including footwear, furnishing, and automotive. In footwear, the increasing popularity of athleisure trends and faux leather footwear propels market expansion. The furnishing industry, particularly in sectors like marine furnishing, also experiences substantial growth due to synthetic leather's resistance to climatic conditions. In the automotive sector, synthetic leather upholstery offers enhanced comfort and durability, contributing to market momentum.
How is this market segmented and which is the largest segment?
The market research report provides comprehensive data (region-wise segment analysis), with forecasts and estimates in "USD million" for the period 2025-2029, as well as historical data from 2019-2023 for the following segments.
- Application
- Footwear
- Furnishing
- Automotive
- Clothing
- Others
- Type
- PVC
- PU
- Bio-based
- Geography
- India
By Application Insights
- The footwear segment is estimated to witness significant growth during the forecast period. Synthetic leather, also known as artificial leather, is a popular material in various industries due to its durability and versatility. In the footwear sector, it is extensively used in shoe uppers, linings, and soles. India's growing urbanization and increasing demand for footwear are driving the market. PU (polyurethane) and PVC (polyvinyl chloride) coated fabrics are commonly used in creating synthetic leather uppers, providing both structural support and an aesthetic appeal. The material's lightweight yet sturdy construction caters to diverse footwear designs, from casual to formal and sports-oriented. The automotive, furnishing, and clothing industries also utilize them for their environmental advantages, such as being cruelty-free and biodegradable.
- However, concerns regarding health and environmental risks associated with petrochemicals and micro plastics persist. The manufacturing infrastructure, skilled workforce, and supply chains are essential for its production and distribution. The footwear industry's shift towards sustainable materials and the athleisure trend are expected to influence the demand for them in the future.
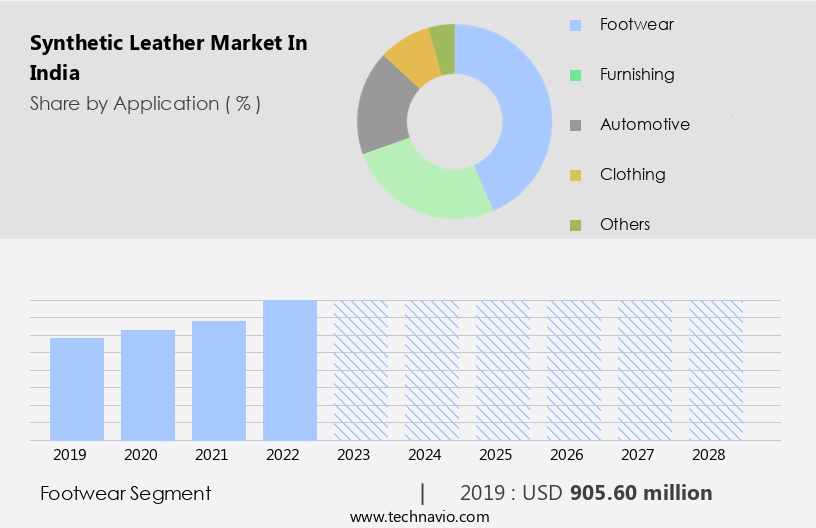
Get a glance at the market share of various segments Request Free Sample
The Footwear segment was valued at USD 905.60 million in 2019 and showed a gradual increase during the forecast period.
Market Dynamics
Our researchers analyzed the data with 2024 as the base year, along with the key drivers, trends, and challenges. A holistic analysis of drivers will help companies refine their marketing strategies to gain a competitive advantage.
What are the key market drivers leading to the rise in adoption of India Synthetic Leather Market?
- Increasing penetration of polyurethane (PU) synthetic leather materials is the key driver of the market. Synthetic leather, also known as artificial leather, is a material commonly used as an alternative to genuine leather. It is primarily made from polyurethane (PU) and polyvinyl chloride (PVC), with flexible polymers and other materials like polyester or cotton. PU-based synthetic leather is produced using soft polymers, eliminating the need for additional plasticizers, resulting in advantages such as water resistance, lightness, and softness. However, under certain conditions, it can easily shred. PU-based synthetic leather is widely used in various industries, including footwear, furnishing, automotive, clothing, bags, purses, and wallets. In the footwear industry, it is used for shoe uppers, linings, and soles.
- In the furnishing industry, it is used for marine furnishing and the automotive sector interiors. In the automotive industry, it is used for car seats and interiors. In the clothing industry, it is used for jackets, coats, and other apparel. PU-based synthetic leather is considered more environmentally friendly than PVC-based leather as it does not produce dioxins. However, it is more expensive due to its time-consuming manufacturing process. The urbanization trend has led to an increase in demand for leather in various industries due to its durability, environmental advantages, and cruelty-free choices. The manufacturing infrastructure, skilled workforce, and supply chains of these industries have enabled the widespread use of synthetic leather.
What are the market trends shaping the India Synthetic Leather Market?
- Customization of synthetic leather is the upcoming trend in the market. The leather, also known as artificial leather, is a material gaining popularity due to its customization capabilities. Manufactured from polyurethane (PU) and polyvinyl chloride (PVC), this material is increasingly preferred in industries such as footwear, furnishing, automotive, clothing, bags, purses, and wallets. Customization options include design, hue, sheen, and texture, catering to consumers' unique preferences. Digital techniques like laser printing and cutting enable traditional embossing. This trend has seen significant growth in the past five years, driven by urbanization and the increasing demand for cruelty-free choices.
- Customized synthetic leather presents environmental advantages, such as reduced water usage and lower carbon emissions compared to natural leather. However, concerns regarding health and environmental risks associated with petrochemicals, biodegradability, and micro plastics remain. Despite these challenges, the market continues to expand, driven by the durability and versatility of the leather. In the footwear industry, leather is used for shoe uppers, linings, and soles. In the furnishing industry, it is utilized in the marine furnishing and automotive sectors. The athleisure trend has led to the increased production of faux leather footwear. In the clothing industry, leather is used for boots, shoes, and various types of bags and purses.
What challenges does India Synthetic Leather Market face during the growth?
- Harmful effects of PU and PVC on humans is a key challenge affecting the market growth. Synthetic leather, also known as artificial leather, is a material commonly used in various industries, including footwear, furnishing, and automotive, due to its durability and affordability. However, the production from raw materials like polyurethane (PU) and polyvinyl chloride (PVC) poses significant risks to human health and the environment. PU, a key component of synthetic leather, can cause respiratory issues for workers, leading to lung irritation, asthma attacks, and even lung infections. Workers in PU production facilities are frequently exposed to its fumes, which can cause nausea, vomiting, and vertigo. PVC, another common raw material, emits toxic dioxins during production, which are linked to cancer and other health problems.
- Moreover, PVC contains plasticizers like phthalates, which disrupt hormonal functions and potentially affect fertility and development. Both PU and PVC are non-biodegradable, contributing to long-term pollution. Improper disposal, such as burning PVC, releases toxic gases that harm ecosystems and human health. Despite these concerns, it remains popular due to its durability and cost-effectiveness. The footwear industry, for instance, heavily relies on leather for manufacturing shoe uppers, linings, and soles. The automotive sector uses it for car interiors, and the furnishing industry, including marine furnishing, employs it for upholstery. The athletic trend has also led to a rise in demand for faux leather footwear.
Exclusive India Synthetic Leather Market Customer Landscape
The market forecasting report includes the adoption lifecycle of the market, covering from the innovator's stage to the laggard's stage. It focuses on adoption rates in different regions based on penetration. Furthermore, the report also includes key purchase criteria and drivers of price sensitivity to help companies evaluate and develop their market growth analysis strategies.
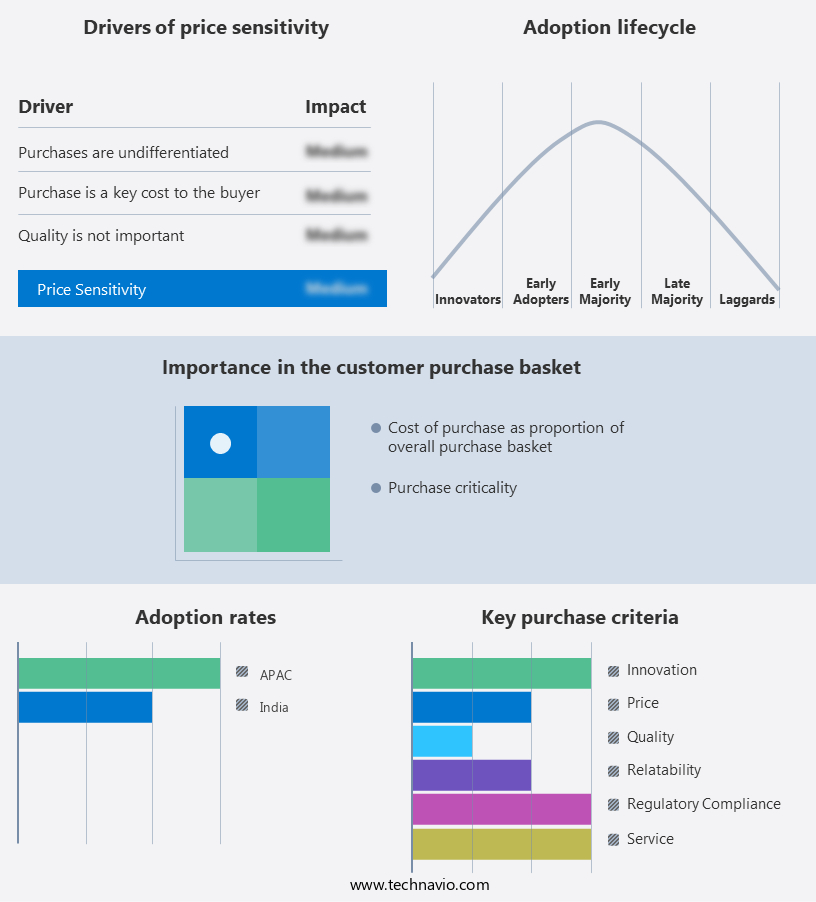
Customer Landscape
Key Companies & Market Insights
Companies are implementing various strategies, such as strategic alliances, market forecast partnerships, mergers and acquisitions, geographical expansion, and product/service launches, to enhance their presence in the market.
Colence Pvt. Ltd. - The company offers synthetic leathers such as PU and PVC.
The market research and growth report includes detailed analyses of the competitive landscape of the market and information about key companies, including:
- BASF SE
- Daman Textiles
- Giriraj Coated Fab Pvt. Ltd.
- GTEX Fabrics Pvt. Ltd.
- H.R. Polycoats Pvt. Ltd.
- Jasch Industries Ltd.
- Marvel Vinyls Ltd.
- Mayur Uniquoters Ltd.
- Natroyal Group
- Nirmal Fibres Pvt. Ltd.
- Om Textiles India
- Premier Polyfilm Ltd.
- Response Fabrics Pvt. Ltd.
- Responsive Industries Ltd.
- RMG Polyvinyl India Ltd.
- Shakti Tex Coaters Pvt. Ltd.
- United Decoratives Pvt. Ltd.
- Vortex Flex Pvt. Ltd.
- Winner Nippon Leatherette Pvt. Ltd.
Qualitative and quantitative analysis of companies has been conducted to help clients understand the wider business environment as well as the strengths and weaknesses of key market players. Data is qualitatively analyzed to categorize companies as pure play, category-focused, industry-focused, and diversified; it is quantitatively analyzed to categorize companies as dominant, leading, strong, tentative, and weak.
Research Analyst Overview
Synthetic leather, also known as artificial leather, has emerged as a significant alternative to natural leather in various industries due to its versatility and cost-effectiveness. This material, primarily made from polyurethane (PU) and polyvinyl chloride (PVC), offers several advantages that make it an attractive choice for footwear, furnishing, and automotive applications. The market is driven by several factors, including urbanization, increasing consumer awareness towards cruelty-free choices, and the desire for durable and environmentally-friendly materials. The raw materials used in the production, such as petrochemicals, have raised concerns regarding health and environmental risks. However, advancements in technology have led to the development of biodegradable synthetic leather and the reduction of micro plastics in the manufacturing process.
Moreover, the footwear industry is a major consumer of synthetic leather, with its use extending beyond traditional footwear to include faux leather footwear in the athleisure trend. The material's durability and resistance to water and stains make it an ideal choice for shoe uppers, linings, and soles. In the automotive sector, it is used for seat covers, door panels, and other interior applications due to its resistance to wear and tear and its ability to mimic the look and feel of natural leather. Automotive interior leather, known for its premium quality and aesthetic appeal, continues to be a popular choice for high-end vehicle interiors, combining luxury with durability. The furnishing industry also benefits, with its use in marine furnishing, upholstery, and other applications.
Furthermore, the material's resistance to moisture and sunlight makes it an excellent choice for these applications, ensuring long-lasting durability. In the clothing industry, it is used for jackets, bags, purses, and wallets, providing an affordable and sustainable alternative to natural leather. The manufacturing infrastructure for production is well-established, with a skilled workforce and efficient supply chains ensuring a consistent and reliable supply of the material. The use of PU and PVC as raw materials, however, requires careful handling and processing to ensure the final product's quality and safety. The climatic conditions in various regions can impact the production and application of synthetic leather.
|
Market Scope |
|
|
Report Coverage |
Details |
|
Page number |
155 |
|
Base year |
2024 |
|
Historic period |
2019-2023 |
|
Forecast period |
2025-2029 |
|
Growth momentum & CAGR |
Accelerate at a CAGR of 9.9% |
|
Market growth 2025-2029 |
USD 2.37 billion |
|
Market structure |
Fragmented |
|
YoY growth 2024-2025(%) |
8.4 |
|
Competitive landscape |
Leading Companies, Market Positioning of Companies, Competitive Strategies, and Industry Risks |
What are the Key Data Covered in this Market Research Report?
- CAGR of the market during the forecast period
- Detailed information on factors that will drive the market growth and forecasting between 2025 and 2029
- Precise estimation of the size of the market and its contribution of the market in focus to the parent market
- Accurate predictions about upcoming market growth and trends and changes in consumer behaviour
- Growth of the market across India
- Thorough analysis of the market's competitive landscape and detailed information about companies
- Comprehensive analysis of factors that will challenge the growth of market companies
We can help! Our analysts can customize this market research report to meet your requirements Get in touch
 RIA -
RIA - 
