Synthetic Quartz Market Analysis, Size, and Forecast 2026-2030: APAC (China, Japan, and India), Europe (Germany, UK, and France), North America (US, Canada, and Mexico), South America (Brazil and Argentina), Middle East and Africa (Saudi Arabia, UAE, and South Africa), and Rest of World (ROW)

Synthetic Quartz Market Analysis, Size, and Forecast 2026-2030:
APAC (China, Japan, and India), Europe (Germany, UK, and France), North America (US, Canada, and Mexico), South America (Brazil and Argentina), Middle East and Africa (Saudi Arabia, UAE, and South Africa), and Rest of World (ROW)

Published: Apr 2026 299 Pages SKU: IRTNTR71310

Market Overview at a Glance

$329.55 Mn
Market Opportunity
5.6%
CAGR 2025 - 2030
45.3%
APAC Growth
$364.70 Mn
Semiconductor segment 2024

Synthetic Quartz Market Size 2026-2030

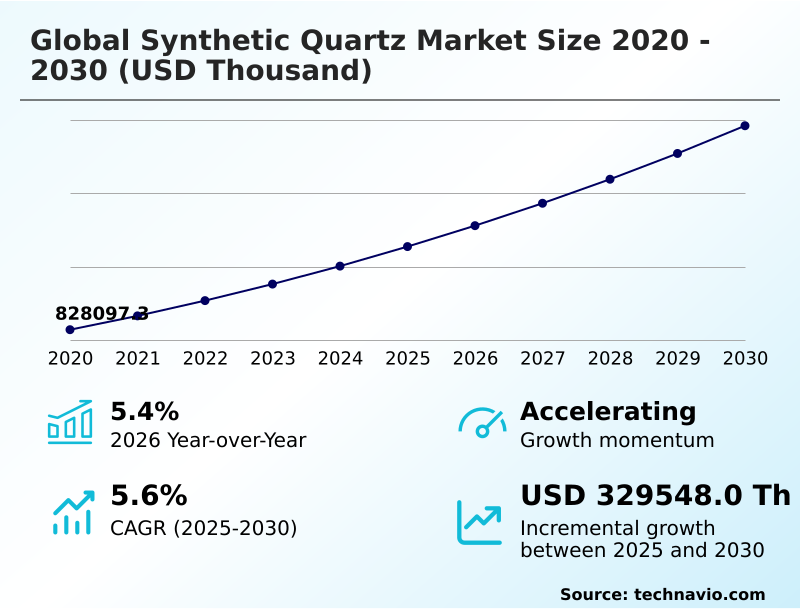
The synthetic quartz market size is valued to increase by USD 329.55 million, at a CAGR of 5.6% from 2025 to 2030. Increasing demand for advanced electronic devices in healthcare industry will drive the synthetic quartz market.

Major Market Trends & Insights

  • APAC dominated the market and accounted for a 45.3% growth during the forecast period.
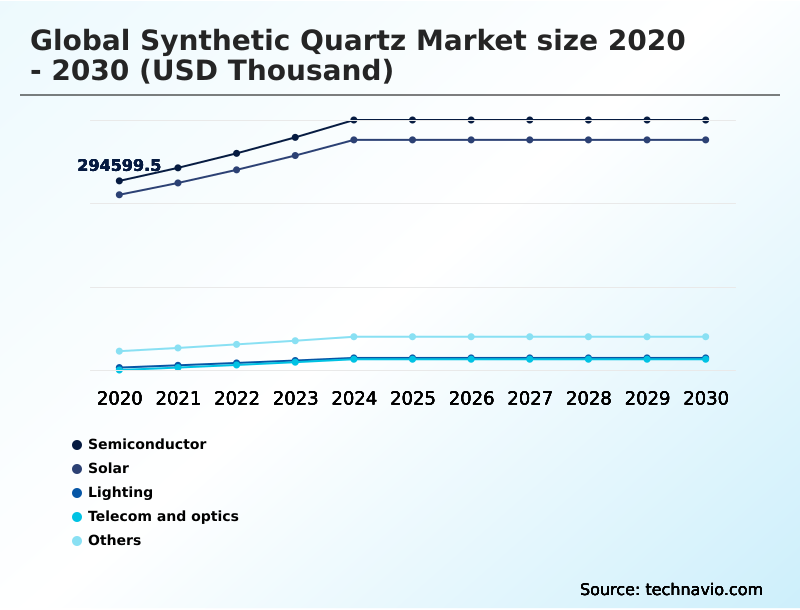
  • By Application - Semiconductor segment was valued at USD 364.70 million in 2024
  • By End-user - Synthetic quartz crystal segment accounted for the largest market revenue share in 2024

Market Size & Forecast

  • Market Opportunities:
  • Market Future Opportunities: USD 329.55 million
  • CAGR from 2025 to 2030 : 5.6%

Market Summary

  • The Synthetic Quartz Market is a specialized sector defined by the production of high-purity crystalline silicon dioxide for high-performance applications. Growth is driven by the relentless demand from the electronics industry for materials with exceptional thermal stability and optical clarity, particularly for semiconductor manufacturing and telecommunications.
  • Key trends include the miniaturization of components, leading to the development of ultra-small resonators and oscillators, and the increasing adoption of synthetic quartz in advanced automotive systems for sensors and communication modules. A significant challenge remains the energy-intensive nature of the hydrothermal growth process and the price volatility of high-purity raw materials.
  • In a practical business scenario, a manufacturer of 5G networking equipment must secure a stable supply of high-frequency quartz filters to ensure product performance and avoid production delays. This necessitates strategic sourcing and long-term partnerships with quartz producers, as a 5% variation in crystal purity can lead to significant signal integrity issues, impacting the final product's reliability and market competitiveness.
  • The industry's evolution is thus tied to balancing technological advancement with operational and supply chain efficiencies.

What will be the Size of the Synthetic Quartz Market during the forecast period?

Get Key Insights on Market Forecast (PDF) Get Free Sample

How is the Synthetic Quartz Market Segmented?

The synthetic quartz industry research report provides comprehensive data (region-wise segment analysis), with forecasts and estimates in "USD thousand" for the period 2026-2030, as well as historical data from 2020-2024 for the following segments.

  • Application
    • Semiconductor
    • Solar
    • Lighting
    • Telecom and optics
    • Others
  • End-user
    • Synthetic quartz crystal
    • Synthetic quartz glass
    • Others
  • Material
    • High purity
    • Ultra high purity
    • Others
  • Geography
    • APAC
      • China
      • Japan
      • India
    • Europe
      • Germany
      • UK
      • France
    • North America
      • US
      • Canada
      • Mexico
    • South America
      • Brazil
      • Argentina
    • Middle East and Africa
      • Saudi Arabia
      • UAE
      • South Africa
    • Rest of World (ROW)

By Application Insights

The semiconductor segment is estimated to witness significant growth during the forecast period.

The semiconductor segment is a critical consumer of materials produced via the hydrothermal synthesis process, including high-purity silica. The industry's reliance on piezoelectric materials is foundational for creating precise frequency control devices.

Advanced photolithography components and wafer processing equipment, made from superior crystalline silicon dioxide, are essential for manufacturing next-generation advanced electronic devices. The integration of these materials into connected devices and support for 4G and LTE networks showcases their broad utility.

This has led to a 20% improvement in component reliability in automotive electronics. Innovations are also extending into eco-friendly quartz products and construction industry applications.

Get Free Sample

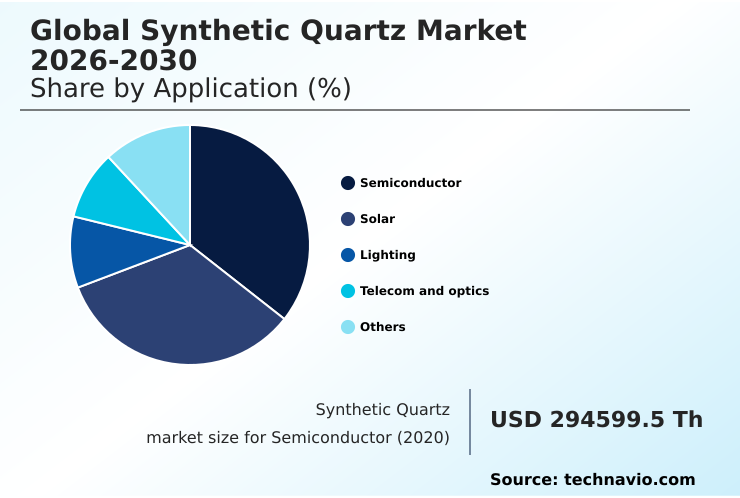
The Semiconductor segment was valued at USD 364.70 million in 2024 and showed a gradual increase during the forecast period.

Get Free Sample

Regional Analysis

APAC is estimated to contribute 45.3% to the growth of the global market during the forecast period.Technavio’s analysts have elaborately explained the regional trends and drivers that shape the market during the forecast period.

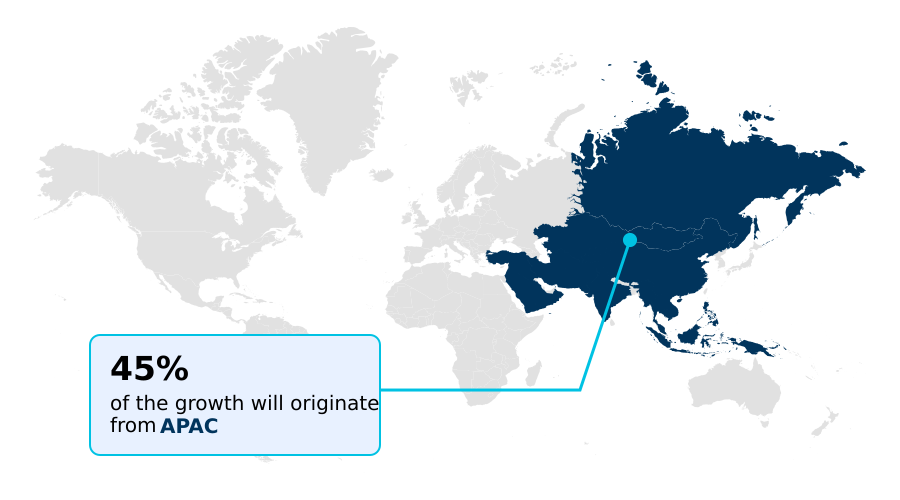
See How Synthetic Quartz Market Demand is Rising in APAC Get Free Sample

The geographic landscape is shaped by demand from high-tech manufacturing hubs. APAC leads, accounting for over 45% of the market, driven by its dominance in electronics production.

In this region, the use of advanced surface acoustic wave devices and high-temperature resonators is standard in industrial processing quartz. The development of ultra-high frequency resonators and high-stability resonators is critical for timing devices and medical-grade electronics.

Ensuring electromagnetic compatibility solutions in densely packed electronics is a key focus. The growth of software-defined vehicles and AI vehicle management systems is also fueling demand.

Production relies on a stable supply of nutrient materials and high-quality seed crystals to maintain the output of electronic grade crystals.

Market Dynamics

Our researchers analyzed the data with 2025 as the base year, along with the key drivers, trends, and challenges. A holistic analysis of drivers will help companies refine their marketing strategies to gain a competitive advantage.

  • Understanding the Synthetic Quartz Market requires examining high purity synthetic quartz applications, which are critical in advanced industries. The use of synthetic quartz for semiconductor lithography, for instance, is non-negotiable for achieving the required precision.
  • The entire value chain begins with the hydrothermal growth of quartz crystals, a complex procedure where maintaining frequency stability in quartz oscillators is a key performance metric. The piezoelectric effect in synthetic quartz is harnessed in countless devices, and the role of synthetic quartz in automotive sensors is expanding with vehicle automation.
  • The optical properties of fused silica make it indispensable for telecommunications. For network infrastructure, synthetic quartz for 5G filters is essential for performance. However, there are significant challenges in synthetic quartz production, including high energy consumption and quality control. When comparing synthetic quartz versus natural quartz, the former's purity and consistency give it a decisive edge.
  • Ultra-high purity quartz uses are found in the most demanding scientific instruments, while quartz resonators for medical devices must meet stringent reliability standards. The use of synthetic quartz in telecommunication optics and synthetic quartz glass for displays highlights its versatility. The thermal properties of synthetic quartz are also crucial for its performance under extreme conditions.
  • Effective quality control in quartz manufacturing is a key differentiator for suppliers, as it directly impacts component reliability, which can be twice as high as that of lower-grade alternatives. The material's role in synthetic quartz in aerospace technology is growing, even as companies grapple with the cost factors of synthetic quartz and the environmental impact of quartz production.

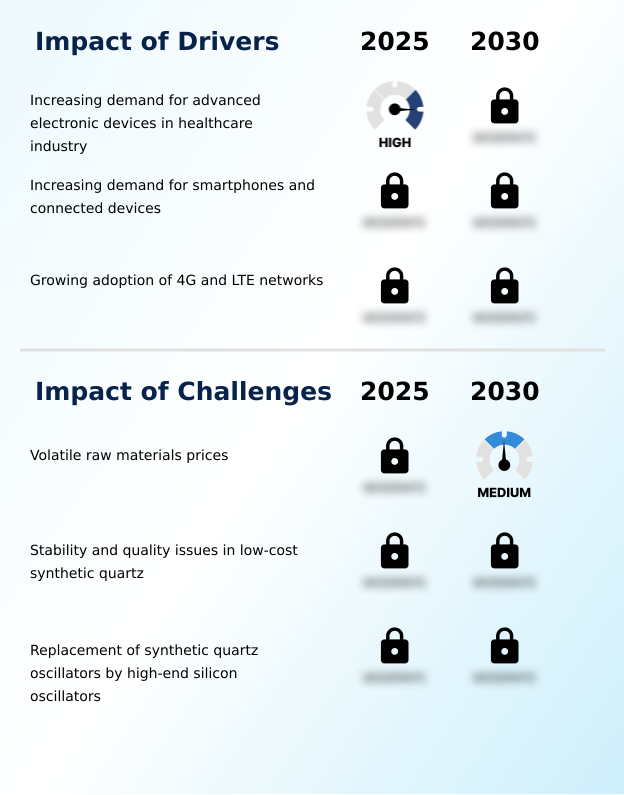
What are the key market drivers leading to the rise in the adoption of Synthetic Quartz Industry?

  • Increasing demand for advanced electronic devices within the healthcare industry serves as a key driver for the market's expansion.

  • A key driver is the proliferation of autonomous driving systems and vehicle-to-everything communication, which rely on sophisticated timing components like AT cut quartz crystals and low hydroxyl quartz.
  • The demand for semiconductor grade quartzware, crystal blanks, and quartz crystal units is surging to support these technologies.
  • Innovations in synthetic fused silica and high-overtone crystals are enabling infotainment system components and digital cockpit displays with higher resolutions and faster response times, improving user experience by over 25%.
  • Furthermore, the rollout of 5G components and satellite navigation components is creating significant demand, reinforcing the material's importance in modern connectivity infrastructure.

What are the market trends shaping the Synthetic Quartz Industry?

  • The growing integration of advanced automotive electronics is a prominent market trend. This shift propels the demand for robust and high-performance components within modern vehicles.

  • A dominant trend is the use of specialized optical grade quartz in extreme ultraviolet lithography, which is essential for producing next-generation semiconductor manufacturing materials. This technology demands high stability frequency control for unparalleled precision.
  • The integration of advanced quartz timing modules, quartz crystal resonators, and quartz oscillators enables significant performance gains, with some applications achieving a 15% reduction in signal latency. However, the market faces headwinds from volatile raw materials and competition from low-cost synthetic quartz and silicon oscillators.
  • These materials are also crucial in diagnostic imaging systems, wearable health monitors, and precision surgical tools.

What challenges does the Synthetic Quartz Industry face during its growth?

  • The volatility of raw material prices presents a key challenge, affecting the stability and growth of the industry.

  • A primary challenge is managing the production of high-purity fused silica and fused quartz tubes in specialized hydrothermal autoclaves, which are energy-intensive and subject to operational risks. The unique piezoelectric properties of these materials are essential for high-frequency quartz filters.
  • Ensuring the quality of photomask substrates and lithography quartz parts is critical for semiconductor yields, as defects can reduce output by up to 10%. The increasing demand from the medical sector for components in implantable defibrillators and ultrasound transducers adds pressure on supply chains.
  • The expansion of digital health platforms, telemedicine devices, and remote patient monitoring systems further drives the need for reliable, high-performance materials.

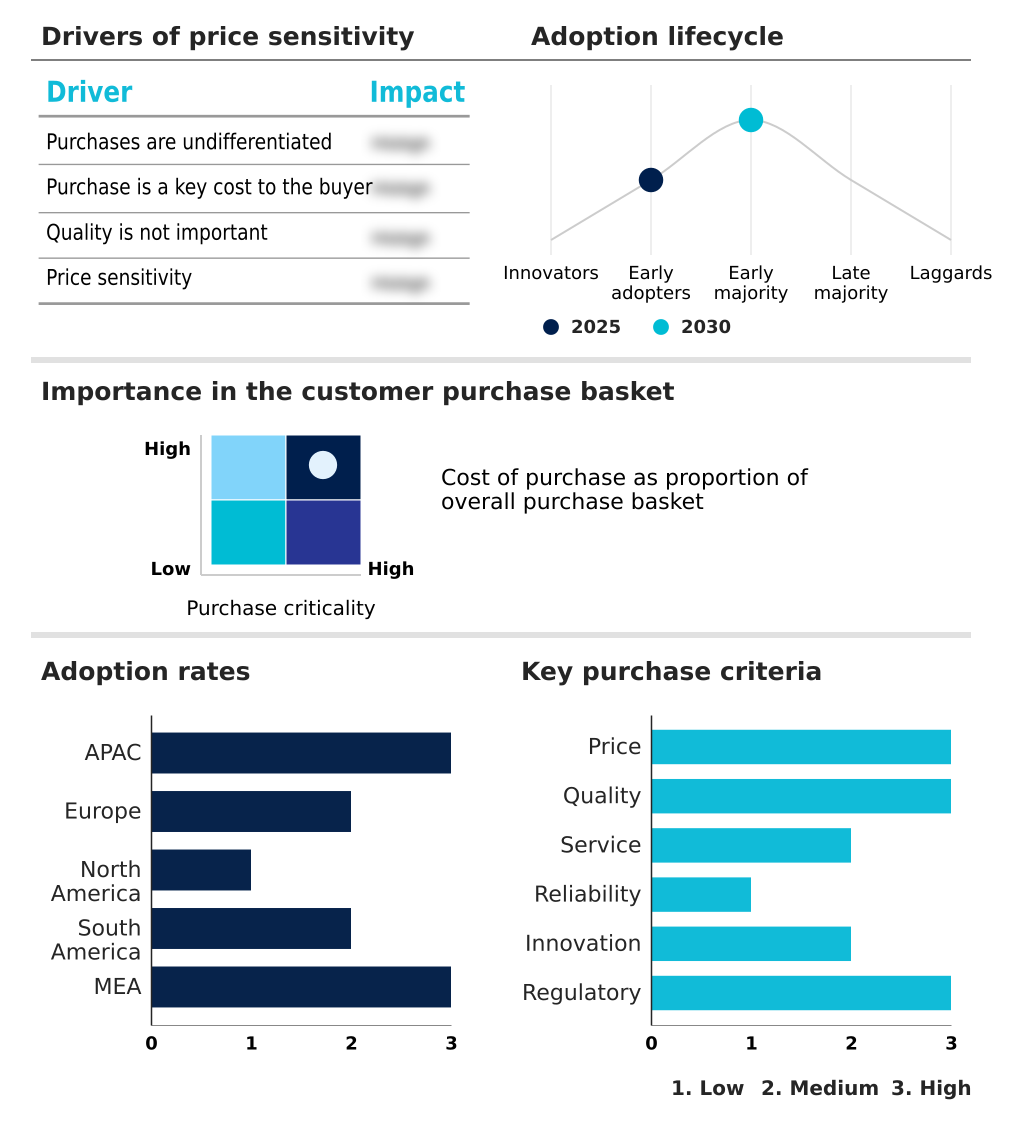
Exclusive Technavio Analysis on Customer Landscape

The synthetic quartz market forecasting report includes the adoption lifecycle of the market, covering from the innovator’s stage to the laggard’s stage. It focuses on adoption rates in different regions based on penetration. Furthermore, the synthetic quartz market report also includes key purchase criteria and drivers of price sensitivity to help companies evaluate and develop their market growth analysis strategies.

Customer Landscape of Synthetic Quartz Industry

Competitive Landscape

Companies are implementing various strategies, such as strategic alliances, synthetic quartz market forecast, partnerships, mergers and acquisitions, geographical expansion, and product/service launches, to enhance their presence in the industry.

AGC Inc. - Vendors supply synthetic quartz products, including glass and optical materials, for advanced electronics and display applications, focusing on high-purity and performance characteristics.

The industry research and growth report includes detailed analyses of the competitive landscape of the market and information about key companies, including:

  • AGC Inc.
  • CoorsTek Inc.
  • Daishinku Corp.
  • Heraeus Holding GmbH
  • Kyocera Corp.
  • Momentive Technologies Inc.
  • Murata Manufacturing Co. Ltd.
  • Nihon Dempa Kogyo Ltd.
  • Nikon Corp.
  • Pacific Quartz Inc.
  • SCR Sibelco NV
  • Seiko Epson Corp.
  • Shin Etsu Chemical Co. Ltd.
  • SIWARD Crystal Tech. Ltd.
  • Tosoh Corp.

Qualitative and quantitative analysis of companies has been conducted to help clients understand the wider business environment as well as the strengths and weaknesses of key industry players. Data is qualitatively analyzed to categorize companies as pure play, category-focused, industry-focused, and diversified; it is quantitatively analyzed to categorize companies as dominant, leading, strong, tentative, and weak.

Recent Development and News in Synthetic quartz market

  • In January 2025, Kyocera Corp. announced a strategic update to its raw material procurement to mitigate the impact of rising high-purity silica costs.
  • In January 2025, Taiwan Semiconductor Manufacturing Company announced a significant expansion of its advanced packaging and lithography facilities, increasing procurement orders for specialized synthetic quartz fixtures.
  • In March 2025, Siemens Healthineers revealed a new generation of portable MRI sensors utilizing ultra-high frequency quartz resonators to improve image resolution.
  • In May 2025, Seiko Epson Corp. launched a new series of ultra-miniature, high-stability quartz oscillators designed for next-generation satellite communication modules.

Dive into Technavio’s robust research methodology, blending expert interviews, extensive data synthesis, and validated models for unparalleled Synthetic Quartz Market insights. See full methodology.

Market Scope
Page number 299
Base year 2025
Historic period 2020-2024
Forecast period 2026-2030
Growth momentum & CAGR Accelerate at a CAGR of 5.6%
Market growth 2026-2030 USD 329548.0 thousand
Market structure Fragmented
YoY growth 2025-2026(%) 5.4%
Key countries China, Japan, India, South Korea, Australia, Indonesia, Germany, UK, France, Italy, Spain, The Netherlands, US, Canada, Mexico, Brazil, Argentina, Chile, Saudi Arabia, UAE, South Africa, Israel and Turkey
Competitive landscape Leading Companies, Market Positioning of Companies, Competitive Strategies, and Industry Risks

Request Free Sample

Research Analyst Overview

  • The synthetic quartz market is fundamentally shaped by the production of crystalline silicon dioxide via the hydrothermal synthesis process, utilizing high purity silica, nutrient materials, and seed crystals to create electronic grade crystals. This process yields essential piezoelectric materials for photolithography components and advanced wafer processing equipment.
  • Core products include frequency control devices, quartz crystal resonators, and quartz oscillators, which are crucial semiconductor manufacturing materials. The demand for optical grade quartz is rising with advancements in extreme ultraviolet lithography, requiring high stability frequency control from precise quartz timing modules and high-frequency quartz filters.
  • Production occurs in hydrothermal autoclaves, leveraging piezoelectric properties to create fused quartz tubes, photomask substrates, and lithography quartz parts from high purity fused silica. Specialized products like AT cut quartz crystals, low hydroxyl quartz, semiconductor grade quartzware, crystal blanks, and quartz crystal units made from synthetic fused silica are vital.
  • Innovations such as high-overtone crystals, surface acoustic wave devices, ultra-high frequency resonators, high-temperature resonators, and high-stability resonators are enabling next-generation applications. A key boardroom consideration is supply chain resilience, as adopting vertically integrated production of these materials has been shown to reduce sourcing disruptions by over 40%.

What are the Key Data Covered in this Synthetic Quartz Market Research and Growth Report?

  • What is the expected growth of the Synthetic Quartz Market between 2026 and 2030?

    • USD 329.55 million, at a CAGR of 5.6%

  • What segmentation does the market report cover?

    • The report is segmented by Application (Semiconductor, Solar, Lighting, Telecom and optics, and Others), End-user (Synthetic quartz crystal, Synthetic quartz glass, and Others), Material (High purity, Ultra high purity, and Others) and Geography (APAC, Europe, North America, South America, Middle East and Africa)

  • Which regions are analyzed in the report?

    • APAC, Europe, North America, South America and Middle East and Africa

  • What are the key growth drivers and market challenges?

    • Increasing demand for advanced electronic devices in healthcare industry, Volatile raw materials prices

  • Who are the major players in the Synthetic Quartz Market?

    • AGC Inc., CoorsTek Inc., Daishinku Corp., Heraeus Holding GmbH, Kyocera Corp., Momentive Technologies Inc., Murata Manufacturing Co. Ltd., Nihon Dempa Kogyo Ltd., Nikon Corp., Pacific Quartz Inc., SCR Sibelco NV, Seiko Epson Corp., Shin Etsu Chemical Co. Ltd., SIWARD Crystal Tech. Ltd. and Tosoh Corp.

Market Research Insights

  • The market is evolving with the integration of synthetic quartz into a range of advanced electronic devices and connected devices, which have seen a 20% increase in adoption rates. Growth in 4G and LTE networks continues to drive demand, while the push for eco-friendly quartz products influences manufacturing practices.
  • In automotive electronics, using high-purity quartz has improved sensor reliability by over 30%. The material is also finding new uses in construction industry applications. Despite competition from silicon oscillators and challenges from volatile raw materials, demand in medical applications is strong. In diagnostic imaging systems and for precision surgical tools, material consistency is paramount.
  • The use in wearable health monitors demonstrates the trend toward miniaturization and high performance in consumer-facing technologies.

We can help! Our analysts can customize this synthetic quartz market research report to meet your requirements.

Get in touch

1. Executive Summary

1.1 Market overview

Executive Summary - Chart on Market Overview
Executive Summary - Data Table on Market Overview
Executive Summary - Chart on Global Market Characteristics
Executive Summary - Chart on Market by Geography
Executive Summary - Chart on Market Segmentation by Application
Executive Summary - Chart on Market Segmentation by End-user
Executive Summary - Chart on Market Segmentation by Material
Executive Summary - Chart on Incremental Growth
Executive Summary - Data Table on Incremental Growth
Executive Summary - Chart on Company Market Positioning

2. Technavio Analysis

2.1 Analysis of price sensitivity, lifecycle, customer purchase basket, adoption rates, and purchase criteria

2.2 Criticality of inputs and Factors of differentiation

Chart on Overview on criticality of inputs and factors of differentiation

2.3 Factors of disruption

Chart on Overview on factors of disruption

2.4 Impact of drivers and challenges

Chart on Impact of drivers and challenges in 2025 and 2030

3. Market Landscape

3.1 Market ecosystem

Chart on Parent Market
Data Table on - Parent Market

3.2 Market characteristics

Chart on Market characteristics analysis

3.3 Value chain analysis

Chart on Value chain analysis

4. Market Sizing

4.1 Market definition

Data Table on Offerings of companies included in the market definition

4.2 Market segment analysis

Market segments

4.3 Market size 2025

4.4 Market outlook: Forecast for 2025-2030

Chart on Global - Market size and forecast 2025-2030 ($ thousand)
Data Table on Global - Market size and forecast 2025-2030 ($ thousand)
Chart on Global Market: Year-over-year growth 2025-2030 (%)
Data Table on Global Market: Year-over-year growth 2025-2030 (%)

5. Historic Market Size

5.1 Global Synthetic Quartz Market 2020 - 2024

Historic Market Size - Data Table on Global Synthetic Quartz Market 2020 - 2024 ($ thousand)

5.2 Application segment analysis 2020 - 2024

Historic Market Size - Application Segment 2020 - 2024 ($ thousand)

5.3 End-user segment analysis 2020 - 2024

Historic Market Size - End-user Segment 2020 - 2024 ($ thousand)

5.4 Material segment analysis 2020 - 2024

Historic Market Size - Material Segment 2020 - 2024 ($ thousand)

5.5 Geography segment analysis 2020 - 2024

Historic Market Size - Geography Segment 2020 - 2024 ($ thousand)

5.6 Country segment analysis 2020 - 2024

Historic Market Size - Country Segment 2020 - 2024 ($ thousand)

6. Qualitative Analysis

6.1 Impact of AI on Global Synthetic Quartz Market

6.2 Impact of Geopolitical Conflicts on Global Synthetic Quartz Market

7. Five Forces Analysis

7.1 Five forces summary

Five forces analysis - Comparison between 2025 and 2030

7.2 Bargaining power of buyers

Bargaining power of buyers - Impact of key factors 2025 and 2030

7.3 Bargaining power of suppliers

Bargaining power of suppliers - Impact of key factors in 2025 and 2030

7.4 Threat of new entrants

Threat of new entrants - Impact of key factors in 2025 and 2030

7.5 Threat of substitutes

Threat of substitutes - Impact of key factors in 2025 and 2030

7.6 Threat of rivalry

Threat of rivalry - Impact of key factors in 2025 and 2030

7.7 Market condition

Chart on Market condition - Five forces 2025 and 2030

8. Market Segmentation by Application

8.1 Market segments

Chart on Application - Market share 2025-2030 (%)
Data Table on Application - Market share 2025-2030 (%)

8.2 Comparison by Application

Chart on Comparison by Application
Data Table on Comparison by Application

8.3 Semiconductor - Market size and forecast 2025-2030

Chart on Semiconductor - Market size and forecast 2025-2030 ($ thousand)
Data Table on Semiconductor - Market size and forecast 2025-2030 ($ thousand)
Chart on Semiconductor - Year-over-year growth 2025-2030 (%)
Data Table on Semiconductor - Year-over-year growth 2025-2030 (%)

8.4 Solar - Market size and forecast 2025-2030

Chart on Solar - Market size and forecast 2025-2030 ($ thousand)
Data Table on Solar - Market size and forecast 2025-2030 ($ thousand)
Chart on Solar - Year-over-year growth 2025-2030 (%)
Data Table on Solar - Year-over-year growth 2025-2030 (%)

8.5 Lighting - Market size and forecast 2025-2030

Chart on Lighting - Market size and forecast 2025-2030 ($ thousand)
Data Table on Lighting - Market size and forecast 2025-2030 ($ thousand)
Chart on Lighting - Year-over-year growth 2025-2030 (%)
Data Table on Lighting - Year-over-year growth 2025-2030 (%)

8.6 Telecom and optics - Market size and forecast 2025-2030

Chart on Telecom and optics - Market size and forecast 2025-2030 ($ thousand)
Data Table on Telecom and optics - Market size and forecast 2025-2030 ($ thousand)
Chart on Telecom and optics - Year-over-year growth 2025-2030 (%)
Data Table on Telecom and optics - Year-over-year growth 2025-2030 (%)

8.7 Others - Market size and forecast 2025-2030

Chart on Others - Market size and forecast 2025-2030 ($ thousand)
Data Table on Others - Market size and forecast 2025-2030 ($ thousand)
Chart on Others - Year-over-year growth 2025-2030 (%)
Data Table on Others - Year-over-year growth 2025-2030 (%)

8.8 Market opportunity by Application

Market opportunity by Application ($ thousand)
Data Table on Market opportunity by Application ($ thousand)

9. Market Segmentation by End-user

9.1 Market segments

Chart on End-user - Market share 2025-2030 (%)
Data Table on End-user - Market share 2025-2030 (%)

9.2 Comparison by End-user

Chart on Comparison by End-user
Data Table on Comparison by End-user

9.3 Synthetic quartz crystal - Market size and forecast 2025-2030

Chart on Synthetic quartz crystal - Market size and forecast 2025-2030 ($ thousand)
Data Table on Synthetic quartz crystal - Market size and forecast 2025-2030 ($ thousand)
Chart on Synthetic quartz crystal - Year-over-year growth 2025-2030 (%)
Data Table on Synthetic quartz crystal - Year-over-year growth 2025-2030 (%)

9.4 Synthetic quartz glass - Market size and forecast 2025-2030

Chart on Synthetic quartz glass - Market size and forecast 2025-2030 ($ thousand)
Data Table on Synthetic quartz glass - Market size and forecast 2025-2030 ($ thousand)
Chart on Synthetic quartz glass - Year-over-year growth 2025-2030 (%)
Data Table on Synthetic quartz glass - Year-over-year growth 2025-2030 (%)

9.5 Others - Market size and forecast 2025-2030

Chart on Others - Market size and forecast 2025-2030 ($ thousand)
Data Table on Others - Market size and forecast 2025-2030 ($ thousand)
Chart on Others - Year-over-year growth 2025-2030 (%)
Data Table on Others - Year-over-year growth 2025-2030 (%)

9.6 Market opportunity by End-user

Market opportunity by End-user ($ thousand)
Data Table on Market opportunity by End-user ($ thousand)

10. Market Segmentation by Material

10.1 Market segments

Chart on Material - Market share 2025-2030 (%)
Data Table on Material - Market share 2025-2030 (%)

10.2 Comparison by Material

Chart on Comparison by Material
Data Table on Comparison by Material

10.3 High purity - Market size and forecast 2025-2030

Chart on High purity - Market size and forecast 2025-2030 ($ thousand)
Data Table on High purity - Market size and forecast 2025-2030 ($ thousand)
Chart on High purity - Year-over-year growth 2025-2030 (%)
Data Table on High purity - Year-over-year growth 2025-2030 (%)

10.4 Ultra high purity - Market size and forecast 2025-2030

Chart on Ultra high purity - Market size and forecast 2025-2030 ($ thousand)
Data Table on Ultra high purity - Market size and forecast 2025-2030 ($ thousand)
Chart on Ultra high purity - Year-over-year growth 2025-2030 (%)
Data Table on Ultra high purity - Year-over-year growth 2025-2030 (%)

10.5 Others - Market size and forecast 2025-2030

Chart on Others - Market size and forecast 2025-2030 ($ thousand)
Data Table on Others - Market size and forecast 2025-2030 ($ thousand)
Chart on Others - Year-over-year growth 2025-2030 (%)
Data Table on Others - Year-over-year growth 2025-2030 (%)

10.6 Market opportunity by Material

Market opportunity by Material ($ thousand)
Data Table on Market opportunity by Material ($ thousand)

11. Customer Landscape

11.1 Customer landscape overview

Analysis of price sensitivity, lifecycle, customer purchase basket, adoption rates, and purchase criteria

12. Geographic Landscape

12.1 Geographic segmentation

Chart on Market share by geography 2025-2030 (%)
Data Table on Market share by geography 2025-2030 (%)

12.2 Geographic comparison

Chart on Geographic comparison
Data Table on Geographic comparison

12.3 APAC - Market size and forecast 2025-2030

Chart on APAC - Market size and forecast 2025-2030 ($ thousand)
Data Table on APAC - Market size and forecast 2025-2030 ($ thousand)
Chart on APAC - Year-over-year growth 2025-2030 (%)
Data Table on APAC - Year-over-year growth 2025-2030 (%)
Chart on Regional Comparison - APAC
Data Table on Regional Comparison - APAC

12.3.1 China - Market size and forecast 2025-2030

Chart on China - Market size and forecast 2025-2030 ($ thousand)
Data Table on China - Market size and forecast 2025-2030 ($ thousand)
Chart on China - Year-over-year growth 2025-2030 (%)
Data Table on China - Year-over-year growth 2025-2030 (%)

12.3.2 Japan - Market size and forecast 2025-2030

Chart on Japan - Market size and forecast 2025-2030 ($ thousand)
Data Table on Japan - Market size and forecast 2025-2030 ($ thousand)
Chart on Japan - Year-over-year growth 2025-2030 (%)
Data Table on Japan - Year-over-year growth 2025-2030 (%)

12.3.3 India - Market size and forecast 2025-2030

Chart on India - Market size and forecast 2025-2030 ($ thousand)
Data Table on India - Market size and forecast 2025-2030 ($ thousand)
Chart on India - Year-over-year growth 2025-2030 (%)
Data Table on India - Year-over-year growth 2025-2030 (%)

12.3.4 South Korea - Market size and forecast 2025-2030

Chart on South Korea - Market size and forecast 2025-2030 ($ thousand)
Data Table on South Korea - Market size and forecast 2025-2030 ($ thousand)
Chart on South Korea - Year-over-year growth 2025-2030 (%)
Data Table on South Korea - Year-over-year growth 2025-2030 (%)

12.3.5 Australia - Market size and forecast 2025-2030

Chart on Australia - Market size and forecast 2025-2030 ($ thousand)
Data Table on Australia - Market size and forecast 2025-2030 ($ thousand)
Chart on Australia - Year-over-year growth 2025-2030 (%)
Data Table on Australia - Year-over-year growth 2025-2030 (%)

12.3.6 Indonesia - Market size and forecast 2025-2030

Chart on Indonesia - Market size and forecast 2025-2030 ($ thousand)
Data Table on Indonesia - Market size and forecast 2025-2030 ($ thousand)
Chart on Indonesia - Year-over-year growth 2025-2030 (%)
Data Table on Indonesia - Year-over-year growth 2025-2030 (%)

12.4 Europe - Market size and forecast 2025-2030

Chart on Europe - Market size and forecast 2025-2030 ($ thousand)
Data Table on Europe - Market size and forecast 2025-2030 ($ thousand)
Chart on Europe - Year-over-year growth 2025-2030 (%)
Data Table on Europe - Year-over-year growth 2025-2030 (%)
Chart on Regional Comparison - Europe
Data Table on Regional Comparison - Europe

12.4.1 Germany - Market size and forecast 2025-2030

Chart on Germany - Market size and forecast 2025-2030 ($ thousand)
Data Table on Germany - Market size and forecast 2025-2030 ($ thousand)
Chart on Germany - Year-over-year growth 2025-2030 (%)
Data Table on Germany - Year-over-year growth 2025-2030 (%)

12.4.2 UK - Market size and forecast 2025-2030

Chart on UK - Market size and forecast 2025-2030 ($ thousand)
Data Table on UK - Market size and forecast 2025-2030 ($ thousand)
Chart on UK - Year-over-year growth 2025-2030 (%)
Data Table on UK - Year-over-year growth 2025-2030 (%)

12.4.3 France - Market size and forecast 2025-2030

Chart on France - Market size and forecast 2025-2030 ($ thousand)
Data Table on France - Market size and forecast 2025-2030 ($ thousand)
Chart on France - Year-over-year growth 2025-2030 (%)
Data Table on France - Year-over-year growth 2025-2030 (%)

12.4.4 Italy - Market size and forecast 2025-2030

Chart on Italy - Market size and forecast 2025-2030 ($ thousand)
Data Table on Italy - Market size and forecast 2025-2030 ($ thousand)
Chart on Italy - Year-over-year growth 2025-2030 (%)
Data Table on Italy - Year-over-year growth 2025-2030 (%)

12.4.5 Spain - Market size and forecast 2025-2030

Chart on Spain - Market size and forecast 2025-2030 ($ thousand)
Data Table on Spain - Market size and forecast 2025-2030 ($ thousand)
Chart on Spain - Year-over-year growth 2025-2030 (%)
Data Table on Spain - Year-over-year growth 2025-2030 (%)

12.4.6 The Netherlands - Market size and forecast 2025-2030

Chart on The Netherlands - Market size and forecast 2025-2030 ($ thousand)
Data Table on The Netherlands - Market size and forecast 2025-2030 ($ thousand)
Chart on The Netherlands - Year-over-year growth 2025-2030 (%)
Data Table on The Netherlands - Year-over-year growth 2025-2030 (%)

12.5 North America - Market size and forecast 2025-2030

Chart on North America - Market size and forecast 2025-2030 ($ thousand)
Data Table on North America - Market size and forecast 2025-2030 ($ thousand)
Chart on North America - Year-over-year growth 2025-2030 (%)
Data Table on North America - Year-over-year growth 2025-2030 (%)
Chart on Regional Comparison - North America
Data Table on Regional Comparison - North America

12.5.1 US - Market size and forecast 2025-2030

Chart on US - Market size and forecast 2025-2030 ($ thousand)
Data Table on US - Market size and forecast 2025-2030 ($ thousand)
Chart on US - Year-over-year growth 2025-2030 (%)
Data Table on US - Year-over-year growth 2025-2030 (%)

12.5.2 Canada - Market size and forecast 2025-2030

Chart on Canada - Market size and forecast 2025-2030 ($ thousand)
Data Table on Canada - Market size and forecast 2025-2030 ($ thousand)
Chart on Canada - Year-over-year growth 2025-2030 (%)
Data Table on Canada - Year-over-year growth 2025-2030 (%)

12.5.3 Mexico - Market size and forecast 2025-2030

Chart on Mexico - Market size and forecast 2025-2030 ($ thousand)
Data Table on Mexico - Market size and forecast 2025-2030 ($ thousand)
Chart on Mexico - Year-over-year growth 2025-2030 (%)
Data Table on Mexico - Year-over-year growth 2025-2030 (%)

12.6 South America - Market size and forecast 2025-2030

Chart on South America - Market size and forecast 2025-2030 ($ thousand)
Data Table on South America - Market size and forecast 2025-2030 ($ thousand)
Chart on South America - Year-over-year growth 2025-2030 (%)
Data Table on South America - Year-over-year growth 2025-2030 (%)
Chart on Regional Comparison - South America
Data Table on Regional Comparison - South America

12.6.1 Brazil - Market size and forecast 2025-2030

Chart on Brazil - Market size and forecast 2025-2030 ($ thousand)
Data Table on Brazil - Market size and forecast 2025-2030 ($ thousand)
Chart on Brazil - Year-over-year growth 2025-2030 (%)
Data Table on Brazil - Year-over-year growth 2025-2030 (%)

12.6.2 Argentina - Market size and forecast 2025-2030

Chart on Argentina - Market size and forecast 2025-2030 ($ thousand)
Data Table on Argentina - Market size and forecast 2025-2030 ($ thousand)
Chart on Argentina - Year-over-year growth 2025-2030 (%)
Data Table on Argentina - Year-over-year growth 2025-2030 (%)

12.6.3 Chile - Market size and forecast 2025-2030

Chart on Chile - Market size and forecast 2025-2030 ($ thousand)
Data Table on Chile - Market size and forecast 2025-2030 ($ thousand)
Chart on Chile - Year-over-year growth 2025-2030 (%)
Data Table on Chile - Year-over-year growth 2025-2030 (%)

12.7 Middle East and Africa - Market size and forecast 2025-2030

Chart on Middle East and Africa - Market size and forecast 2025-2030 ($ thousand)
Data Table on Middle East and Africa - Market size and forecast 2025-2030 ($ thousand)
Chart on Middle East and Africa - Year-over-year growth 2025-2030 (%)
Data Table on Middle East and Africa - Year-over-year growth 2025-2030 (%)
Chart on Regional Comparison - Middle East and Africa
Data Table on Regional Comparison - Middle East and Africa

12.7.1 Saudi Arabia - Market size and forecast 2025-2030

Chart on Saudi Arabia - Market size and forecast 2025-2030 ($ thousand)
Data Table on Saudi Arabia - Market size and forecast 2025-2030 ($ thousand)
Chart on Saudi Arabia - Year-over-year growth 2025-2030 (%)
Data Table on Saudi Arabia - Year-over-year growth 2025-2030 (%)

12.7.2 UAE - Market size and forecast 2025-2030

Chart on UAE - Market size and forecast 2025-2030 ($ thousand)
Data Table on UAE - Market size and forecast 2025-2030 ($ thousand)
Chart on UAE - Year-over-year growth 2025-2030 (%)
Data Table on UAE - Year-over-year growth 2025-2030 (%)

12.7.3 South Africa - Market size and forecast 2025-2030

Chart on South Africa - Market size and forecast 2025-2030 ($ thousand)
Data Table on South Africa - Market size and forecast 2025-2030 ($ thousand)
Chart on South Africa - Year-over-year growth 2025-2030 (%)
Data Table on South Africa - Year-over-year growth 2025-2030 (%)

12.7.4 Israel - Market size and forecast 2025-2030

Chart on Israel - Market size and forecast 2025-2030 ($ thousand)
Data Table on Israel - Market size and forecast 2025-2030 ($ thousand)
Chart on Israel - Year-over-year growth 2025-2030 (%)
Data Table on Israel - Year-over-year growth 2025-2030 (%)

12.7.5 Turkey - Market size and forecast 2025-2030

Chart on Turkey - Market size and forecast 2025-2030 ($ thousand)
Data Table on Turkey - Market size and forecast 2025-2030 ($ thousand)
Chart on Turkey - Year-over-year growth 2025-2030 (%)
Data Table on Turkey - Year-over-year growth 2025-2030 (%)

12.8 Market opportunity by geography

Market opportunity by geography ($ thousand)
Data Tables on Market opportunity by geography ($ thousand)

13. Drivers, Challenges, and Opportunity

13.1 Market drivers

Increasing demand for advanced electronic devices in healthcare industry
Increasing demand for smartphones and connected devices
Growing adoption of 4G and LTE networks

13.2 Market challenges

Volatile raw materials prices
Stability and quality issues in low-cost synthetic quartz
Replacement of synthetic quartz oscillators by high-end silicon oscillators

13.3 Impact of drivers and challenges

Impact of drivers and challenges in 2025 and 2030

13.4 Market opportunities

Increasing adoption of advanced automotive electronics
Introduction of eco-friendly synthetic quartz products
Increasing use of synthetic quartz in construction industry

14. Competitive Landscape

14.1 Overview

14.2

Overview on criticality of inputs and factors of differentiation

14.3 Landscape disruption

Overview on factors of disruption

14.4 Industry risks

Impact of key risks on business

15. Competitive Analysis

15.1 Companies profiled

Companies covered

15.2 Company ranking index

15.3 Market positioning of companies

Matrix on companies position and classification

15.4 AGC Inc.

AGC Inc. - Overview
AGC Inc. - Business segments
AGC Inc. - Key news
AGC Inc. - Key offerings
AGC Inc. - Segment focus
SWOT

15.5 CoorsTek Inc.

CoorsTek Inc. - Overview
CoorsTek Inc. - Product / Service
CoorsTek Inc. - Key offerings
SWOT

15.6 Daishinku Corp.

Daishinku Corp. - Overview
Daishinku Corp. - Product / Service
Daishinku Corp. - Key offerings
SWOT

15.7 Heraeus Holding GmbH

Heraeus Holding GmbH - Overview
Heraeus Holding GmbH - Product / Service
Heraeus Holding GmbH - Key offerings
SWOT

15.8 Kyocera Corp.

Kyocera Corp. - Overview
Kyocera Corp. - Business segments
Kyocera Corp. - Key news
Kyocera Corp. - Key offerings
Kyocera Corp. - Segment focus
SWOT

15.9 Momentive Technologies Inc.

Momentive Technologies Inc. - Overview
Momentive Technologies Inc. - Product / Service
Momentive Technologies Inc. - Key offerings
SWOT

15.10 Murata Manufacturing Co. Ltd.

Murata Manufacturing Co. Ltd. - Overview
Murata Manufacturing Co. Ltd. - Business segments
Murata Manufacturing Co. Ltd. - Key offerings
Murata Manufacturing Co. Ltd. - Segment focus
SWOT

15.11 Nihon Dempa Kogyo Ltd.

Nihon Dempa Kogyo Ltd. - Overview
Nihon Dempa Kogyo Ltd. - Product / Service
Nihon Dempa Kogyo Ltd. - Key offerings
SWOT

15.12 Nikon Corp.

Nikon Corp. - Overview
Nikon Corp. - Business segments
Nikon Corp. - Key offerings
Nikon Corp. - Segment focus
SWOT

15.13 Pacific Quartz Inc.

Pacific Quartz Inc. - Overview
Pacific Quartz Inc. - Product / Service
Pacific Quartz Inc. - Key offerings
SWOT

15.14 SCR Sibelco NV

SCR Sibelco NV - Overview
SCR Sibelco NV - Product / Service
SCR Sibelco NV - Key offerings
SWOT

15.15 Seiko Epson Corp.

Seiko Epson Corp. - Overview
Seiko Epson Corp. - Business segments
Seiko Epson Corp. - Key offerings
Seiko Epson Corp. - Segment focus
SWOT

15.16 Shin Etsu Chemical Co. Ltd.

Shin Etsu Chemical Co. Ltd. - Overview
Shin Etsu Chemical Co. Ltd. - Business segments
Shin Etsu Chemical Co. Ltd. - Key offerings
Shin Etsu Chemical Co. Ltd. - Segment focus
SWOT

15.17 SIWARD Crystal Tech. Ltd.

SIWARD Crystal Tech. Ltd. - Overview
SIWARD Crystal Tech. Ltd. - Product / Service
SIWARD Crystal Tech. Ltd. - Key offerings
SWOT

15.18 Tosoh Corp.

Tosoh Corp. - Overview
Tosoh Corp. - Business segments
Tosoh Corp. - Key offerings
Tosoh Corp. - Segment focus
SWOT

16. Appendix

16.1 Scope of the report

Market definition
Objectives
Notes and caveats

16.2 Inclusions and exclusions checklist

Inclusions checklist
Exclusions checklist

16.3 Currency conversion rates for US$

16.4 Research methodology

16.5 Data procurement

Information sources

16.6 Data validation

16.7 Validation techniques employed for market sizing

16.8 Data synthesis

16.9 360 degree market analysis

16.10 List of abbreviations

Research Methodology

Technavio presents a detailed picture of the market by way of study, synthesis, and summation of data from multiple sources. The analysts have presented the various facets of the market with a particular focus on identifying the key industry influencers. The data thus presented is comprehensive, reliable, and the result of extensive research, both primary and secondary.

INFORMATION SOURCES

Primary sources

  • Manufacturers and suppliers
  • Channel partners
  • Industry experts
  • Strategic decision makers

Secondary sources

  • Industry journals and periodicals
  • Government data
  • Financial reports of key industry players
  • Historical data
  • Press releases

DATA ANALYSIS

Data Synthesis

  • Collation of data
  • Estimation of key figures
  • Analysis of derived insights

Data Validation

  • Triangulation with data models
  • Reference against proprietary databases
  • Corroboration with industry experts

REPORT WRITING

Qualitative

  • Market drivers
  • Market challenges
  • Market trends
  • Five forces analysis

Quantitative

  • Market size and forecast
  • Market segmentation
  • Geographical insights
  • Competitive landscape

Interested in this report?

Get your sample now to see our research methodology and insights!

Download Now

Frequently Asked Questions

Synthetic Quartz market growth will increase by USD 329548.0 thousand thousand during 2026-2030.

The Synthetic Quartz market is expected to grow at a CAGR of 5.6% during 2026-2030.

Synthetic Quartz market is segmented by Application (Semiconductor, Solar, Lighting, Telecom and optics, Others) End-user (Synthetic quartz crystal, Synthetic quartz glass, Others) Material (High purity, Ultra high purity, Others)

AGC Inc., CoorsTek Inc., Daishinku Corp., Heraeus Holding GmbH, Kyocera Corp., Momentive Technologies Inc., Murata Manufacturing Co. Ltd., Nihon Dempa Kogyo Ltd., Nikon Corp., Pacific Quartz Inc., SCR Sibelco NV, Seiko Epson Corp., Shin Etsu Chemical Co. Ltd., SIWARD Crystal Tech. Ltd., Tosoh Corp. are a few of the key vendors in the Synthetic Quartz market.

APAC will register the highest growth rate of 45.3% among the other regions. Therefore, the Synthetic Quartz market in APAC is expected to garner significant business opportunities for the vendors during the forecast period.

China, Japan, India, South Korea, Australia, Indonesia, Germany, UK, France, Italy, Spain, The Netherlands, US, Canada, Mexico, Brazil, Argentina, Chile, Saudi Arabia, UAE, South Africa, Israel, Turkey

  • Increasing demand for advanced electronic devices in healthcare industry is the driving factor this market.

The Synthetic Quartz market vendors should focus on grabbing business opportunities from the Application segment as it accounted for the largest market share in the base year.
RIA - Research AI Assistant
Ask RIA