
Tail Spend Management Solutions Market Size 2026-2030
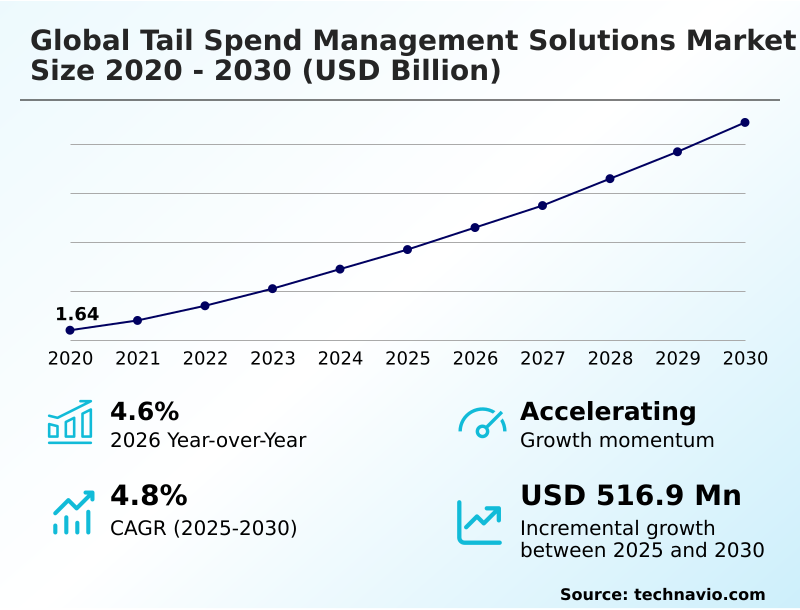
The tail spend management solutions market size is valued to increase by USD 516.9 million, at a CAGR of 4.8% from 2025 to 2030. Rapid integration of generative AI and autonomous sourcing solutions will drive the tail spend management solutions market.
Major Market Trends & Insights
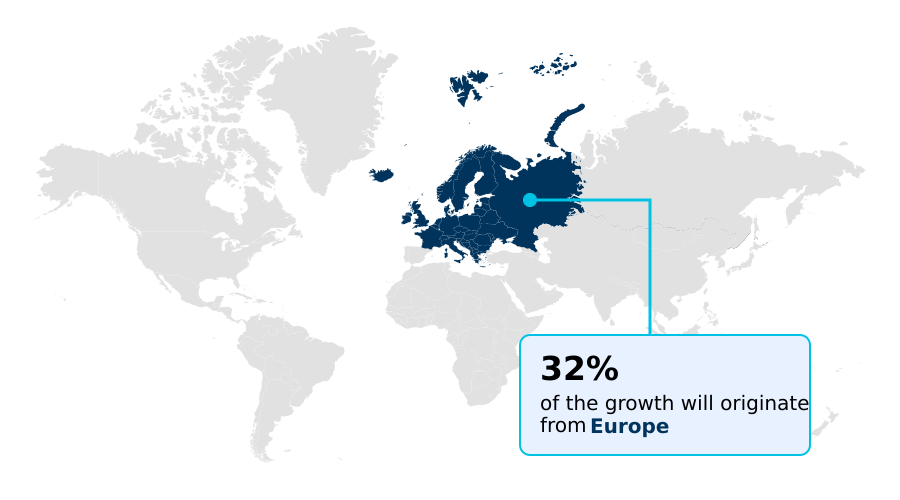
- Europe dominated the market and accounted for a 32.2% growth during the forecast period.
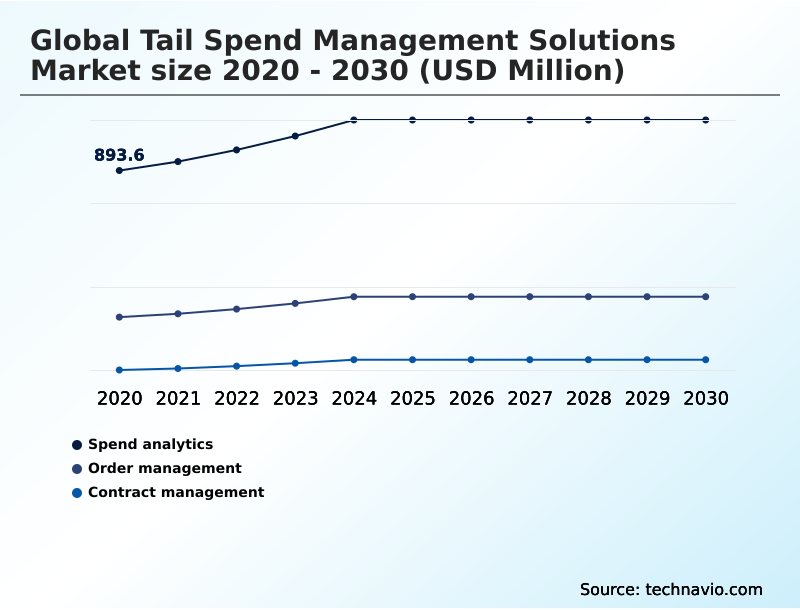
- By Product - Spend analytics segment was valued at USD 1.05 billion in 2024
- By End-user - BFSI segment accounted for the largest market revenue share in 2024
Market Size & Forecast
- Market Opportunities: USD 844.9 million
- Market Future Opportunities: USD 516.9 million
- CAGR from 2025 to 2030 : 4.8%
Market Summary
- The tail spend management solutions market is defined by the strategic imperative to control low-value, high-volume procurement transactions that fall outside managed sourcing categories. These solutions enable organizations to consolidate fragmented purchasing data, enhance spend visibility, and automate supplier compliance, thereby reducing maverick spending.
- Key market drivers include the push for operational efficiency and the need to mitigate risks associated with unvetted suppliers. A primary trend is the adoption of AI and machine learning for predictive analytics and autonomous sourcing, which transforms procurement from a reactive to a proactive function.
- For instance, a multinational manufacturing firm can use a tail spend platform to analyze thousands of MRO (maintenance, repair, and operations) purchases, automatically identifying opportunities to consolidate suppliers and negotiate better rates.
- This not only unlocks significant savings, often between 5% and 15% on managed spend, but also frees up procurement teams to focus on high-value strategic initiatives, reinforcing contract adherence and improving overall financial governance.
What will be the Size of the Tail Spend Management Solutions Market during the forecast period?
Get Key Insights on Market Forecast (PDF) Get Free Sample
How is the Tail Spend Management Solutions Market Segmented?
The tail spend management solutions industry research report provides comprehensive data (region-wise segment analysis), with forecasts and estimates in "USD million" for the period 2026-2030, as well as historical data from 2020-2024 for the following segments.
- Product
- Spend analytics
- Order management
- Contract management
- End-user
- BFSI
- Transportation and logistics
- Healthcare
- Retail
- Others
- Solution
- Software platforms
- Managed services
- Consulting services
- Geography
- North America
- US
- Canada
- Mexico
- Europe
- Germany
- UK
- France
- APAC
- China
- India
- Japan
- South America
- Brazil
- Argentina
- Middle East and Africa
- UAE
- Saudi Arabia
- South Africa
- Rest of World (ROW)
- North America
By Product Insights
The spend analytics segment is estimated to witness significant growth during the forecast period.
Spend analytics is the foundational element for identifying and optimizing low-value transactions, which often constitute 80 percent of procurement volume.
Modern solutions leverage a spend classification algorithm and procurement data normalization to transform fragmented data from disparate sources into actionable intelligence.
By providing a granular spend visibility dashboard, these tools enable procurement leaders to identify supplier consolidation strategy opportunities, detect maverick spend control issues, and enforce compliance with preferred company policies.
The focus of indirect spend management software is shifting from historical reporting to predictive spend analytics, using ai in procurement workflows to offer prescriptive recommendations.
This proactive approach, supported by accounts payable automation, helps prevent spend leakage before it occurs, ensuring that tail spend data analysis techniques contribute directly to cost savings.
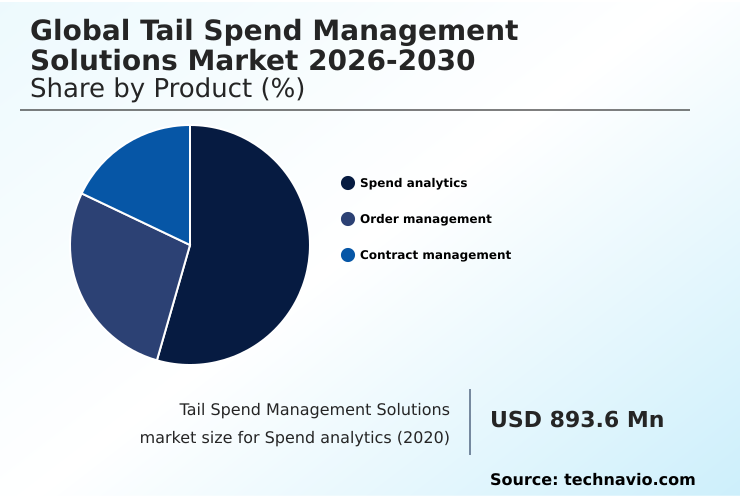
The Spend analytics segment was valued at USD 1.05 billion in 2024 and showed a gradual increase during the forecast period.
Regional Analysis
Europe is estimated to contribute 32.2% to the growth of the global market during the forecast period.Technavio’s analysts have elaborately explained the regional trends and drivers that shape the market during the forecast period.
See How Tail Spend Management Solutions Market Demand is Rising in Europe Get Free Sample
The geographic landscape of the global tail spend management solutions market 2026-2030 is characterized by distinct regional dynamics. North America leads in market maturity, driven by early and aggressive adoption of digital procurement ecosystems.
Europe is poised for the largest incremental growth, accounting for 32.25% of the market's expansion, as enterprises increasingly prioritize cost optimization and regulatory compliance.
Meanwhile, the APAC region is projected to exhibit the highest growth rate, with a CAGR of 5.4%, fueled by rapid digital procurement transformation and the expansion of mid-sized enterprises.
The adoption of procurement analytics platforms and the implementation of a procure-to-pay lifecycle optimization are key factors in this growth. A robust procurement risk management framework and a source-to-contract lifecycle are essential for managing this expansion.
South America and the Middle East and Africa represent smaller but steadily growing markets, focusing on leveraging these solutions to enhance operational efficiency in sectors like energy and infrastructure.
Market Dynamics
Our researchers analyzed the data with 2025 as the base year, along with the key drivers, trends, and challenges. A holistic analysis of drivers will help companies refine their marketing strategies to gain a competitive advantage.
- Achieving strategic value from non-core expenditures requires a dedicated focus on improving tail spend compliance metrics and streamlining procure-to-pay for tail spend. Organizations are increasingly looking beyond basic automation and adopting sophisticated tail spend supplier consolidation strategies to rationalize their supplier base and enhance negotiating power.
- The practice of reducing maverick spend with software is a critical first step, but the real transformation comes from using AI for indirect procurement optimization. This enables procurement teams to move from reactive problem-solving to proactive, data-driven decision-making. By leveraging tail spend analytics for cost savings, businesses can unlock value previously hidden in transactional data.
- For example, implementing best practices for tail spend governance through automated platforms can reduce manual processing effort by over 60% compared to traditional methods. Automating low-value purchase orders not only accelerates the procurement cycle but also ensures that every transaction is compliant and strategically aligned, turning a long-neglected area of spend into a source of competitive advantage.
What are the key market drivers leading to the rise in the adoption of Tail Spend Management Solutions Industry?
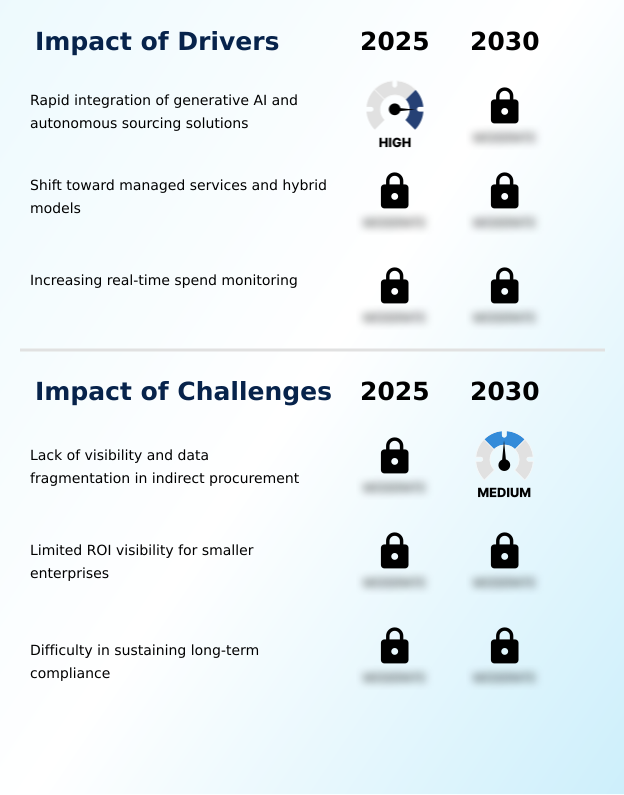
- The rapid integration of generative AI and autonomous sourcing solutions is a key driver accelerating market growth.
- A primary driver for the market is the shift toward autonomous sourcing, particularly as enterprises automate high-volume, low-value transactions.
- The integration of generative AI within existing source-to-pay process automation ecosystems allows organizations to automate workflows, with some achieving performance gains exceeding 25% in their tail spend operations.
- This demand for intelligent tools is evidenced by the move toward agentic workflows that can predict market shifts and suggest optimal company selections in real-time.
- By leveraging a spend management software solution and managed procurement services, organizations can redirect focus toward strategic categories.
- As companies prioritize digital transformation to combat inflationary pressures, the adoption of these automated platforms has become a cornerstone of modern spend management, enabling a level of control that was previously unattainable for non-strategic spend through improved purchase requisition workflow and e-procurement system integration.
What are the market trends shaping the Tail Spend Management Solutions Industry?
- The integration of advanced analytics and autonomous spend classification is emerging as a significant market trend. This development is reshaping how organizations identify and manage procurement expenditures.
- Key trends in the market are centered on the integration of advanced analytics, including machine learning-driven spend classification and predictive supplier consolidation algorithms. Previously reliant on manual reconciliation, procurement teams can now leverage dynamic categorization of unstructured data from a procurement automation platform, improving spend visibility by over 40% in some cases.
- The use of a spend data aggregation service and strategic sourcing automation tools allows for more effective tail spend optimization analytics. This shift enables North American manufacturing and healthcare organizations to reduce supplier redundancy and identify purchasing overlaps, while European enterprises align tail spend optimization with sustainability metrics.
- This maturation of data science tools not only reduces administrative burdens but also transforms tail spend into a source of measurable strategic value, supported by a comprehensive supplier relationship management framework and tail spend management software.
What challenges does the Tail Spend Management Solutions Industry face during its growth?
- The lack of visibility and significant data fragmentation within indirect procurement processes presents a key challenge to industry growth.
- A significant challenge facing the market is the decentralized and inconsistent data that prevents comprehensive oversight and c-suite procurement visibility. Many enterprises struggle with fragmented data scattered across disparate systems, which fosters maverick spending and erodes cost optimization efforts by up to 15%.
- This lack of a unified view from an e-invoicing solutions integration or a cohesive procurement process optimization model constrains strategic initiatives. The absence of a unified data architecture, often due to poor enterprise resource planning integration, limits supplier performance management and consolidation opportunities. Without centralized oversight through cloud-based procurement solutions, hidden costs accumulate through unmanaged relationships and off-contract purchases.
- Addressing this data fragmentation through a non-strategic spend control policy and automated requisitioning system is therefore critical to unlocking savings and enhancing operational efficiency across global supply chain financial operations.
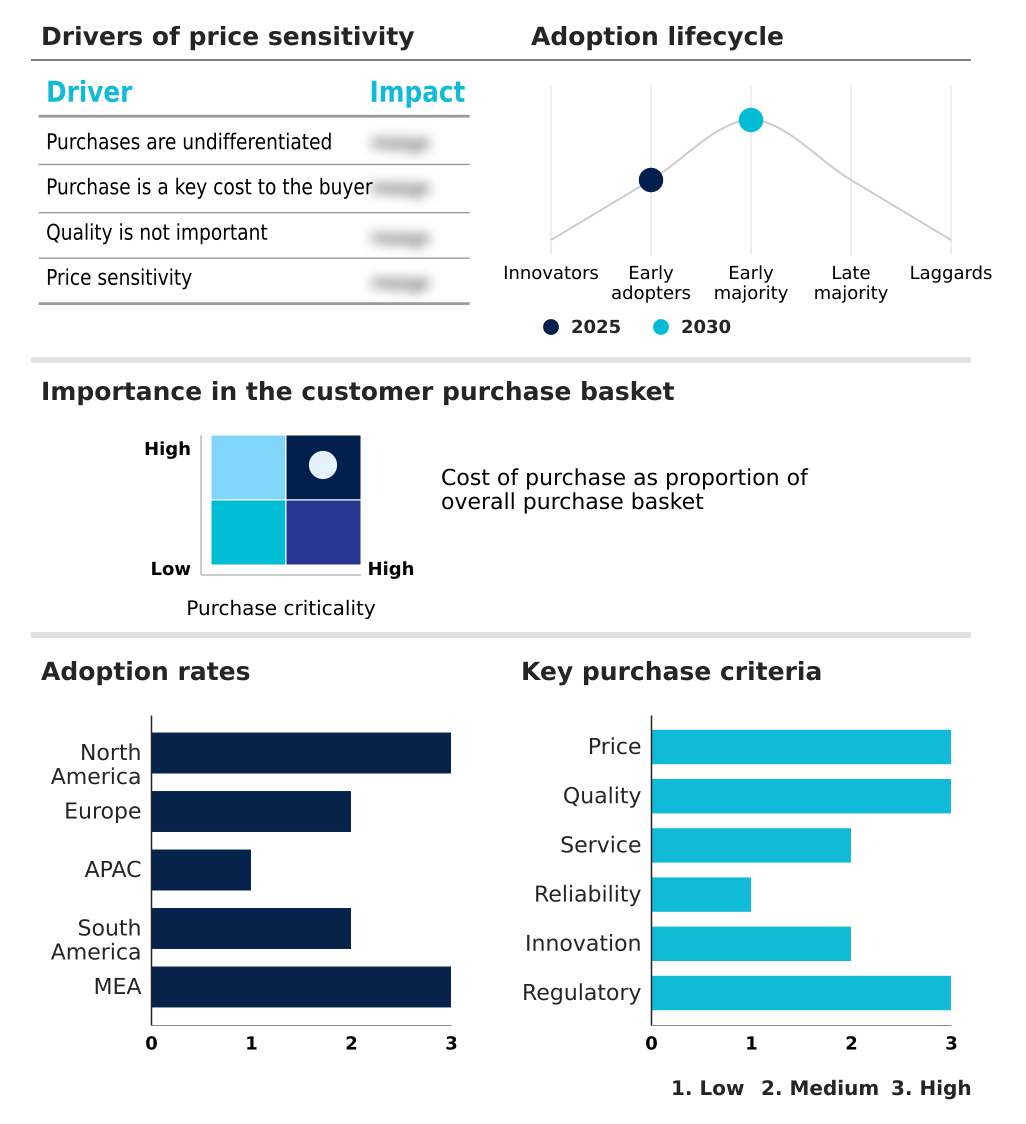
Exclusive Technavio Analysis on Customer Landscape
The tail spend management solutions market forecasting report includes the adoption lifecycle of the market, covering from the innovator’s stage to the laggard’s stage. It focuses on adoption rates in different regions based on penetration. Furthermore, the tail spend management solutions market report also includes key purchase criteria and drivers of price sensitivity to help companies evaluate and develop their market growth analysis strategies.
Customer Landscape of Tail Spend Management Solutions Industry
Competitive Landscape
Companies are implementing various strategies, such as strategic alliances, tail spend management solutions market forecast, partnerships, mergers and acquisitions, geographical expansion, and product/service launches, to enhance their presence in the industry.
Accenture Plc - Delivers unified procurement services through a proprietary smart platform, combining spend analytics, sourcing, and contract management for comprehensive spend optimization.
The industry research and growth report includes detailed analyses of the competitive landscape of the market and information about key companies, including:
- Accenture Plc
- Amazon.com Inc.
- Basware Corp.
- Capgemini SE
- Corcentric Inc.
- Coupa Software Inc.
- Fairmarkit Inc.
- Genpact Ltd.
- GEP
- IBM Corp.
- Infosys Ltd.
- Ivalua Inc.
- Jaggaer LLC
- Oracle Corp.
- SAP SE
- Simfoni Ltd.
- TradeShift Inc.
- Unit4 Group Holding BV
- WNS Holdings Ltd.
- Xeeva Inc.
Qualitative and quantitative analysis of companies has been conducted to help clients understand the wider business environment as well as the strengths and weaknesses of key industry players. Data is qualitatively analyzed to categorize companies as pure play, category-focused, industry-focused, and diversified; it is quantitatively analyzed to categorize companies as dominant, leading, strong, tentative, and weak.
Recent Development and News in Tail spend management solutions market
- In August 2025, Workday incorporated generative artificial intelligence into its spend analysis tool to provide real-time data insights and predictive recommendations for cost reduction.
- In February 2025, Fairmarkit announced its certification as Coupa Total Spend Management Platform Ready, a development signifying the industry-wide push to embed generative artificial intelligence within existing spend ecosystems.
- In February 2025, Jaggaer introduced a blockchain-enabled module for smart contracts to automate the verification and payment processes for small companies, reducing time for contract reconciliation.
- In December 2024, Ivalua launched a new collaboration platform featuring predictive analytics specifically designed for spend optimization and risk mitigation, providing a unified interface for real-time supplier monitoring.
Dive into Technavio’s robust research methodology, blending expert interviews, extensive data synthesis, and validated models for unparalleled Tail Spend Management Solutions Market insights. See full methodology.
| Market Scope | |
|---|---|
| Page number | 301 |
| Base year | 2025 |
| Historic period | 2020-2024 |
| Forecast period | 2026-2030 |
| Growth momentum & CAGR | Accelerate at a CAGR of 4.8% |
| Market growth 2026-2030 | USD 516.9 million |
| Market structure | Fragmented |
| YoY growth 2025-2026(%) | 4.6% |
| Key countries | US, Canada, Mexico, Germany, UK, France, Italy, Spain, The Netherlands, China, India, Japan, Australia, South Korea, Indonesia, Brazil, Argentina, Chile, UAE, Saudi Arabia, South Africa, Egypt and Israel |
| Competitive landscape | Leading Companies, Market Positioning of Companies, Competitive Strategies, and Industry Risks |
Research Analyst Overview
- The global tail spend management solutions market 2026-2030 is evolving from a tactical tool for cost containment into a strategic enabler of enterprise-wide efficiency and compliance. The core of this transformation lies in the application of a spend data enrichment service and robotic process automation in procurement.
- Solutions now offer more than just a spend visibility dashboard; they provide autonomous sourcing technology and an ai-driven procurement agent capable of executing complex tasks. This shift is compelling boardroom-level discussions to move beyond simple budget adherence toward strategic resource allocation, leveraging predictive spend analytics to forecast needs and optimize capital.
- The implementation of a catalog management system alongside guided buying implementation is standardizing purchases and enforcing contract compliance monitoring. For instance, organizations successfully deploying these platforms report up to a 30% reduction in requisition-to-order automation cycle times.
- This level of performance elevates indirect procurement governance from a cost center to a value driver, underpinned by technologies like three-way invoice matching and automated purchase order processing.
What are the Key Data Covered in this Tail Spend Management Solutions Market Research and Growth Report?
-
What is the expected growth of the Tail Spend Management Solutions Market between 2026 and 2030?
-
USD 516.9 million, at a CAGR of 4.8%
-
-
What segmentation does the market report cover?
-
The report is segmented by Product (Spend analytics, Order management, and Contract management), End-user (BFSI, Transportation and logistics, Healthcare, Retail, and Others), Solution (Software platforms, Managed services, and Consulting services) and Geography (North America, Europe, APAC, South America, Middle East and Africa)
-
-
Which regions are analyzed in the report?
-
North America, Europe, APAC, South America and Middle East and Africa
-
-
What are the key growth drivers and market challenges?
-
Rapid integration of generative AI and autonomous sourcing solutions, Lack of visibility and data fragmentation in indirect procurement
-
-
Who are the major players in the Tail Spend Management Solutions Market?
-
Accenture Plc, Amazon.com Inc., Basware Corp., Capgemini SE, Corcentric Inc., Coupa Software Inc., Fairmarkit Inc., Genpact Ltd., GEP, IBM Corp., Infosys Ltd., Ivalua Inc., Jaggaer LLC, Oracle Corp., SAP SE, Simfoni Ltd., TradeShift Inc., Unit4 Group Holding BV, WNS Holdings Ltd. and Xeeva Inc.
-
Market Research Insights
- The market dynamics for tail spend management solutions are heavily influenced by the strong negotiating leverage of buyers, as large enterprises drive demand for measurable ROI and competitive pricing. Product differentiation is relatively moderate, compelling providers to compete on service quality, customization, and the depth of their analytical capabilities.
- This buyer-centric environment contrasts sharply with the low bargaining power of technology and service suppliers, which ensures cost-effective access to cloud infrastructure and development tools for solution providers. Consequently, companies are prioritizing the integration of advanced features like AI and predictive analytics to create distinct value.
- Organizations adopting these platforms report significant efficiency gains, with some achieving over a 20% reduction in procurement processing times and a notable improvement in contract compliance, underscoring the shift toward value-based outcomes over basic transactional management.
We can help! Our analysts can customize this tail spend management solutions market research report to meet your requirements.
 RIA -
RIA - 
