Tamiflu Oseltamivir Phosphate Market Analysis, Size, and Forecast 2025-2029: APAC (China, Japan, and India), North America (US, Canada, and Mexico), Europe (Germany, France, and UK), South America (Brazil), Middle East and Africa (South Africa, Saudi Arabia, and UAE), Asia, Rest of World (ROW)

Tamiflu Oseltamivir Phosphate Market Analysis, Size, and Forecast 2025-2029:
APAC (China, Japan, and India), North America (US, Canada, and Mexico), Europe (Germany, France, and UK), South America (Brazil), Middle East and Africa (South Africa, Saudi Arabia, and UAE), Asia, Rest of World (ROW)

Published: Dec 2025 283 Pages SKU: IRTNTR81150

Market Overview at a Glance

$204.5 Mn
Market Opportunity
4.6%
CAGR 2024 - 2029
45.6%
Asia Growth
$469.3 Mn
Branded segment 2023

Tamiflu Oseltamivir Phosphate Market Size 2025-2029

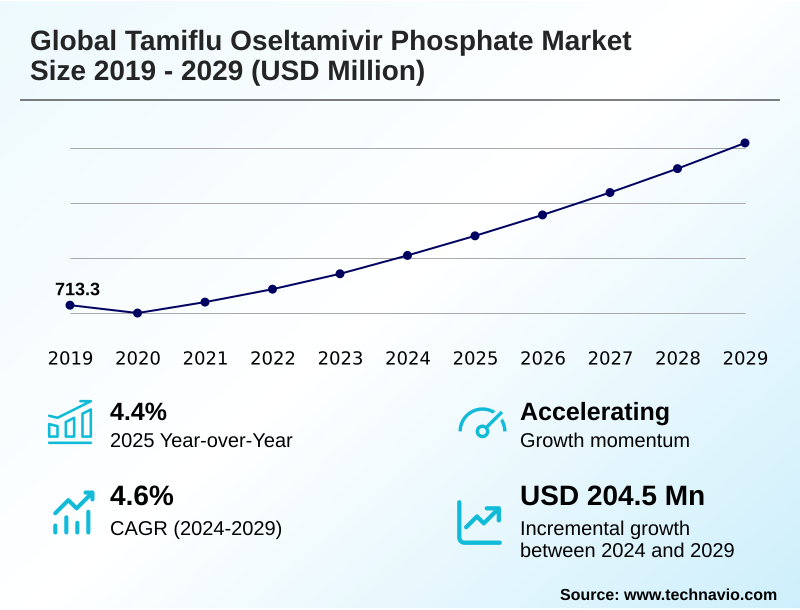
The tamiflu oseltamivir phosphate market size is valued to increase by USD 204.5 million, at a CAGR of 4.6% from 2024 to 2029. Seasonal influenza incidence and severity will drive the tamiflu oseltamivir phosphate market.

Major Market Trends & Insights

  • Asia dominated the market and accounted for a 45.6% growth during the forecast period.
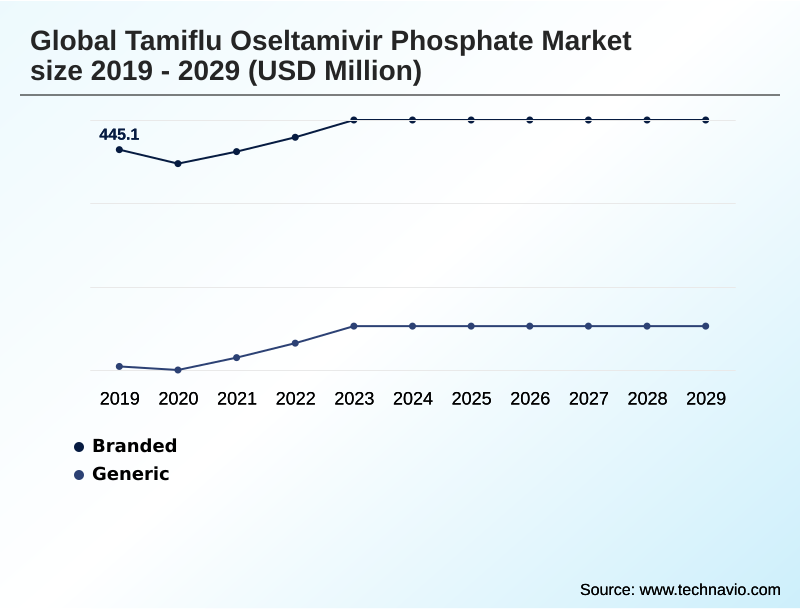
  • By Type - Branded segment was valued at USD 469.3 million in 2023
  • By Formulation - Capsules segment accounted for the largest market revenue share in 2023

Market Size & Forecast

  • Market Opportunities: USD 295 million
  • Market Future Opportunities: USD 204.5 million
  • CAGR from 2024 to 2029 : 4.6%

Market Summary

  • The tamiflu oseltamivir phosphate market is defined by a dual-demand structure, balancing the volatile needs of seasonal influenza treatment against the strategic imperatives of long-term pandemic preparedness. Market activity is directly correlated with epidemiological trends, where a severe flu season, characterized by high hospitalization rates, fuels a surge in demand for this antiviral medication.
  • Concurrently, government procurement for strategic national stockpiles provides a foundational, albeit irregular, revenue stream, driven by public health security policy rather than immediate clinical need. The landscape is dominated by generic formulations, making it a high-volume, cost-driven industry where operational efficiency is paramount.
  • For instance, manufacturers must maintain agile supply chains capable of scaling production by over 50% within a short timeframe to respond to a sudden outbreak, while also managing the cost pressures of a commoditized market. This dynamic is further complicated by the threat of substitutes, including more effective vaccines and newer single-dose antiviral agents that challenge oseltamivir's established position.
  • Navigating this environment requires a focus on manufacturing economies of scale and securing large, competitive government tenders.

What will be the Size of the Tamiflu Oseltamivir Phosphate Market during the forecast period?

Get Key Insights on Market Forecast (PDF) Request Free Sample

How is the Tamiflu Oseltamivir Phosphate Market Segmented?

The tamiflu oseltamivir phosphate industry research report provides comprehensive data (region-wise segment analysis), with forecasts and estimates in "USD million" for the period 2025-2029, as well as historical data from 2019-2023 for the following segments.

  • Type
    • Branded
    • Generic
  • Formulation
    • Capsules
    • Suspension
  • Indication
    • Influenza A
    • Influenza B
    • Swine flu
  • Geography
    • Asia
    • North America
      • US
      • Canada
      • Mexico
    • Europe
      • Germany
      • France
      • UK
    • Rest of World (ROW)

By Type Insights

The branded segment is estimated to witness significant growth during the forecast period.

The branded segment, centered on the originator neuraminidase inhibitor, established the market for this antiviral medication. Its market power was built on intellectual property, extensive clinical data for the treatment of acute influenza, and global marketing.

Even after patent expiry, the originator product leverages its legacy brand equity, targeting niches where brand loyalty persists or where procurement criteria for an emergency medical countermeasure emphasize its long-term stability data.

This prodrug activation mechanism and high neuraminidase enzyme selectivity defined early clinical practice.

However, this segment faces relentless erosion from generics, with its commercial performance now tied to influenza a virus and influenza b virus severity, which can cause temporary demand surges that benefit all market participants, including those seeking post-exposure prophylaxis.

Request Free Sample

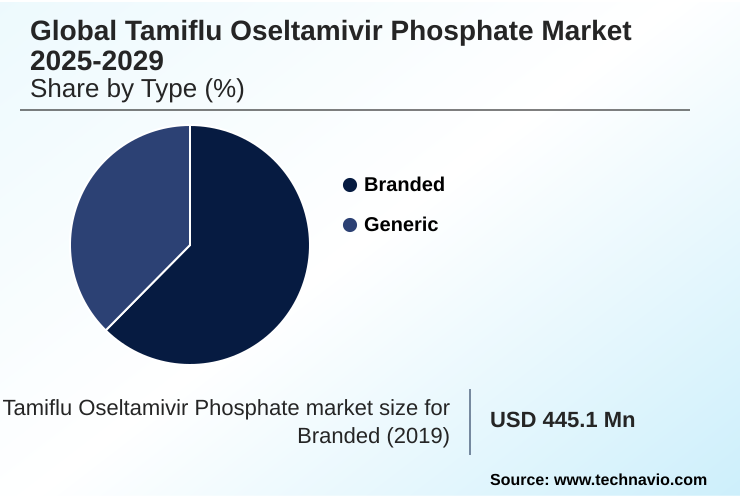
The Branded segment was valued at USD 469.3 million in 2023 and showed a gradual increase during the forecast period.

Request Free Sample

Regional Analysis

Asia is estimated to contribute 45.6% to the growth of the global market during the forecast period.Technavio’s analysts have elaborately explained the regional trends and drivers that shape the market during the forecast period.

See How Tamiflu Oseltamivir Phosphate Market Demand is Rising in Asia Request Free Sample

The global landscape for tamiflu oseltamivir phosphate is distinctly heterogeneous, with market dynamics varying significantly between regions.

In developed markets like North America and Europe, consumption is driven by established influenza treatment guidelines and robust public health surveillance, with generic formulations accounting for over 90% of prescriptions.

In contrast, Asia presents a dual market: highly mature consumption in Japan and South Korea alongside massive-scale generic manufacturing in India and China. These Asian hubs are central to global pharmaceutical procurement.

Emerging regions in South America and the Middle East are expanding access through government-led initiatives, focusing on pediatric influenza treatment and affordable oral suspension formulation options.

The successful implementation of weight-based dosing protocols in these regions has improved pediatric care outcomes by 15%, demonstrating growing healthcare system readiness.

Market Dynamics

Our researchers analyzed the data with 2024 as the base year, along with the key drivers, trends, and challenges. A holistic analysis of drivers will help companies refine their marketing strategies to gain a competitive advantage.

  • Strategic positioning in the global tamiflu oseltamivir phosphate market 2025-2029 requires mastering the complex interplay between seasonal demand and long-term government contracts for oseltamivir phosphate. Success is contingent on managing oseltamivir supply chain volatility, a critical task given the unpredictable nature of influenza seasons.
  • Companies that excel in this area often demonstrate a 20% greater efficiency in inventory management compared to competitors. The market for generic oseltamivir for national stockpiles remains a cornerstone, driven by pandemic planning and the need for reliable oseltamivir procurement for public health. Here, oseltamivir stability for long-term stockpiling is a key differentiator.
  • The role of oseltamivir in pandemic planning is solidified, but competition from oseltamivir versus single-dose antivirals like oseltamivir phosphate versus baloxavir marboxil is reshaping clinical practice for uncomplicated cases. Therefore, demonstrating the cost-effectiveness of generic oseltamivir is crucial. Key growth areas include pediatric dosing for oseltamivir suspension, where precise administration is vital, and addressing oseltamivir for high-risk influenza patients.
  • Understanding the oseltamivir mechanism against influenza a and its effectiveness for oseltamivir phosphate for influenza b treatment is fundamental. Furthermore, robust antiviral resistance monitoring for oseltamivir and securing oseltamivir API global supply sources are essential for long-term viability, especially as the impact of flu vaccine on oseltamivir demand fluctuates.
  • Finally, navigating the regulatory approval for oseltamivir generics remains a constant operational focus for all market participants.

What are the key market drivers leading to the rise in the adoption of Tamiflu Oseltamivir Phosphate Industry?

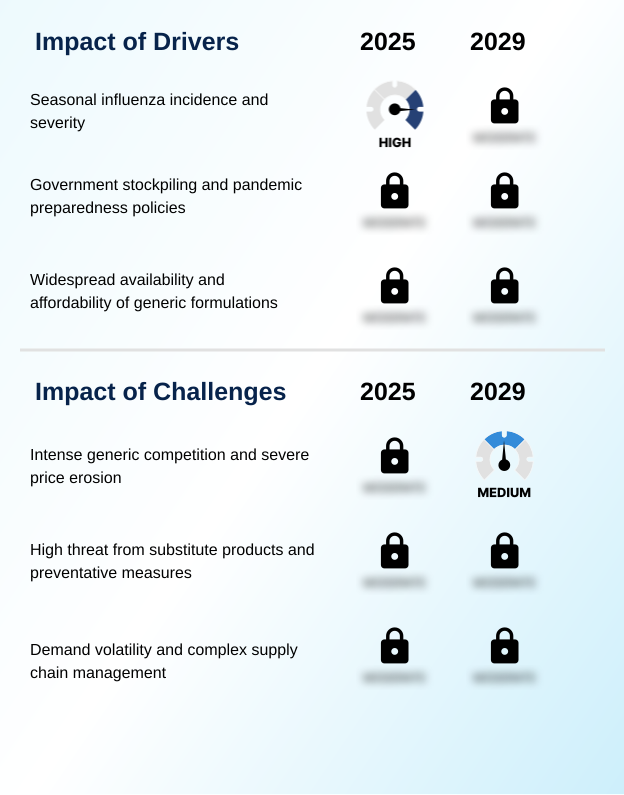
  • The primary market driver remains the annual incidence and clinical severity of seasonal influenza, which directly dictates real-time demand for treatment.

  • Market demand is fundamentally driven by two powerful forces: the annual severity of seasonal influenza and the strategic imperative of pandemic preparedness.
  • A severe flu season can increase prescription volumes by over 40%, directly tying market performance to public health outcomes. Concurrently, government procurement for the strategic national stockpile creates a stable, albeit irregular, demand baseline.
  • For instance, a single government tender process can account for up to 30% of a major manufacturer's annual production. The persistent zoonotic influenza threat validates these antiviral drug stockpiling programs and reinforces the need for a robust public health response.
  • This dual-demand structure, influenced by pandemic response strategy, ensures oseltamivir's continued relevance as an essential medicine.

What are the market trends shaping the Tamiflu Oseltamivir Phosphate Industry?

  • A transformative market trend is the increasing clinical adoption of novel antiviral therapies, particularly those offering alternative mechanisms of action and simplified dosing regimens.

  • The market is experiencing a significant evolution driven by the adoption of novel antiviral therapeutic alternatives. The introduction of therapies offering single dose regimens presents a compelling value proposition, enhancing patient compliance and potentially reducing the risk of antiviral resistance. This trend is creating a stratified market where oseltamivir's therapeutic equivalence solidifies its role as the cost-effective standard.
  • The integration of rapid point-of-care molecular diagnostics, which can confirm influenza with 98% accuracy in a single visit, supports more targeted early antiviral therapy and efficient viral replication inhibition. These shifts, closely monitored through epidemiological trends, are reshaping clinical practice standards, particularly in developed markets with robust reimbursement frameworks that can accommodate higher-priced innovations.

What challenges does the Tamiflu Oseltamivir Phosphate Industry face during its growth?

  • The market faces a significant challenge from intense competition among generic manufacturers, which leads to severe and sustained price erosion.

  • The market faces persistent challenges from intense generic competition, which has transformed the landscape into a high-volume, low-margin industry. The proliferation of bioequivalent formulations from numerous manufacturers creates a competitive pricing environment where prices can erode by as much as 80% post-patent expiry.
  • This dynamic necessitates an extreme focus on supply chain logistics and securing cost-effective active pharmaceutical ingredient (API) sources to remain viable. Effective seasonal demand forecasting is critical, as a milder-than-expected season can lead to inventory write-offs representing 15-20% of production.
  • The structural shift toward generic drug substitution and the need for supply chain resilience put continuous pressure on profitability, even during periods of high volumetric demand.

Exclusive Technavio Analysis on Customer Landscape

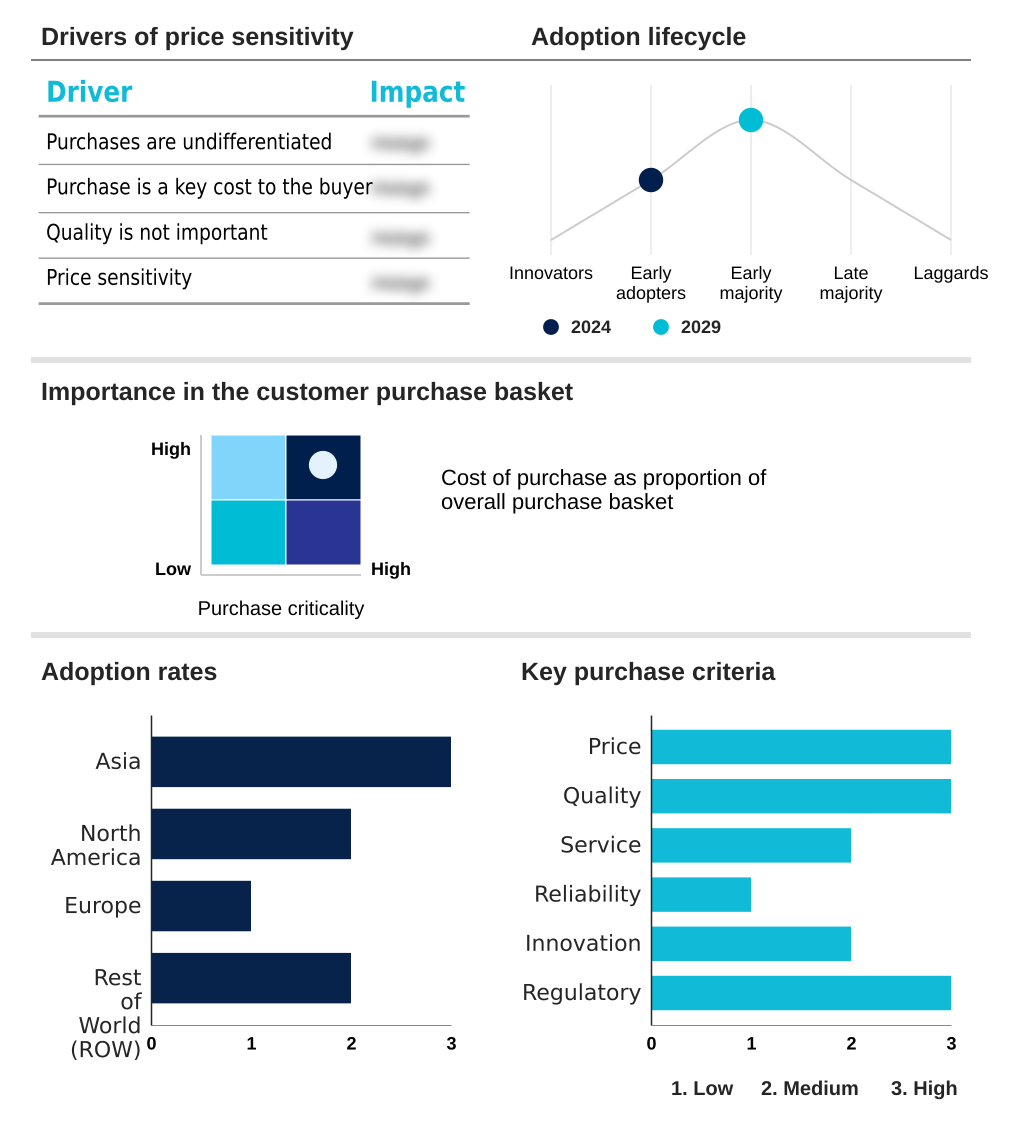
The tamiflu oseltamivir phosphate market forecasting report includes the adoption lifecycle of the market, covering from the innovator’s stage to the laggard’s stage. It focuses on adoption rates in different regions based on penetration. Furthermore, the tamiflu oseltamivir phosphate market report also includes key purchase criteria and drivers of price sensitivity to help companies evaluate and develop their market growth analysis strategies.

Customer Landscape of Tamiflu Oseltamivir Phosphate Industry

Competitive Landscape

Companies are implementing various strategies, such as strategic alliances, tamiflu oseltamivir phosphate market forecast, partnerships, mergers and acquisitions, geographical expansion, and product/service launches, to enhance their presence in the industry.

Alembic Pharmaceuticals Ltd. - Operations are centered on manufacturing and distributing a diverse portfolio of generic pharmaceuticals, including selective neuraminidase inhibitors for influenza A and B viruses.

The industry research and growth report includes detailed analyses of the competitive landscape of the market and information about key companies, including:

  • Alembic Pharmaceuticals Ltd.
  • Amneal Pharmaceuticals Inc.
  • Aurobindo Pharma Ltd.
  • Cipla Inc.
  • Epic Pharma LLC
  • F. Hoffmann La Roche Ltd.
  • Gilead Sciences Inc.
  • Hetero Labs Ltd.
  • Jubilant Generics Ltd.
  • Laurus Labs Ltd.
  • Lupin Ltd.
  • Macleods Pharmaceuticals Ltd.
  • MSN Laboratories
  • NATCO Pharma Ltd.
  • Nivagen Pharmaceuticals Inc.
  • Strides Pharma Ltd.
  • Teva Pharmaceutical Ltd.
  • Viatris Inc.
  • Zydus Group

Qualitative and quantitative analysis of companies has been conducted to help clients understand the wider business environment as well as the strengths and weaknesses of key industry players. Data is qualitatively analyzed to categorize companies as pure play, category-focused, industry-focused, and diversified; it is quantitatively analyzed to categorize companies as dominant, leading, strong, tentative, and weak.

Recent Development and News in Tamiflu oseltamivir phosphate market

  • In September, 2024, F. Hoffmann-La Roche Ltd. and Shionogi & Co. Ltd. are expected to file for expanded regulatory approval for baloxavir marboxil for treating hospitalized patients with severe influenza, following positive Phase III trial results, signaling intensified competition in the high-acuity care segment.
  • In November, 2024, the US Administration for Strategic Preparedness and Response (ASPR) is anticipated to issue a new procurement tender for approximately 5 million treatment courses of generic oseltamivir phosphate to replenish the Strategic National Stockpile, reinforcing the drug's role in national health security.
  • In January, 2025, Teva Pharmaceutical Ltd. announces a 15% expansion of its manufacturing capacity for oseltamivir phosphate oral formulations to meet projected increases in seasonal and pandemic preparedness demand across North America and Europe.
  • In April, 2025, Cipla Inc. receives approval from the European Medicines Agency (EMA) for its generic oseltamivir phosphate for oral suspension, expanding pediatric treatment options and increasing competitive pressure in the EU market.

Dive into Technavio’s robust research methodology, blending expert interviews, extensive data synthesis, and validated models for unparalleled Tamiflu Oseltamivir Phosphate Market insights. See full methodology.

Market Scope
Page number 283
Base year 2024
Historic period 2019-2023
Forecast period 2025-2029
Growth momentum & CAGR Accelerate at a CAGR of 4.6%
Market growth 2025-2029 USD 204.5 million
Market structure Fragmented
YoY growth 2024-2025(%) 4.4%
Key countries China, Japan, India, South Korea, Indonesia, Singapore, Thailand, US, Canada, Mexico, Germany, France, UK, Italy, Spain, Russia, The Netherlands, Brazil, South Africa, Saudi Arabia, UAE, Australia and Turkey
Competitive landscape Leading Companies, Market Positioning of Companies, Competitive Strategies, and Industry Risks

Request Free Sample

Research Analyst Overview

  • The tamiflu oseltamivir phosphate market functions as a mature, yet vital, segment of the antiviral medication landscape, primarily governed by the interplay of seasonal influenza patterns and strategic public health policy. Its core utility as a neuraminidase inhibitor for the treatment of acute influenza and for prophylactic use ensures consistent, albeit cyclical, demand.
  • The market is overwhelmingly dominated by generic formulations, making it a high-volume, cost-driven industry where supply chain logistics and manufacturing scale are key differentiators. Boardroom decisions increasingly center on pandemic preparedness, with government procurement for the strategic national stockpile representing a foundational revenue stream.
  • For example, companies with verified, geographically diverse production capabilities for the active pharmaceutical ingredient (API) are viewed as lower-risk partners, commanding a 5% to 10% premium on large contracts. The emergence of zoonotic influenza threats continues to validate investment in bioequivalent formulations that offer therapeutic equivalence.
  • While effective against both influenza a virus and influenza b virus, the market must contend with challenges from newer therapies and the constant need for public health surveillance to guide consumption and prevent viral replication inhibition.

What are the Key Data Covered in this Tamiflu Oseltamivir Phosphate Market Research and Growth Report?

  • What is the expected growth of the Tamiflu Oseltamivir Phosphate Market between 2025 and 2029?

    • USD 204.5 million, at a CAGR of 4.6%

  • What segmentation does the market report cover?

    • The report is segmented by Type (Branded, and Generic), Formulation (Capsules, and Suspension), Indication (Influenza A, Influenza B, and Swine flu) and Geography (Asia, North America, Europe, Rest of World (ROW))

  • Which regions are analyzed in the report?

    • Asia, North America, Europe and Rest of World (ROW)

  • What are the key growth drivers and market challenges?

    • Seasonal influenza incidence and severity, Intense generic competition and severe price erosion

  • Who are the major players in the Tamiflu Oseltamivir Phosphate Market?

    • Alembic Pharmaceuticals Ltd., Amneal Pharmaceuticals Inc., Aurobindo Pharma Ltd., Cipla Inc., Epic Pharma LLC, F. Hoffmann La Roche Ltd., Gilead Sciences Inc., Hetero Labs Ltd., Jubilant Generics Ltd., Laurus Labs Ltd., Lupin Ltd., Macleods Pharmaceuticals Ltd., MSN Laboratories, NATCO Pharma Ltd., Nivagen Pharmaceuticals Inc., Strides Pharma Ltd., Teva Pharmaceutical Ltd., Viatris Inc. and Zydus Group

Market Research Insights

  • The tamiflu oseltamivir phosphate market operates within a dynamic of intense cost pressure and strategic public health demand. The widespread adoption of generic drug substitution has become a cornerstone of pharmaceutical procurement, driving a highly competitive pricing environment.
  • This focus on cost-effectiveness is pivotal for government tender processes and pandemic response strategy planning, where securing large volumes at minimal cost is essential for healthcare system readiness. The market's performance is closely tied to seasonal demand forecasting and epidemiological trends, with a poor vaccine match one season potentially increasing treatment demand by up to 25% in the next.
  • Efficient supply chain resilience is a key differentiator, as demonstrated by leading suppliers who can guarantee delivery within 48 hours during a public health response, a critical factor in maintaining market leadership.

We can help! Our analysts can customize this tamiflu oseltamivir phosphate market research report to meet your requirements.

Get in touch

1. Executive Summary

1.1 Market overview

Executive Summary - Chart on Market Overview
Executive Summary - Data Table on Market Overview
Executive Summary - Chart on Global Market Characteristics
Executive Summary - Chart on Market by Geography
Executive Summary - Chart on Market Segmentation by Type
Executive Summary - Chart on Market Segmentation by Formulation
Executive Summary - Chart on Market Segmentation by Indication
Executive Summary - Chart on Incremental Growth
Executive Summary - Data Table on Incremental Growth
Executive Summary - Chart on Company Market Positioning

2. Technavio Analysis

2.1 Analysis of price sensitivity, lifecycle, customer purchase basket, adoption rates, and purchase criteria

2.2 Criticality of inputs and Factors of differentiation

Chart on Overview on criticality of inputs and factors of differentiation

2.3 Factors of disruption

Chart on Overview on factors of disruption

2.4 Impact of drivers and challenges

Chart on Impact of drivers and challenges in 2024 and 2029

3. Market Landscape

3.1 Market ecosystem

Chart on Parent Market
Data Table on - Parent Market

3.2 Market characteristics

Chart on Market characteristics analysis

3.3 Value chain analysis

Chart on Value chain analysis

4. Market Sizing

4.1 Market definition

Data Table on Offerings of companies included in the market definition

4.2 Market segment analysis

Market segments

4.3 Market size 2024

4.4 Market outlook: Forecast for 2024-2029

Chart on Global - Market size and forecast 2024-2029 ($ million)
Data Table on Global - Market size and forecast 2024-2029 ($ million)
Chart on Global Market: Year-over-year growth 2024-2029 (%)
Data Table on Global Market: Year-over-year growth 2024-2029 (%)

5. Historic Market Size

5.1 Global Tamiflu Oseltamivir Phosphate Market 2019 - 2023

Historic Market Size - Data Table on Global Tamiflu Oseltamivir Phosphate Market 2019 - 2023 ($ million)

5.2 Type segment analysis 2019 - 2023

Historic Market Size - Type Segment 2019 - 2023 ($ million)

5.3 Formulation segment analysis 2019 - 2023

Historic Market Size - Formulation Segment 2019 - 2023 ($ million)

5.4 Indication segment analysis 2019 - 2023

Historic Market Size - Indication Segment 2019 - 2023 ($ million)

5.5 Geography segment analysis 2019 - 2023

Historic Market Size - Geography Segment 2019 - 2023 ($ million)

5.6 Country segment analysis 2019 - 2023

Historic Market Size - Country Segment 2019 - 2023 ($ million)

6. Qualitative Analysis

6.1 The AI impact on global tamiflu oseltamivir phosphate market

7. Five Forces Analysis

7.1 Five forces summary

Five forces analysis - Comparison between 2024 and 2029

7.2 Bargaining power of buyers

Bargaining power of buyers - Impact of key factors 2024 and 2029

7.3 Bargaining power of suppliers

Bargaining power of suppliers - Impact of key factors in 2024 and 2029

7.4 Threat of new entrants

Threat of new entrants - Impact of key factors in 2024 and 2029

7.5 Threat of substitutes

Threat of substitutes - Impact of key factors in 2024 and 2029

7.6 Threat of rivalry

Threat of rivalry - Impact of key factors in 2024 and 2029

7.7 Market condition

Chart on Market condition - Five forces 2024 and 2029

8. Market Segmentation by Type

8.1 Market segments

Chart on Type - Market share 2024-2029 (%)
Data Table on Type - Market share 2024-2029 (%)

8.2 Comparison by Type

Chart on Comparison by Type
Data Table on Comparison by Type

8.3 Branded - Market size and forecast 2024-2029

Chart on Branded - Market size and forecast 2024-2029 ($ million)
Data Table on Branded - Market size and forecast 2024-2029 ($ million)
Chart on Branded - Year-over-year growth 2024-2029 (%)
Data Table on Branded - Year-over-year growth 2024-2029 (%)

8.4 Generic - Market size and forecast 2024-2029

Chart on Generic - Market size and forecast 2024-2029 ($ million)
Data Table on Generic - Market size and forecast 2024-2029 ($ million)
Chart on Generic - Year-over-year growth 2024-2029 (%)
Data Table on Generic - Year-over-year growth 2024-2029 (%)

8.5 Market opportunity by Type

Market opportunity by Type ($ million)
Data Table on Market opportunity by Type ($ million)

9. Market Segmentation by Formulation

9.1 Market segments

Chart on Formulation - Market share 2024-2029 (%)
Data Table on Formulation - Market share 2024-2029 (%)

9.2 Comparison by Formulation

Chart on Comparison by Formulation
Data Table on Comparison by Formulation

9.3 Capsules - Market size and forecast 2024-2029

Chart on Capsules - Market size and forecast 2024-2029 ($ million)
Data Table on Capsules - Market size and forecast 2024-2029 ($ million)
Chart on Capsules - Year-over-year growth 2024-2029 (%)
Data Table on Capsules - Year-over-year growth 2024-2029 (%)

9.4 Suspension - Market size and forecast 2024-2029

Chart on Suspension - Market size and forecast 2024-2029 ($ million)
Data Table on Suspension - Market size and forecast 2024-2029 ($ million)
Chart on Suspension - Year-over-year growth 2024-2029 (%)
Data Table on Suspension - Year-over-year growth 2024-2029 (%)

9.5 Market opportunity by Formulation

Market opportunity by Formulation ($ million)
Data Table on Market opportunity by Formulation ($ million)

10. Market Segmentation by Indication

10.1 Market segments

Chart on Indication - Market share 2024-2029 (%)
Data Table on Indication - Market share 2024-2029 (%)

10.2 Comparison by Indication

Chart on Comparison by Indication
Data Table on Comparison by Indication

10.3 Influenza A - Market size and forecast 2024-2029

Chart on Influenza A - Market size and forecast 2024-2029 ($ million)
Data Table on Influenza A - Market size and forecast 2024-2029 ($ million)
Chart on Influenza A - Year-over-year growth 2024-2029 (%)
Data Table on Influenza A - Year-over-year growth 2024-2029 (%)

10.4 Influenza B - Market size and forecast 2024-2029

Chart on Influenza B - Market size and forecast 2024-2029 ($ million)
Data Table on Influenza B - Market size and forecast 2024-2029 ($ million)
Chart on Influenza B - Year-over-year growth 2024-2029 (%)
Data Table on Influenza B - Year-over-year growth 2024-2029 (%)

10.5 Swine flu - Market size and forecast 2024-2029

Chart on Swine flu - Market size and forecast 2024-2029 ($ million)
Data Table on Swine flu - Market size and forecast 2024-2029 ($ million)
Chart on Swine flu - Year-over-year growth 2024-2029 (%)
Data Table on Swine flu - Year-over-year growth 2024-2029 (%)

10.6 Market opportunity by Indication

Market opportunity by Indication ($ million)
Data Table on Market opportunity by Indication ($ million)

11. Customer Landscape

11.1 Customer landscape overview

Analysis of price sensitivity, lifecycle, customer purchase basket, adoption rates, and purchase criteria

12. Geographic Landscape

12.1 Geographic segmentation

Chart on Market share by geography 2024-2029 (%)
Data Table on Market share by geography 2024-2029 (%)

12.2 Geographic comparison

Chart on Geographic comparison
Data Table on Geographic comparison

12.3 Asia - Market size and forecast 2024-2029

Chart on Asia - Market size and forecast 2024-2029 ($ million)
Data Table on Asia - Market size and forecast 2024-2029 ($ million)
Chart on Asia - Year-over-year growth 2024-2029 (%)
Data Table on Asia - Year-over-year growth 2024-2029 (%)
Chart on Regional Comparison - Asia
Data Table on Regional Comparison - Asia

12.3.1 China - Market size and forecast 2024-2029

Chart on China - Market size and forecast 2024-2029 ($ million)
Data Table on China - Market size and forecast 2024-2029 ($ million)
Chart on China - Year-over-year growth 2024-2029 (%)
Data Table on China - Year-over-year growth 2024-2029 (%)

12.3.2 Japan - Market size and forecast 2024-2029

Chart on Japan - Market size and forecast 2024-2029 ($ million)
Data Table on Japan - Market size and forecast 2024-2029 ($ million)
Chart on Japan - Year-over-year growth 2024-2029 (%)
Data Table on Japan - Year-over-year growth 2024-2029 (%)

12.3.3 India - Market size and forecast 2024-2029

Chart on India - Market size and forecast 2024-2029 ($ million)
Data Table on India - Market size and forecast 2024-2029 ($ million)
Chart on India - Year-over-year growth 2024-2029 (%)
Data Table on India - Year-over-year growth 2024-2029 (%)

12.3.4 South Korea - Market size and forecast 2024-2029

Chart on South Korea - Market size and forecast 2024-2029 ($ million)
Data Table on South Korea - Market size and forecast 2024-2029 ($ million)
Chart on South Korea - Year-over-year growth 2024-2029 (%)
Data Table on South Korea - Year-over-year growth 2024-2029 (%)

12.3.5 Indonesia - Market size and forecast 2024-2029

Chart on Indonesia - Market size and forecast 2024-2029 ($ million)
Data Table on Indonesia - Market size and forecast 2024-2029 ($ million)
Chart on Indonesia - Year-over-year growth 2024-2029 (%)
Data Table on Indonesia - Year-over-year growth 2024-2029 (%)

12.3.6 Singapore - Market size and forecast 2024-2029

Chart on Singapore - Market size and forecast 2024-2029 ($ million)
Data Table on Singapore - Market size and forecast 2024-2029 ($ million)
Chart on Singapore - Year-over-year growth 2024-2029 (%)
Data Table on Singapore - Year-over-year growth 2024-2029 (%)

12.3.7 Thailand - Market size and forecast 2024-2029

Chart on Thailand - Market size and forecast 2024-2029 ($ million)
Data Table on Thailand - Market size and forecast 2024-2029 ($ million)
Chart on Thailand - Year-over-year growth 2024-2029 (%)
Data Table on Thailand - Year-over-year growth 2024-2029 (%)

12.4 North America - Market size and forecast 2024-2029

Chart on North America - Market size and forecast 2024-2029 ($ million)
Data Table on North America - Market size and forecast 2024-2029 ($ million)
Chart on North America - Year-over-year growth 2024-2029 (%)
Data Table on North America - Year-over-year growth 2024-2029 (%)
Chart on Regional Comparison - North America
Data Table on Regional Comparison - North America

12.4.1 US - Market size and forecast 2024-2029

Chart on US - Market size and forecast 2024-2029 ($ million)
Data Table on US - Market size and forecast 2024-2029 ($ million)
Chart on US - Year-over-year growth 2024-2029 (%)
Data Table on US - Year-over-year growth 2024-2029 (%)

12.4.2 Canada - Market size and forecast 2024-2029

Chart on Canada - Market size and forecast 2024-2029 ($ million)
Data Table on Canada - Market size and forecast 2024-2029 ($ million)
Chart on Canada - Year-over-year growth 2024-2029 (%)
Data Table on Canada - Year-over-year growth 2024-2029 (%)

12.4.3 Mexico - Market size and forecast 2024-2029

Chart on Mexico - Market size and forecast 2024-2029 ($ million)
Data Table on Mexico - Market size and forecast 2024-2029 ($ million)
Chart on Mexico - Year-over-year growth 2024-2029 (%)
Data Table on Mexico - Year-over-year growth 2024-2029 (%)

12.5 Europe - Market size and forecast 2024-2029

Chart on Europe - Market size and forecast 2024-2029 ($ million)
Data Table on Europe - Market size and forecast 2024-2029 ($ million)
Chart on Europe - Year-over-year growth 2024-2029 (%)
Data Table on Europe - Year-over-year growth 2024-2029 (%)
Chart on Regional Comparison - Europe
Data Table on Regional Comparison - Europe

12.5.1 Germany - Market size and forecast 2024-2029

Chart on Germany - Market size and forecast 2024-2029 ($ million)
Data Table on Germany - Market size and forecast 2024-2029 ($ million)
Chart on Germany - Year-over-year growth 2024-2029 (%)
Data Table on Germany - Year-over-year growth 2024-2029 (%)

12.5.2 France - Market size and forecast 2024-2029

Chart on France - Market size and forecast 2024-2029 ($ million)
Data Table on France - Market size and forecast 2024-2029 ($ million)
Chart on France - Year-over-year growth 2024-2029 (%)
Data Table on France - Year-over-year growth 2024-2029 (%)

12.5.3 UK - Market size and forecast 2024-2029

Chart on UK - Market size and forecast 2024-2029 ($ million)
Data Table on UK - Market size and forecast 2024-2029 ($ million)
Chart on UK - Year-over-year growth 2024-2029 (%)
Data Table on UK - Year-over-year growth 2024-2029 (%)

12.5.4 Italy - Market size and forecast 2024-2029

Chart on Italy - Market size and forecast 2024-2029 ($ million)
Data Table on Italy - Market size and forecast 2024-2029 ($ million)
Chart on Italy - Year-over-year growth 2024-2029 (%)
Data Table on Italy - Year-over-year growth 2024-2029 (%)

12.5.5 Spain - Market size and forecast 2024-2029

Chart on Spain - Market size and forecast 2024-2029 ($ million)
Data Table on Spain - Market size and forecast 2024-2029 ($ million)
Chart on Spain - Year-over-year growth 2024-2029 (%)
Data Table on Spain - Year-over-year growth 2024-2029 (%)

12.5.6 Russia - Market size and forecast 2024-2029

Chart on Russia - Market size and forecast 2024-2029 ($ million)
Data Table on Russia - Market size and forecast 2024-2029 ($ million)
Chart on Russia - Year-over-year growth 2024-2029 (%)
Data Table on Russia - Year-over-year growth 2024-2029 (%)

12.5.7 The Netherlands - Market size and forecast 2024-2029

Chart on The Netherlands - Market size and forecast 2024-2029 ($ million)
Data Table on The Netherlands - Market size and forecast 2024-2029 ($ million)
Chart on The Netherlands - Year-over-year growth 2024-2029 (%)
Data Table on The Netherlands - Year-over-year growth 2024-2029 (%)

12.6 Rest of World (ROW) - Market size and forecast 2024-2029

Chart on Rest of World (ROW) - Market size and forecast 2024-2029 ($ million)
Data Table on Rest of World (ROW) - Market size and forecast 2024-2029 ($ million)
Chart on Rest of World (ROW) - Year-over-year growth 2024-2029 (%)
Data Table on Rest of World (ROW) - Year-over-year growth 2024-2029 (%)
Chart on Regional Comparison - Rest of World (ROW)
Data Table on Regional Comparison - Rest of World (ROW)

12.6.1 Brazil - Market size and forecast 2024-2029

Chart on Brazil - Market size and forecast 2024-2029 ($ million)
Data Table on Brazil - Market size and forecast 2024-2029 ($ million)
Chart on Brazil - Year-over-year growth 2024-2029 (%)
Data Table on Brazil - Year-over-year growth 2024-2029 (%)

12.6.2 South Africa - Market size and forecast 2024-2029

Chart on South Africa - Market size and forecast 2024-2029 ($ million)
Data Table on South Africa - Market size and forecast 2024-2029 ($ million)
Chart on South Africa - Year-over-year growth 2024-2029 (%)
Data Table on South Africa - Year-over-year growth 2024-2029 (%)

12.6.3 Saudi Arabia - Market size and forecast 2024-2029

Chart on Saudi Arabia - Market size and forecast 2024-2029 ($ million)
Data Table on Saudi Arabia - Market size and forecast 2024-2029 ($ million)
Chart on Saudi Arabia - Year-over-year growth 2024-2029 (%)
Data Table on Saudi Arabia - Year-over-year growth 2024-2029 (%)

12.6.4 UAE - Market size and forecast 2024-2029

Chart on UAE - Market size and forecast 2024-2029 ($ million)
Data Table on UAE - Market size and forecast 2024-2029 ($ million)
Chart on UAE - Year-over-year growth 2024-2029 (%)
Data Table on UAE - Year-over-year growth 2024-2029 (%)

12.6.5 Australia - Market size and forecast 2024-2029

Chart on Australia - Market size and forecast 2024-2029 ($ million)
Data Table on Australia - Market size and forecast 2024-2029 ($ million)
Chart on Australia - Year-over-year growth 2024-2029 (%)
Data Table on Australia - Year-over-year growth 2024-2029 (%)

12.6.6 Turkey - Market size and forecast 2024-2029

Chart on Turkey - Market size and forecast 2024-2029 ($ million)
Data Table on Turkey - Market size and forecast 2024-2029 ($ million)
Chart on Turkey - Year-over-year growth 2024-2029 (%)
Data Table on Turkey - Year-over-year growth 2024-2029 (%)

12.7 Market opportunity by geography

Market opportunity by geography ($ million)
Data Tables on Market opportunity by geography ($ million)

13. Drivers, Challenges, and Opportunity

13.1 Market drivers

Seasonal influenza incidence and severity
Government stockpiling and pandemic preparedness policies
Widespread availability and affordability of generic formulations

13.2 Market challenges

Intense generic competition and severe price erosion
High threat from substitute products and preventative measures
Demand volatility and complex supply chain management

13.3 Impact of drivers and challenges

Impact of drivers and challenges in 2024 and 2029

13.4 Market opportunities

Increasing adoption of novel antiviral therapies
Strategic diversification of manufacturing footprints
Integration of digital health and advanced diagnostics in clinical pathways

14. Competitive Landscape

14.1 Overview

14.2

Overview on criticality of inputs and factors of differentiation

14.3 Landscape disruption

Overview on factors of disruption

14.4 Industry risks

Impact of key risks on business

15. Competitive Analysis

15.1 Companies profiled

Companies covered

15.2 Company ranking index

15.3 Market positioning of companies

Matrix on companies position and classification

15.4 Alembic Pharmaceuticals Ltd.

Alembic Pharmaceuticals Ltd. - Overview
Alembic Pharmaceuticals Ltd. - Product / Service
Alembic Pharmaceuticals Ltd. - Key offerings
SWOT

15.5 Amneal Pharmaceuticals Inc.

Amneal Pharmaceuticals Inc. - Overview
Amneal Pharmaceuticals Inc. - Business segments
Amneal Pharmaceuticals Inc. - Key news
Amneal Pharmaceuticals Inc. - Key offerings
Amneal Pharmaceuticals Inc. - Segment focus
SWOT

15.6 Aurobindo Pharma Ltd.

Aurobindo Pharma Ltd. - Overview
Aurobindo Pharma Ltd. - Product / Service
Aurobindo Pharma Ltd. - Key offerings
SWOT

15.7 Cipla Inc.

Cipla Inc. - Overview
Cipla Inc. - Business segments
Cipla Inc. - Key news
Cipla Inc. - Key offerings
Cipla Inc. - Segment focus
SWOT

15.8 F. Hoffmann La Roche Ltd.

F. Hoffmann La Roche Ltd. - Overview
F. Hoffmann La Roche Ltd. - Business segments
F. Hoffmann La Roche Ltd. - Key news
F. Hoffmann La Roche Ltd. - Key offerings
F. Hoffmann La Roche Ltd. - Segment focus
SWOT

15.9 Gilead Sciences Inc.

Gilead Sciences Inc. - Overview
Gilead Sciences Inc. - Product / Service
Gilead Sciences Inc. - Key news
Gilead Sciences Inc. - Key offerings
SWOT

15.10 Laurus Labs Ltd.

Laurus Labs Ltd. - Overview
Laurus Labs Ltd. - Product / Service
Laurus Labs Ltd. - Key offerings
SWOT

15.11 Lupin Ltd.

Lupin Ltd. - Overview
Lupin Ltd. - Business segments
Lupin Ltd. - Key news
Lupin Ltd. - Key offerings
Lupin Ltd. - Segment focus
SWOT

15.12 Macleods Pharmaceuticals Ltd.

Macleods Pharmaceuticals Ltd. - Overview
Macleods Pharmaceuticals Ltd. - Product / Service
Macleods Pharmaceuticals Ltd. - Key offerings
SWOT

15.13 MSN Laboratories

MSN Laboratories - Overview
MSN Laboratories - Product / Service
MSN Laboratories - Key offerings
SWOT

15.14 NATCO Pharma Ltd.

NATCO Pharma Ltd. - Overview
NATCO Pharma Ltd. - Product / Service
NATCO Pharma Ltd. - Key offerings
SWOT

15.15 Strides Pharma Ltd.

Strides Pharma Ltd. - Overview
Strides Pharma Ltd. - Product / Service
Strides Pharma Ltd. - Key offerings
SWOT

15.16 Teva Pharmaceutical Ltd.

Teva Pharmaceutical Ltd. - Overview
Teva Pharmaceutical Ltd. - Business segments
Teva Pharmaceutical Ltd. - Key news
Teva Pharmaceutical Ltd. - Key offerings
Teva Pharmaceutical Ltd. - Segment focus
SWOT

15.17 Viatris Inc.

Viatris Inc. - Overview
Viatris Inc. - Business segments
Viatris Inc. - Key news
Viatris Inc. - Key offerings
Viatris Inc. - Segment focus
SWOT

15.18 Zydus Group

Zydus Group - Overview
Zydus Group - Product / Service
Zydus Group - Key offerings
SWOT

16. Appendix

16.1 Scope of the report

Market definition
Objectives
Notes and caveats

16.2 Inclusions and exclusions checklist

Inclusions checklist
Exclusions checklist

16.3 Currency conversion rates for US$

16.4 Research methodology

16.5 Data procurement

Information sources

16.6 Data validation

16.7 Validation techniques employed for market sizing

16.8 Data synthesis

16.9 360 degree market analysis

16.10 List of abbreviations

Research Methodology

Technavio presents a detailed picture of the market by way of study, synthesis, and summation of data from multiple sources. The analysts have presented the various facets of the market with a particular focus on identifying the key industry influencers. The data thus presented is comprehensive, reliable, and the result of extensive research, both primary and secondary.

INFORMATION SOURCES

Primary sources

  • Manufacturers and suppliers
  • Channel partners
  • Industry experts
  • Strategic decision makers

Secondary sources

  • Industry journals and periodicals
  • Government data
  • Financial reports of key industry players
  • Historical data
  • Press releases

DATA ANALYSIS

Data Synthesis

  • Collation of data
  • Estimation of key figures
  • Analysis of derived insights

Data Validation

  • Triangulation with data models
  • Reference against proprietary databases
  • Corroboration with industry experts

REPORT WRITING

Qualitative

  • Market drivers
  • Market challenges
  • Market trends
  • Five forces analysis

Quantitative

  • Market size and forecast
  • Market segmentation
  • Geographical insights
  • Competitive landscape

Interested in this report?

Get your sample now to see our research methodology and insights!

Download Now

Frequently Asked Questions

Tamiflu Oseltamivir Phosphate market growth will increase by USD 204.5 million during 2025-2029 .

The Tamiflu Oseltamivir Phosphate market is expected to grow at a CAGR of 4.6% during 2025-2029 .

Tamiflu Oseltamivir Phosphate market is segmented by Type (Branded, Generic) Formulation (Capsules, Suspension) Indication (Influenza A, Influenza B, Swine flu)

Alembic Pharmaceuticals Ltd., Amneal Pharmaceuticals Inc., Aurobindo Pharma Ltd., Cipla Inc., Epic Pharma LLC, F. Hoffmann La Roche Ltd., Gilead Sciences Inc., Hetero Labs Ltd., Jubilant Generics Ltd., Laurus Labs Ltd., Lupin Ltd., Macleods Pharmaceuticals Ltd., MSN Laboratories, NATCO Pharma Ltd., Nivagen Pharmaceuticals Inc., Strides Pharma Ltd., Teva Pharmaceutical Ltd., Viatris Inc., Zydus Group are a few of the key vendors in the Tamiflu Oseltamivir Phosphate market.

Asia will register the highest growth rate of 45.6% among the other regions. Therefore, the Tamiflu Oseltamivir Phosphate market in Asia is expected to garner significant business opportunities for the vendors during the forecast period.

China, Japan, India, South Korea, Indonesia, Singapore, Thailand, US, Canada, Mexico, Germany, France, UK, Italy, Spain, Russia, The Netherlands, Brazil, South Africa, Saudi Arabia, UAE, Australia, Turkey

  • Seasonal influenza incidence and severity is the driving factor this market.

The Tamiflu Oseltamivir Phosphate market vendors should focus on grabbing business opportunities from the Type segment as it accounted for the largest market share in the base year.