Tapioca Market Analysis, Size, and Forecast 2024-2028: North America (US and Canada), Europe (France, Germany, Italy, and UK), Middle East and Africa (Egypt, KSA, Oman, and UAE), APAC (China, India, and Japan), South America (Argentina and Brazil), and Rest of World (ROW)

Tapioca Market Analysis, Size, and Forecast 2024-2028:
North America (US and Canada), Europe (France, Germany, Italy, and UK), Middle East and Africa (Egypt, KSA, Oman, and UAE), APAC (China, India, and Japan), South America (Argentina and Brazil), and Rest of World (ROW)

Published: May 2024 166 Pages SKU: IRTNTR45734

Market Overview at a Glance

$44.2 Mn
Market Opportunity
4.42%
CAGR
4.16
YoY growth 2023-2024(%)

Tapioca Market Size 2024-2028

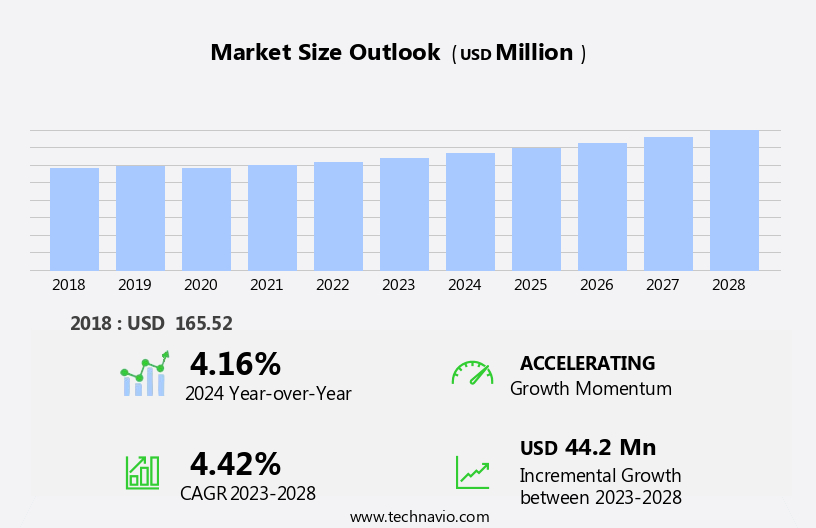
The tapioca market size is forecast to increase by USD 44.2 million, at a CAGR of 4.42% between 2023 and 2028.

  • The market is driven by the growing trend towards alternative food options, particularly those that are gluten-free and grain-free. Tapioca, derived from the cassava root, offers a versatile and cost-effective solution for consumers seeking to avoid traditional grains. Additionally, the usage of tapioca in bioplastics and infant nutrition supplements, including infant formula, baby food products, and organic meat alternatives, is driving market expansion. However, the complexities related to the overconsumption of tapioca, such as its high glycemic index and potential contribution to heart disease, pose challenges to market growth. Furthermore, the increasing popularity of superfoods and organic products is fueling demand for high-quality, sustainably sourced tapioca extracts. The complexities surrounding the sustainability and ethical implications of mass production and consumption of tapioca products must be addressed to ensure long-term market growth.
  • Companies seeking to capitalize on this market's opportunities must focus on innovation, sustainability, and ethical production practices to meet the evolving demands of consumers and stakeholders.

What will be the Size of the Tapioca Market during the forecast period?

Tapioca Market Size

Explore in-depth regional segment analysis with market size data - historical 2018-2022 and forecasts 2024-2028 - in the full report.  
Request Free Sample

Tapioca, derived from the root of the cassava plant, continues to be a dynamic and evolving market due to its versatile applications across various sectors. Its unique properties, including high amylose content and amylopectin, make it a valuable resource for industries such as food and beverage, pharmaceuticals, and industrial sectors. The ongoing research and development in tapioca processing techniques aim to enhance its efficiency and utility. Tapioca waste and by-products are being explored for their potential in creating new value-added products, such as starch derivatives and films. The focus on sustainability metrics and eco-friendly processing methods is also gaining momentum in the tapioca industry.

Tapioca starch extraction and gelatinization processes are continually refined to optimize yield and functionality. The rheological properties of tapioca starch are of particular interest, as they impact its use in various applications, from food grade to industrial applications. The continuous exploration of tapioca's potential is evident in the emergence of new technologies and applications. For instance, tapioca starch hydrolysis leads to the production of syrups and sweeteners, while tapioca-based adhesives offer sustainable alternatives to traditional adhesives. The dynamic nature of the market is further underscored by ongoing research into its properties and potential applications. For example, tapioca starch crystallization and modifications are being studied to expand its use in various industries.

The potential for tapioca starch films and Biodegradable Plastics is a promising area of exploration, highlighting the ongoing evolution of the market.

How is this Tapioca Industry segmented?

The tapioca industry research report provides comprehensive data (region-wise segment analysis), with forecasts and estimates in "USD million" for the period 2024-2028, as well as historical data from 2018-2022 for the following segments.

  • Application
    • Animal feed
    • Food and beverage
    • Industrial
  • Type
    • Fresh
    • Dried
  • Product
    • Tapioca Animal Feed
    • Tapioca Flour
    • Tapioca Chips
    • Tapioca Pellets
    • Tapioca Pearls
    • Tapioca Syrup
    • Tapioca Maltodextrins
    • Tapioca Syrup Solids
  • Source
    • Organic
    • Conventional
  • Distribution Channel
    • Supermarkets/Hypermarkets
    • Convenience Stores
    • Online
    • Others
  • Geography
    • North America
      • US
      • Canada
    • Europe
      • France
      • Germany
      • Italy
      • UK
    • Middle East and Africa
      • Egypt
      • KSA
      • Oman
      • UAE
    • APAC
      • China
      • India
      • Japan
    • South America
      • Argentina
      • Brazil
    • Rest of World (ROW)

By Application Insights

The animal feed segment is estimated to witness significant growth during the forecast period.

Tapioca, derived from the cassava root, offers versatile applications in various industries. The animal feed segment dominates The market, accounting for over a quarter of its usage in 2023. This is due to the increasing demand for alternative feed sources as the prices of traditional animal feed raw materials like maize continue to rise. Tapioca waste, or cassava pomace, is a byproduct of starch processing and is primarily used as animal feed. Approximately equal amounts of starch and cassava pomace are generated from cassava roots. Industrial tapioca applications include food, pharmaceuticals, and paper industries.

Tapioca starch undergoes processes like retrogradation, oxidation, gelatinization, and hydrolysis to enhance its functionality. Modifications like derivatives and crystallization further expand its uses. Tapioca dextrin, with its unique properties, is gaining popularity in food and pharmaceutical industries. Sustainability is a significant concern in tapioca processing, with efforts being made to optimize processing efficiency and minimize waste. Cassava processing techniques, such as fermentation and enzyme treatment, are being explored to enhance tapioca starch quality. Tapioca syrup manufacturing and the production of tapioca-based adhesives are other growing applications. Food grade tapioca and its rheological properties are crucial in the food industry, while tapioca starch films find applications in packaging.

Tapioca Market Size

Request Free Sample

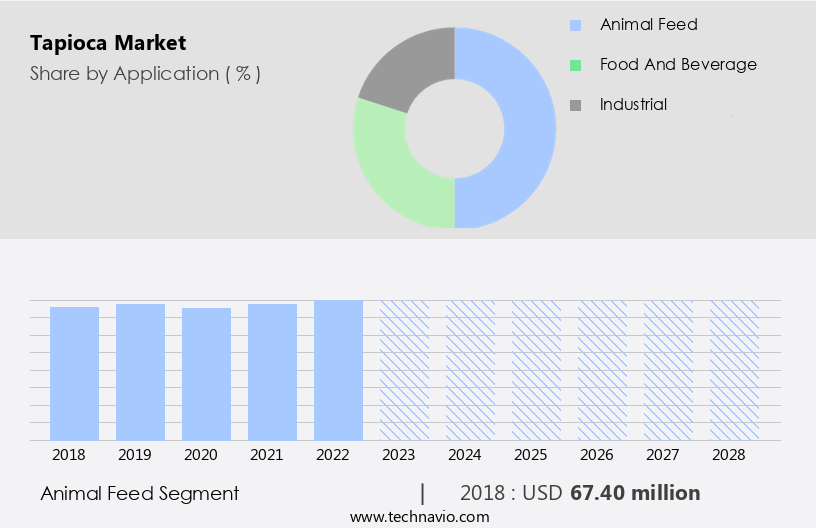
The Animal feed segment was valued at USD 67.40 million in 2018 and showed a gradual increase during the forecast period.

Regional Analysis

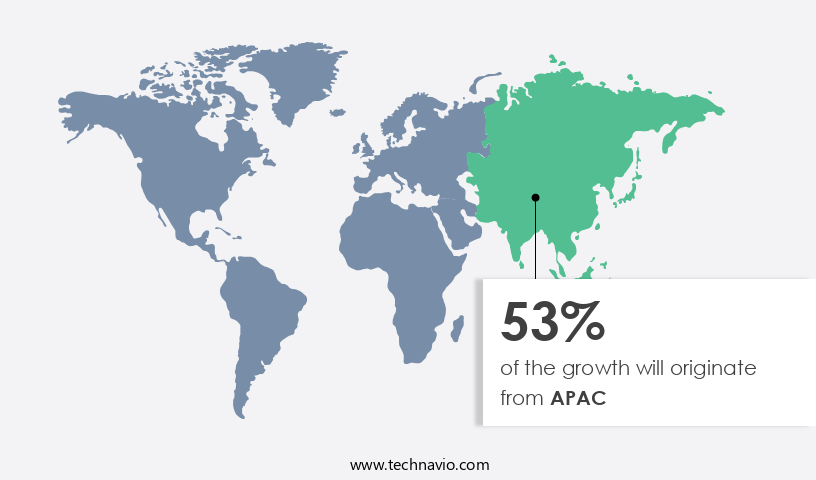
APAC is estimated to contribute 53% to the growth of the global market during the forecast period.Technavio's analysts have elaborately explained the regional trends and drivers that shape the market during the forecast period.

Tapioca Market Share by Geography

 Request Free Sample

The market is characterized by its extensive use in various industries and applications. Tapioca pearls come in different sizes, catering to diverse consumer preferences in food and beverage sectors. Industrial tapioca finds significant use in the production of adhesives, paper, and textiles. Tapioca starch undergoes retrogradation and oxidation, influencing its functionality and viscosity. Gelatinization is a crucial process in tapioca starch production, while dextrin is a valuable by-product with unique properties. The amylose and amylopectin content in tapioca varies, affecting its processing efficiency and end-use applications. Cassava processing techniques are essential in tapioca production, with countries like Thailand and Vietnam being major global exporters.

South-Eastern Asia is the largest consumer region, with China, Thailand, Indonesia, Vietnam, and India being key markets. Japan, Cambodia, and the Philippines also exhibit rising demand. Tapioca starch hydrolysis leads to derivatives and modifications, expanding its applications in food, pharmaceuticals, and other industries. Sustainability metrics are increasingly important in tapioca production and processing, with a focus on minimizing waste and optimizing efficiency. Tapioca starch films, syrup manufacturing, and other value-added products further broaden its market scope.

Market Dynamics

The Global Tapioca Market is experiencing robust growth, fueled by versatile applications and rising health-conscious demand. The commercial tapioca market thrives as tapioca in food industry gains popularity, particularly in tapioca for bubble tea and tapioca for vegan diets. Innovations like tapioca-based bioplastics and tapioca sustainable packaging address eco-friendly trends, while tapioca for digestive health and benefits of tapioca for digestive health appeal to wellness-focused consumers. The tapioca gluten-free market grows with gluten-free tapioca products, supported by tapioca for clean-label foods. Advanced tapioca starch extraction and tapioca processing technology, including tapioca pearl machines, enhance efficiency. Tapioca for food texture and tapioca starch innovations drive the tapioca beverage market and tapioca for low-carb diets, shaping a dynamic industry landscape.

Our researchers analyzed the data with 2023 as the base year, along with the key drivers, trends, and challenges. A holistic analysis of drivers will help companies refine their marketing strategies to gain a competitive advantage.

What are the key market drivers leading to the rise in the adoption of Tapioca Industry?

  • The growing preference for alternatives to gluten and grain food products is the primary market driver. This trend is shaped by an increasing awareness and intolerance towards gluten and grains among consumers, leading to a significant demand for gluten-free and grain-free food options. 
  • Tapioca, derived from the cassava root, is a popular alternative to gluten-for those with intolerance or allergies to wheat and related grains. The versatile starch is available in various sizes as tapioca pearls and is used extensively in industrial applications, including food, pharmaceuticals, and cosmetics. Tapioca starch undergoes processes like retrogradation and oxidation, which affect its functionality and gelatinization properties. These processes are crucial in determining the final product's texture and performance.
  • The production of tapioca flour is a significant industry, with various methods used to extract and refine the starch. Understanding the dynamics of tapioca starch's behavior during processing is essential for optimizing its functionality in various applications.

What are the market trends shaping the Tapioca Industry?

  • Trends in the bioplastics industry include the increasing use of tapioca as a raw material. This eco-friendly alternative to traditional plastics is gaining popularity due to its sustainability and biodegradability.
  • Tapioca, a starch derived from the cassava root, offers valuable properties for the production of biodegradable bioplastics. With an amylose content of approximately 25%, tapioca starch is an effective raw material for bioplastic manufacturing. The utilization of tapioca waste in bioplastic production is a sustainable solution for reducing industrial waste and increasing processing efficiency. Tapioca processing involves the extraction of starch, which is rich in amylopectin, a complex carbohydrate that enhances the biodegradability of bioplastics. The bioplastics derived from tapioca are characterized by their odorless, smooth, and transparent properties.
  • Tapioca processing by-products can be further refined to extract additional value, such as tapioca dextrin, which can be used as a thickener or sweetener in various industries. The use of tapioca in bioplastic production is a promising development in the bioplastics industry, contributing to the production of eco-friendly and sustainable materials.

What challenges does the Tapioca Industry face during its growth?

  • The complexities arising from overconsumption pose a significant challenge to the industry's growth trajectory. 
  • Tapioca, derived from the cassava root, is a starch that offers various applications in the food, pharmaceutical, and industrial sectors. The production process involves tapioca starch hydrolysis, which affects its viscosity and determines its suitability for different uses. Tapioca starch derivatives and modifications are essential for enhancing its functional properties, such as thickening, gelling, and film-forming abilities. Sustainability metrics play a crucial role in the market, with a focus on eco-friendly cassava processing techniques that minimize waste and ensure efficient use of resources. Tapioca starch films are gaining popularity due to their biodegradability and potential as sustainable alternatives to synthetic plastics.
  • Despite its numerous benefits, tapioca consumption should be monitored due to its high glycemic index, which can cause rapid increases in blood sugar levels. Proper processing techniques are also necessary to eliminate linamarin, a toxic compound found in raw tapioca, which can be converted to cyanide in the human body.

Exclusive Customer Landscape

The tapioca market forecasting report includes the adoption lifecycle of the market, covering from the innovator's stage to the laggard's stage. It focuses on adoption rates in different regions based on penetration. Furthermore, the tapioca market report also includes key purchase criteria and drivers of price sensitivity to help companies evaluate and develop their market growth analysis strategies.

Tapioca Market Share by Geography

 Customer Landscape

Key Companies & Market Insights

Companies are implementing various strategies, such as strategic alliances, tapioca market forecast, partnerships, mergers and acquisitions, geographical expansion, and product/service launches, to enhance their presence in the industry.

American Key Products Inc. - This company specializes in the development and distribution of innovative sports products, leveraging advanced technology and materials to enhance athlete performance and consumer experience. Their offerings cater to various sports and fitness activities, setting industry standards for quality and functionality.

The industry research and growth report includes detailed analyses of the competitive landscape of the market and information about key companies, including:

  • American Key Products Inc.
  • Authentic Foods
  • Cargill Inc.
  • Ciranda Inc.
  • Ekta International
  • Emsland Starke GmbH
  • Hunan Kang pharmaceutical Ltd.
  • Ingredion Inc.
  • Jayavel Sago Factory
  • KengSeng Group of Co.
  • Malt Products Corp.
  • Parchem Fine and Specialty Chemicals Inc.
  • PT Budi Starch and Sweetener Tbk
  • Royal Ingredients Group BV
  • Sonish Starch Technology Co. Ltd.
  • SPAC Starch Products India Pvt. Ltd.
  • Tapioca Vietnam
  • Tate and Lyle PLC
  • Tereos Participations
  • Venus Starch Suppliers

Qualitative and quantitative analysis of companies has been conducted to help clients understand the wider business environment as well as the strengths and weaknesses of key industry players. Data is qualitatively analyzed to categorize companies as pure play, category-focused, industry-focused, and diversified; it is quantitatively analyzed to categorize companies as dominant, leading, strong, tentative, and weak.

Recent Development and News in Tapioca Market

  • In January 2024, leading tapioca starch producer, Amalgamated Starch Corporation, announced a strategic partnership with food processing giant, Nestle, to expand their tapioca-based food offerings. This collaboration aimed to increase the production capacity of tapioca starch by 30%, as reported in Amalgamated Starch's Q1 2024 press release.
  • In March 2024, Brazilian tapioca starch manufacturer, GranBio, secured a USD50 million investment from the Brazilian Development Bank (BNDES) to expand its production capacity and support the growing global demand for sustainable bio-based ingredients. According to GranBio's press release, the investment would enable the company to increase its annual production capacity to 1.5 million metric tons.
  • In May 2024, the European Union approved the use of tapioca starch as a functional ingredient in food and feed applications, as stated in the European Commission's official press release. This approval opened new opportunities for tapioca starch producers to enter the European market, which is the world's second-largest food market.
  • In April 2025, Thai tapioca starch producer, Mitr Phol, acquired a 51% stake in Indonesian tapioca starch manufacturer, PT Pabrik Tapioka Indonesia. The acquisition, as reported in Mitr Phol's Q1 2025 financial report, was aimed at expanding Mitr Phol's production capacity and market share in the Southeast Asian region.

Research Analyst Overview

  • In the dynamic tapioca starch market, various types of tapioca starch, including native, hydroxypropyl, phosphate-modified, and pre-gelatinized, cater to diverse applications. Tapioca starch packaging ensures product preservation, while rheology and digestibility properties influence its usage in food, pharmaceutical, and industrial sectors. Nutrition and benefits of tapioca starch, such as high digestibility and gluten-free properties, fuel demand. Pricing, storage, and transportation costs are crucial factors influencing market trends.
  • Cassava cultivation methods impact the purity and quality of tapioca starch production. Oxidized, acetylated, crosslinked, and enzyme-modified tapioca starch varieties expand the market scope. Tapioca starch uses in industries like paper, textile, and adhesives continue to grow, driving market expansion.

Dive into Technavio's robust research methodology, blending expert interviews, extensive data synthesis, and validated models for unparalleled Tapioca Market insights. See full methodology.

Market Scope

Report Coverage

Details

Page number

166

Base year

2023

Historic period

2018-2022

Forecast period

2024-2028

Growth momentum & CAGR

Accelerate at a CAGR of 4.42%

Market growth 2024-2028

USD 44.2 million

Market structure

Fragmented

YoY growth 2023-2024(%)

4.16

Key countries

US, Canada, Germany, UK, Italy, France, China, India, Japan, Brazil, Egypt, UAE, Oman, Argentina, KSA, UAE, Brazil, and Rest of World (ROW)

Competitive landscape

Leading Companies, Market Positioning of Companies, Competitive Strategies, and Industry Risks

Request Free Sample

What are the Key Data Covered in this Tapioca Market Research and Growth Report?

  • CAGR of the Tapioca industry during the forecast period
  • Detailed information on factors that will drive the growth and forecasting between 2024 and 2028
  • Precise estimation of the size of the market and its contribution of the industry in focus to the parent market
  • Accurate predictions about upcoming growth and trends and changes in consumer behaviour
  • Growth of the market across APAC, Europe, North America, South America, and Middle East and Africa
  • Thorough analysis of the market's competitive landscape and detailed information about companies
  • Comprehensive analysis of factors that will challenge the tapioca market growth of industry companies

We can help! Our analysts can customize this tapioca market research report to meet your requirements.

Get in touch

1 Executive Summary

  • 1.1 Market overview
    • Executive Summary - Chart on Market Overview
    • Executive Summary - Data Table on Market Overview
    • Executive Summary - Chart on Global Market Characteristics
    • Executive Summary - Chart on Market by Geography
    • Executive Summary - Chart on Market Segmentation by Application
    • Executive Summary - Chart on Market Segmentation by Type
    • Executive Summary - Chart on Incremental Growth
    • Executive Summary - Data Table on Incremental Growth
    • Executive Summary - Chart on Company Market Positioning

2 Market Landscape

  • 2.1 Market ecosystem
    • Parent Market
    • Data Table on - Parent Market
  • 2.2 Market characteristics
    • Market characteristics analysis
  • 2.3 Value chain analysis
    • Value Chain Analysis

3 Market Sizing

  • 3.1 Market definition
    • Offerings of companies included in the market definition
  • 3.2 Market segment analysis
    • Market segments
  • 3.3 Market size 2023
    • 3.4 Market outlook: Forecast for 2023-2028
      • Chart on Global - Market size and forecast 2023-2028 ($ million)
      • Data Table on Global - Market size and forecast 2023-2028 ($ million)
      • Chart on Global Market: Year-over-year growth 2023-2028 (%)
      • Data Table on Global Market: Year-over-year growth 2023-2028 (%)

    4 Historic Market Size

    • 4.1 Global Tapioca Market 2018 - 2022
      • Historic Market Size - Data Table on Global Tapioca Market 2018 - 2022 ($ million)
    • 4.2 Application segment analysis 2018 - 2022
      • Historic Market Size - Application Segment 2018 - 2022 ($ million)
    • 4.3 Type segment analysis 2018 - 2022
      • Historic Market Size - Type Segment 2018 - 2022 ($ million)
    • 4.4 Geography segment analysis 2018 - 2022
      • Historic Market Size - Geography Segment 2018 - 2022 ($ million)
    • 4.5 Country segment analysis 2018 - 2022
      • Historic Market Size - Country Segment 2018 - 2022 ($ million)

    5 Five Forces Analysis

    • 5.1 Five forces summary
      • Five forces analysis - Comparison between 2023 and 2028
    • 5.2 Bargaining power of buyers
      • Bargaining power of buyers - Impact of key factors 2023 and 2028
    • 5.3 Bargaining power of suppliers
      • Bargaining power of suppliers - Impact of key factors in 2023 and 2028
    • 5.4 Threat of new entrants
      • Threat of new entrants - Impact of key factors in 2023 and 2028
    • 5.5 Threat of substitutes
      • Threat of substitutes - Impact of key factors in 2023 and 2028
    • 5.6 Threat of rivalry
      • Threat of rivalry - Impact of key factors in 2023 and 2028
    • 5.7 Market condition
      • Chart on Market condition - Five forces 2023 and 2028

    6 Market Segmentation by Application

    • 6.1 Market segments
      • Chart on Application - Market share (2023-2028) (%)
      • Data Table on Application - Market share (2023-2028) (%)
    • 6.2 Comparison by Application
      • Chart on Comparison by Application
      • Data Table on Comparison by Application
    • 6.3 Animal feed - Market size and forecast (2023-2028)
      • Chart on Animal feed - Market size and forecast (2023-2028) ($ million)
      • Data Table on Animal feed - Market size and forecast (2023-2028) ($ million)
      • Chart on Animal feed - Year-over-year growth (2023-2028) (%)
      • Data Table on Animal feed - Year-over-year growth (2023-2028) (%)
    • 6.4 Food and beverage - Market size and forecast (2023-2028)
      • Chart on Food and beverage - Market size and forecast (2023-2028) ($ million)
      • Data Table on Food and beverage - Market size and forecast (2023-2028) ($ million)
      • Chart on Food and beverage - Year-over-year growth (2023-2028) (%)
      • Data Table on Food and beverage - Year-over-year growth (2023-2028) (%)
    • 6.5 Industrial - Market size and forecast (2023-2028)
      • Chart on Industrial - Market size and forecast (2023-2028) ($ million)
      • Data Table on Industrial - Market size and forecast (2023-2028) ($ million)
      • Chart on Industrial - Year-over-year growth (2023-2028) (%)
      • Data Table on Industrial - Year-over-year growth (2023-2028) (%)
    • 6.6 Market opportunity by Application
      • Market opportunity by Application ($ million)
      • Data Table on Market opportunity by Application ($ million)

    7 Market Segmentation by Type

    • 7.1 Market segments
      • Chart on Type - Market share (2023-2028) (%)
      • Data Table on Type - Market share (2023-2028) (%)
    • 7.2 Comparison by Type
      • Chart on Comparison by Type
      • Data Table on Comparison by Type
    • 7.3 Fresh - Market size and forecast (2023-2028)
      • Chart on Fresh - Market size and forecast (2023-2028) ($ million)
      • Data Table on Fresh - Market size and forecast (2023-2028) ($ million)
      • Chart on Fresh - Year-over-year growth (2023-2028) (%)
      • Data Table on Fresh - Year-over-year growth (2023-2028) (%)
    • 7.4 Dried - Market size and forecast (2023-2028)
      • Chart on Dried - Market size and forecast (2023-2028) ($ million)
      • Data Table on Dried - Market size and forecast (2023-2028) ($ million)
      • Chart on Dried - Year-over-year growth (2023-2028) (%)
      • Data Table on Dried - Year-over-year growth (2023-2028) (%)
    • 7.5 Market opportunity by Type
      • Market opportunity by Type ($ million)
      • Data Table on Market opportunity by Type ($ million)

    8 Market Segmentation by Product

    • 8.1 Market segments
      • Chart on Product - Market share (2023-2028) (%)
      • Data Table on Product - Market share (2023-2028) (%)
      • Chart on Tapioca Syrup Solids - Market size and forecast (2023-2028) ($ million)
      • Data Table on Tapioca Syrup Solids - Market size and forecast (2023-2028) ($ million)
      • Chart on Tapioca Syrup Solids - Year-over-year growth (2023-2028) (%)
      • Data Table on Tapioca Syrup Solids - Year-over-year growth (2023-2028) (%)
    • 8.2 Comparison by Product
      • Chart on Comparison by Product
      • Data Table on Comparison by Product
      • Market opportunity by Product ($ million)
      • Data Table on Market opportunity by Product ($ million)
    • 8.3 Tapioca Animal Feed - Market size and forecast (2023-2028)
      • Chart on Tapioca Animal Feed - Market size and forecast (2023-2028) ($ million)
      • Data Table on Tapioca Animal Feed - Market size and forecast (2023-2028) ($ million)
      • Chart on Tapioca Animal Feed - Year-over-year growth (2023-2028) (%)
      • Data Table on Tapioca Animal Feed - Year-over-year growth (2023-2028) (%)
    • 8.4 Tapioca Flour - Market size and forecast (2023-2028)
      • Chart on Tapioca Flour - Market size and forecast (2023-2028) ($ million)
      • Data Table on Tapioca Flour - Market size and forecast (2023-2028) ($ million)
      • Chart on Tapioca Flour - Year-over-year growth (2023-2028) (%)
      • Data Table on Tapioca Flour - Year-over-year growth (2023-2028) (%)
    • 8.5 Tapioca Chips - Market size and forecast (2023-2028)
      • Chart on Tapioca Chips - Market size and forecast (2023-2028) ($ million)
      • Data Table on Tapioca Chips - Market size and forecast (2023-2028) ($ million)
      • Chart on Tapioca Chips - Year-over-year growth (2023-2028) (%)
      • Data Table on Tapioca Chips - Year-over-year growth (2023-2028) (%)
    • 8.6 Tapioca Pellets - Market size and forecast (2023-2028)
      • Chart on Tapioca Pellets - Market size and forecast (2023-2028) ($ million)
      • Data Table on Tapioca Pellets - Market size and forecast (2023-2028) ($ million)
      • Chart on Tapioca Pellets - Year-over-year growth (2023-2028) (%)
      • Data Table on Tapioca Pellets - Year-over-year growth (2023-2028) (%)
    • 8.7 Tapioca Pearls - Market size and forecast (2023-2028)
      • Chart on Tapioca Pearls - Market size and forecast (2023-2028) ($ million)
      • Data Table on Tapioca Pearls - Market size and forecast (2023-2028) ($ million)
      • Chart on Tapioca Pearls - Year-over-year growth (2023-2028) (%)
      • Data Table on Tapioca Pearls - Year-over-year growth (2023-2028) (%)
    • 8.8 Tapioca Syrup - Market size and forecast (2023-2028)
      • Chart on Tapioca Syrup - Market size and forecast (2023-2028) ($ million)
      • Data Table on Tapioca Syrup - Market size and forecast (2023-2028) ($ million)
      • Chart on Tapioca Syrup - Year-over-year growth (2023-2028) (%)
      • Data Table on Tapioca Syrup - Year-over-year growth (2023-2028) (%)
    • 8.9 Tapioca Maltodextrins - Market size and forecast (2023-2028)
      • Chart on Tapioca Maltodextrins - Market size and forecast (2023-2028) ($ million)
      • Data Table on Tapioca Maltodextrins - Market size and forecast (2023-2028) ($ million)
      • Chart on Tapioca Maltodextrins - Year-over-year growth (2023-2028) (%)
      • Data Table on Tapioca Maltodextrins - Year-over-year growth (2023-2028) (%)

    9 Market Segmentation by Source

    • 9.1 Market segments
      • Chart on Source - Market share (2023-2028) (%)
      • Data Table on Source - Market share (2023-2028) (%)
    • 9.2 Comparison by Source
      • Chart on Comparison by Source
      • Data Table on Comparison by Source
    • 9.3 Organic - Market size and forecast (2023-2028)
      • Chart on Organic - Market size and forecast (2023-2028) ($ million)
      • Data Table on Organic - Market size and forecast (2023-2028) ($ million)
      • Chart on Organic - Year-over-year growth (2023-2028) (%)
      • Data Table on Organic - Year-over-year growth (2023-2028) (%)
    • 9.4 Conventional - Market size and forecast (2023-2028)
      • Chart on Conventional - Market size and forecast (2023-2028) ($ million)
      • Data Table on Conventional - Market size and forecast (2023-2028) ($ million)
      • Chart on Conventional - Year-over-year growth (2023-2028) (%)
      • Data Table on Conventional - Year-over-year growth (2023-2028) (%)
    • 9.5 Market opportunity by Source
      • Market opportunity by Source ($ million)
      • Data Table on Market opportunity by Source ($ million)

    10 Market Segmentation by Distribution Channel

    • 10.1 Market segments
      • Chart on Distribution Channel - Market share (2023-2028) (%)
      • Data Table on Distribution Channel - Market share (2023-2028) (%)
    • 10.2 Comparison by Distribution Channel
      • Chart on Comparison by Distribution Channel
      • Data Table on Comparison by Distribution Channel
    • 10.3 Supermarkets/Hypermarkets - Market size and forecast (2023-2028)
      • Chart on Supermarkets/Hypermarkets - Market size and forecast (2023-2028) ($ million)
      • Data Table on Supermarkets/Hypermarkets - Market size and forecast (2023-2028) ($ million)
      • Chart on Supermarkets/Hypermarkets - Year-over-year growth (2023-2028) (%)
      • Data Table on Supermarkets/Hypermarkets - Year-over-year growth (2023-2028) (%)
    • 10.4 Convenience Stores - Market size and forecast (2023-2028)
      • Chart on Convenience Stores - Market size and forecast (2023-2028) ($ million)
      • Data Table on Convenience Stores - Market size and forecast (2023-2028) ($ million)
      • Chart on Convenience Stores - Year-over-year growth (2023-2028) (%)
      • Data Table on Convenience Stores - Year-over-year growth (2023-2028) (%)
    • 10.5 Online - Market size and forecast (2023-2028)
      • Chart on Online - Market size and forecast (2023-2028) ($ million)
      • Data Table on Online - Market size and forecast (2023-2028) ($ million)
      • Chart on Online - Year-over-year growth (2023-2028) (%)
      • Data Table on Online - Year-over-year growth (2023-2028) (%)
    • 10.6 Others - Market size and forecast (2023-2028)
      • Chart on Others - Market size and forecast (2023-2028) ($ million)
      • Data Table on Others - Market size and forecast (2023-2028) ($ million)
      • Chart on Others - Year-over-year growth (2023-2028) (%)
      • Data Table on Others - Year-over-year growth (2023-2028) (%)
    • 10.7 Market opportunity by Distribution Channel
      • Market opportunity by Distribution Channel ($ million)
      • Data Table on Market opportunity by Distribution Channel ($ million)

    11 Customer Landscape

    • 11.1 Customer landscape overview
      • Analysis of price sensitivity, lifecycle, customer purchase basket, adoption rates, and purchase criteria

    12 Geographic Landscape

    • 12.1 Geographic segmentation
      • Chart on Market share by geography 2023-2028 (%)
      • Data Table on Market share by geography 2023-2028 (%)
    • 12.2 Geographic comparison
      • Chart on Geographic comparison
      • Data Table on Geographic comparison
    • 12.3 APAC - Market size and forecast 2023-2028
      • Chart on APAC - Market size and forecast 2023-2028 ($ million)
      • Data Table on APAC - Market size and forecast 2023-2028 ($ million)
      • Chart on APAC - Year-over-year growth 2023-2028 (%)
      • Data Table on APAC - Year-over-year growth 2023-2028 (%)
    • 12.4 Europe - Market size and forecast 2023-2028
      • Chart on Europe - Market size and forecast 2023-2028 ($ million)
      • Data Table on Europe - Market size and forecast 2023-2028 ($ million)
      • Chart on Europe - Year-over-year growth 2023-2028 (%)
      • Data Table on Europe - Year-over-year growth 2023-2028 (%)
    • 12.5 North America - Market size and forecast 2023-2028
      • Chart on North America - Market size and forecast 2023-2028 ($ million)
      • Data Table on North America - Market size and forecast 2023-2028 ($ million)
      • Chart on North America - Year-over-year growth 2023-2028 (%)
      • Data Table on North America - Year-over-year growth 2023-2028 (%)
    • 12.6 South America - Market size and forecast 2023-2028
      • Chart on South America - Market size and forecast 2023-2028 ($ million)
      • Data Table on South America - Market size and forecast 2023-2028 ($ million)
      • Chart on South America - Year-over-year growth 2023-2028 (%)
      • Data Table on South America - Year-over-year growth 2023-2028 (%)
    • 12.7 Middle East and Africa - Market size and forecast 2023-2028
      • Chart on Middle East and Africa - Market size and forecast 2023-2028 ($ million)
      • Data Table on Middle East and Africa - Market size and forecast 2023-2028 ($ million)
      • Chart on Middle East and Africa - Year-over-year growth 2023-2028 (%)
      • Data Table on Middle East and Africa - Year-over-year growth 2023-2028 (%)
    • 12.8 India - Market size and forecast 2023-2028
      • Chart on India - Market size and forecast 2023-2028 ($ million)
      • Data Table on India - Market size and forecast 2023-2028 ($ million)
      • Chart on India - Year-over-year growth 2023-2028 (%)
      • Data Table on India - Year-over-year growth 2023-2028 (%)
    • 12.9 US - Market size and forecast 2023-2028
      • Chart on US - Market size and forecast 2023-2028 ($ million)
      • Data Table on US - Market size and forecast 2023-2028 ($ million)
      • Chart on US - Year-over-year growth 2023-2028 (%)
      • Data Table on US - Year-over-year growth 2023-2028 (%)
    • 12.10 Thailand - Market size and forecast 2023-2028
      • Chart on Thailand - Market size and forecast 2023-2028 ($ million)
      • Data Table on Thailand - Market size and forecast 2023-2028 ($ million)
      • Chart on Thailand - Year-over-year growth 2023-2028 (%)
      • Data Table on Thailand - Year-over-year growth 2023-2028 (%)
    • 12.11 France - Market size and forecast 2023-2028
      • Chart on France - Market size and forecast 2023-2028 ($ million)
      • Data Table on France - Market size and forecast 2023-2028 ($ million)
      • Chart on France - Year-over-year growth 2023-2028 (%)
      • Data Table on France - Year-over-year growth 2023-2028 (%)
    • 12.12 Indonesia - Market size and forecast 2023-2028
      • Chart on Indonesia - Market size and forecast 2023-2028 ($ million)
      • Data Table on Indonesia - Market size and forecast 2023-2028 ($ million)
      • Chart on Indonesia - Year-over-year growth 2023-2028 (%)
      • Data Table on Indonesia - Year-over-year growth 2023-2028 (%)
    • 12.13 Market opportunity by geography
      • Market opportunity by geography ($ million)
      • Data Tables on Market opportunity by geography ($ million)
    • 12.14 Canada - Market size and forecast (2023-2028)
      • Chart on Canada - Market size and forecast (2023-2028) ($ million)
      • Data Table on Canada - Market size and forecast (2023-2028) ($ million)
      • Chart on Canada - Year-over-year growth (2023-2028) (%)
      • Data Table on Canada - Year-over-year growth (2023-2028) (%)
    • 12.15 Germany - Market size and forecast (2023-2028)
      • Chart on Germany - Market size and forecast (2023-2028) ($ million)
      • Data Table on Germany - Market size and forecast (2023-2028) ($ million)
      • Chart on Germany - Year-over-year growth (2023-2028) (%)
      • Data Table on Germany - Year-over-year growth (2023-2028) (%)
    • 12.16 UK - Market size and forecast (2023-2028)
      • Chart on UK - Market size and forecast (2023-2028) ($ million)
      • Data Table on UK - Market size and forecast (2023-2028) ($ million)
      • Chart on UK - Year-over-year growth (2023-2028) (%)
      • Data Table on UK - Year-over-year growth (2023-2028) (%)
    • 12.17 Italy - Market size and forecast (2023-2028)
      • Chart on Italy - Market size and forecast (2023-2028) ($ million)
      • Data Table on Italy - Market size and forecast (2023-2028) ($ million)
      • Chart on Italy - Year-over-year growth (2023-2028) (%)
      • Data Table on Italy - Year-over-year growth (2023-2028) (%)
    • 12.18 China - Market size and forecast (2023-2028)
      • Chart on China - Market size and forecast (2023-2028) ($ million)
      • Data Table on China - Market size and forecast (2023-2028) ($ million)
      • Chart on China - Year-over-year growth (2023-2028) (%)
      • Data Table on China - Year-over-year growth (2023-2028) (%)
    • 12.19 Japan - Market size and forecast (2023-2028)
      • Chart on Japan - Market size and forecast (2023-2028) ($ million)
      • Data Table on Japan - Market size and forecast (2023-2028) ($ million)
      • Chart on Japan - Year-over-year growth (2023-2028) (%)
      • Data Table on Japan - Year-over-year growth (2023-2028) (%)
    • 12.20 Brazil - Market size and forecast (2023-2028)
      • Chart on Brazil - Market size and forecast (2023-2028) ($ million)
      • Data Table on Brazil - Market size and forecast (2023-2028) ($ million)
      • Chart on Brazil - Year-over-year growth (2023-2028) (%)
      • Data Table on Brazil - Year-over-year growth (2023-2028) (%)
    • 12.21 Egypt - Market size and forecast (2023-2028)
      • Chart on Egypt - Market size and forecast (2023-2028) ($ million)
      • Data Table on Egypt - Market size and forecast (2023-2028) ($ million)
      • Chart on Egypt - Year-over-year growth (2023-2028) (%)
      • Data Table on Egypt - Year-over-year growth (2023-2028) (%)
    • 12.22 UAE - Market size and forecast (2023-2028)
      • Chart on UAE - Market size and forecast (2023-2028) ($ million)
      • Data Table on UAE - Market size and forecast (2023-2028) ($ million)
      • Chart on UAE - Year-over-year growth (2023-2028) (%)
      • Data Table on UAE - Year-over-year growth (2023-2028) (%)
    • 12.23 Oman - Market size and forecast (2023-2028)
      • Chart on Oman - Market size and forecast (2023-2028) ($ million)
      • Data Table on Oman - Market size and forecast (2023-2028) ($ million)
      • Chart on Oman - Year-over-year growth (2023-2028) (%)
      • Data Table on Oman - Year-over-year growth (2023-2028) (%)
    • 12.24 Argentina - Market size and forecast (2023-2028)
      • Chart on Argentina - Market size and forecast (2023-2028) ($ million)
      • Data Table on Argentina - Market size and forecast (2023-2028) ($ million)
      • Chart on Argentina - Year-over-year growth (2023-2028) (%)
      • Data Table on Argentina - Year-over-year growth (2023-2028) (%)
    • 12.25 KSA - Market size and forecast (2023-2028)
      • Chart on KSA - Market size and forecast (2023-2028) ($ million)
      • Data Table on KSA - Market size and forecast (2023-2028) ($ million)
      • Chart on KSA - Year-over-year growth (2023-2028) (%)
      • Data Table on KSA - Year-over-year growth (2023-2028) (%)
    • 12.26 Rest of World (ROW) - Market size and forecast (2023-2028)
      • Chart on Rest of World (ROW) - Market size and forecast (2023-2028) ($ million)
      • Data Table on Rest of World (ROW) - Market size and forecast (2023-2028) ($ million)
      • Chart on Rest of World (ROW) - Year-over-year growth (2023-2028) (%)
      • Data Table on Rest of World (ROW) - Year-over-year growth (2023-2028) (%)

    13 Drivers, Challenges, and Opportunity/Restraints

    • 13.1 Market drivers
      • 13.2 Market challenges
        • 13.3 Impact of drivers and challenges
          • Impact of drivers and challenges in 2023 and 2028
        • 13.4 Market opportunities/restraints

          14 Competitive Landscape

          • 14.1 Overview
            • 14.2 Competitive Landscape
              • Overview on criticality of inputs and factors of differentiation
            • 14.3 Landscape disruption
              • Overview on factors of disruption
            • 14.4 Industry risks
              • Impact of key risks on business

            15 Competitive Analysis

            • 15.1 Companies profiled
              • Companies covered
            • 15.2 Market positioning of companies
              • Matrix on companies position and classification
            • 15.3 American Key Products Inc.
              • American Key Products Inc. - Overview
              • American Key Products Inc. - Product / Service
              • American Key Products Inc. - Key news
              • American Key Products Inc. - Key offerings
            • 15.4 Authentic Foods
              • Authentic Foods - Overview
              • Authentic Foods - Product / Service
              • Authentic Foods - Key offerings
            • 15.5 Cargill Inc.
              • Cargill Inc. - Overview
              • Cargill Inc. - Product / Service
              • Cargill Inc. - Key news
              • Cargill Inc. - Key offerings
            • 15.6 Ciranda Inc.
              • Ciranda Inc. - Overview
              • Ciranda Inc. - Product / Service
              • Ciranda Inc. - Key news
              • Ciranda Inc. - Key offerings
            • 15.7 Ekta International
              • Ekta International - Overview
              • Ekta International - Product / Service
              • Ekta International - Key offerings
            • 15.8 Emsland Starke GmbH
              • Emsland Starke GmbH - Overview
              • Emsland Starke GmbH - Product / Service
              • Emsland Starke GmbH - Key news
              • Emsland Starke GmbH - Key offerings
            • 15.9 Hunan Kang pharmaceutical Ltd.
              • Hunan Kang pharmaceutical Ltd. - Overview
              • Hunan Kang pharmaceutical Ltd. - Product / Service
              • Hunan Kang pharmaceutical Ltd. - Key offerings
            • 15.10 Ingredion Inc.
              • Ingredion Inc. - Overview
              • Ingredion Inc. - Business segments
              • Ingredion Inc. - Key news
              • Ingredion Inc. - Key offerings
              • Ingredion Inc. - Segment focus
            • 15.11 KengSeng Group of Co.
              • KengSeng Group of Co. - Overview
              • KengSeng Group of Co. - Product / Service
              • KengSeng Group of Co. - Key offerings
            • 15.12 Parchem Fine and Specialty Chemicals Inc.
              • Parchem Fine and Specialty Chemicals Inc. - Overview
              • Parchem Fine and Specialty Chemicals Inc. - Product / Service
              • Parchem Fine and Specialty Chemicals Inc. - Key offerings
            • 15.13 PT Budi Starch and Sweetener Tbk
              • PT Budi Starch and Sweetener Tbk - Overview
              • PT Budi Starch and Sweetener Tbk - Product / Service
              • PT Budi Starch and Sweetener Tbk - Key offerings
            • 15.14 Royal Ingredients Group BV
              • Royal Ingredients Group BV - Overview
              • Royal Ingredients Group BV - Product / Service
              • Royal Ingredients Group BV - Key offerings
            • 15.15 Sonish Starch Technology Co. Ltd.
              • Sonish Starch Technology Co. Ltd. - Overview
              • Sonish Starch Technology Co. Ltd. - Product / Service
              • Sonish Starch Technology Co. Ltd. - Key offerings
            • 15.16 SPAC Starch Products India Pvt. Ltd.
              • SPAC Starch Products India Pvt. Ltd. - Overview
              • SPAC Starch Products India Pvt. Ltd. - Product / Service
              • SPAC Starch Products India Pvt. Ltd. - Key offerings
            • 15.17 Tapioca Vietnam
              • Tapioca Vietnam - Overview
              • Tapioca Vietnam - Product / Service
              • Tapioca Vietnam - Key offerings

            16 Appendix

            • 16.1 Scope of the report
              • 16.2 Inclusions and exclusions checklist
                • Inclusions checklist
                • Exclusions checklist
              • 16.3 Currency conversion rates for US$
                • Currency conversion rates for US$
              • 16.4 Research methodology
                • Research methodology
              • 16.5 Data procurement
                • Information sources
              • 16.6 Data validation
                • Data validation
              • 16.7 Validation techniques employed for market sizing
                • Validation techniques employed for market sizing
              • 16.8 Data synthesis
                • Data synthesis
              • 16.9 360 degree market analysis
                • 360 degree market analysis
              • 16.10 List of abbreviations
                • List of abbreviations

              Research Methodology

              Technavio presents a detailed picture of the market by way of study, synthesis, and summation of data from multiple sources. The analysts have presented the various facets of the market with a particular focus on identifying the key industry influencers. The data thus presented is comprehensive, reliable, and the result of extensive research, both primary and secondary.

              INFORMATION SOURCES

              Primary sources

              • Manufacturers and suppliers
              • Channel partners
              • Industry experts
              • Strategic decision makers

              Secondary sources

              • Industry journals and periodicals
              • Government data
              • Financial reports of key industry players
              • Historical data
              • Press releases

              DATA ANALYSIS

              Data Synthesis

              • Collation of data
              • Estimation of key figures
              • Analysis of derived insights

              Data Validation

              • Triangulation with data models
              • Reference against proprietary databases
              • Corroboration with industry experts

              REPORT WRITING

              Qualitative

              • Market drivers
              • Market challenges
              • Market trends
              • Five forces analysis

              Quantitative

              • Market size and forecast
              • Market segmentation
              • Geographical insights
              • Competitive landscape

              Interested in this report?

              Get your sample now to see our research methodology and insights!

              Download Now

              Frequently Asked Questions

              Tapioca market growth will increase by $ 44.2 mn during 2024-2028 .

              The Tapioca market is expected to grow at a CAGR of 4.42% during 2024-2028 .

              Tapioca market is segmented by Application( Animal feed, Food and beverage, Industrial) Type( Fresh, Dried, North America, South Africa, MEA)

              American Key Products Inc., Authentic Foods, Cargill Inc., Ciranda Inc., Ekta International, Emsland Starke GmbH, Hunan Kang pharmaceutical Ltd., Ingredion Inc., Jayavel Sago Factory, KengSeng Group of Co., Malt Products Corp., Parchem Fine and Specialty Chemicals Inc., PT Budi Starch and Sweetener Tbk, Royal Ingredients Group BV, Sonish Starch Technology Co. Ltd., SPAC Starch Products India Pvt. Ltd., Tapioca Vietnam, Tate and Lyle PLC, Tereos Participations, Venus Starch Suppliers are a few of the key vendors in the Tapioca market.

              APAC will register the highest growth rate of 53% among the other regions. Therefore, the Tapioca market in APAC is expected to garner significant business opportunities for the vendors during the forecast period.

              US, Canada, Germany, UK, Italy, France, China, India, Japan, Brazil, Egypt, UAE, Oman, Argentina, KSA, UAE, Brazil, Rest of World (ROW)

              • Alternative to gluten and grain food productsGluten is a mixture of proteins present in wheat and other related grains like oat is the driving factor this market.
              • rye is the driving factor this market.
              • barley is the driving factor this market.
              • and kamut. Many consumers have gluten intolerance and wheat allergy. Wheat allergy is caused either by consuming wheat-containing products or sometimes by inhaling wheat flour; the human body generates an antibody to the protein that is present in wheat. It is found mostly among children. Gluten intolerance is caused due to an abnormal immune reaction to gluten. It affects the small intestine and causes malnutrition and other digestive problems. Wheat is usually used in baking is the driving factor this market.
              • where gluten provides the required elasticity to the dough. Various starches are used to make gluten-free baked products. They are used in most baking recipes to mimic gluten-filled results. Thus is the driving factor this market.
              • most gluten-free flour blends and mixtures contain starch as one of the key elements. Tapioca is used to make baked products tough is the driving factor this market.
              • dry is the driving factor this market.
              • and brown. Usually is the driving factor this market.
              • light starch is substituted with potato starch or tapioca. Potato starch does not brown the dough is the driving factor this market.
              • but tapioca does. Thus is the driving factor this market.
              • it is preferred over potato starch. In some cases is the driving factor this market.
              • both starches are mixed to give the dish the desired softness and golden (brown) color. Tapioca is also used as a thickening agent. Tapioca flour is gluten-free and nut-free and has low sugar content. Thus is the driving factor this market.
              • it is one of the healthiest substitutes for gluten flour. It has a mild sweet taste. It is used in making puddings is the driving factor this market.
              • mousse is the driving factor this market.
              • jelly is the driving factor this market.
              • yogurts is the driving factor this market.
              • and sauces. It is also used to make crusts is the driving factor this market.
              • cakes is the driving factor this market.
              • chips is the driving factor this market.
              • flatbread is the driving factor this market.
              • and tortillas. Thus is the driving factor this market.
              • tapioca flour can substitute all-purpose flour is the driving factor this market.
              • wheat flour is the driving factor this market.
              • and nut-based flour. It is suitable for people who have digestive issues. As it has fewer calories and low protein and sugar content is the driving factor this market.
              • it helps in weight management. Therefore is the driving factor this market.
              • tapioca serves as a great alternative to gluten and grain food products is the driving factor this market.
              • which will contribute significantly to the growth of the global tapioca market during the forecast period. is the driving factor this market.

              The Tapioca market vendors should focus on grabbing business opportunities from the Animal feed segment as it accounted for the largest market share in the base year.