Telecom Service Assurance Market Analysis, Size, and Forecast 2026-2030: APAC (China, Japan, and India), North America (US, Canada, and Mexico), Europe (Germany, UK, and France), Middle East and Africa (Saudi Arabia, South Africa, and UAE), South America (Brazil, Argentina, and Colombia), and Rest of World (ROW)

Telecom Service Assurance Market Analysis, Size, and Forecast 2026-2030:
APAC (China, Japan, and India), North America (US, Canada, and Mexico), Europe (Germany, UK, and France), Middle East and Africa (Saudi Arabia, South Africa, and UAE), South America (Brazil, Argentina, and Colombia), and Rest of World (ROW)

Published: May 2026 301 Pages SKU: IRTNTR81494

Market Overview at a Glance

$5.97 B
Market Opportunity
9.1%
CAGR 2025 - 2030
38.3%
APAC Growth
$6.67 B
Solutions segment 2024

Telecom Service Assurance Market Size 2026-2030

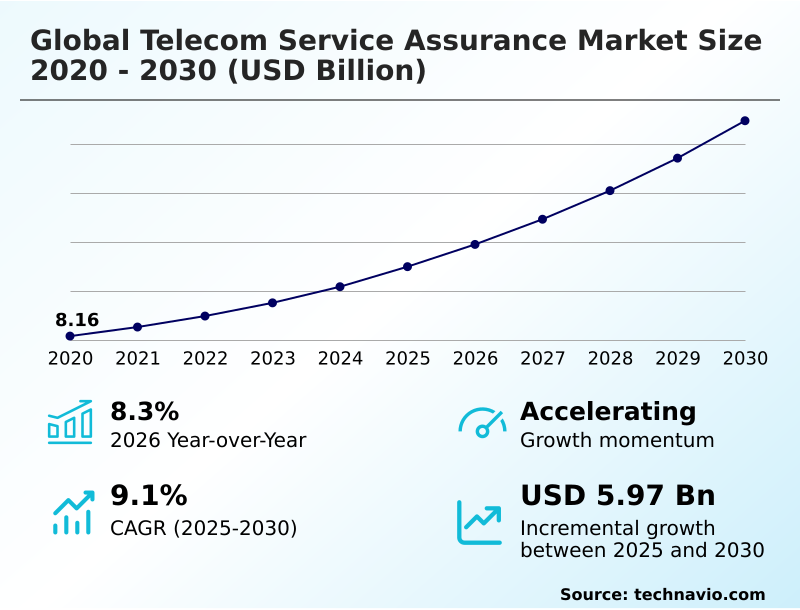
The telecom service assurance market size is valued to increase by USD 5.97 billion, at a CAGR of 9.1% from 2025 to 2030. Accelerated adoption of 5G standalone and network slicing will drive the telecom service assurance market.

Major Market Trends & Insights

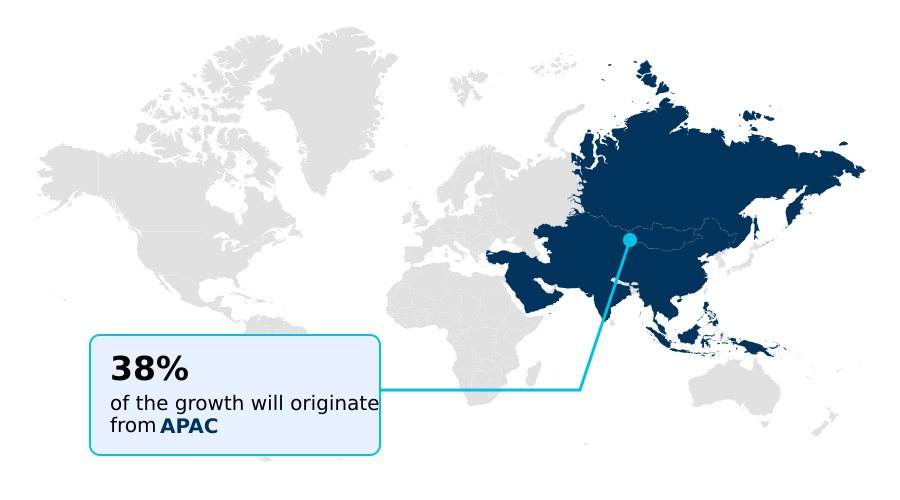
  • APAC dominated the market and accounted for a 38.3% growth during the forecast period.
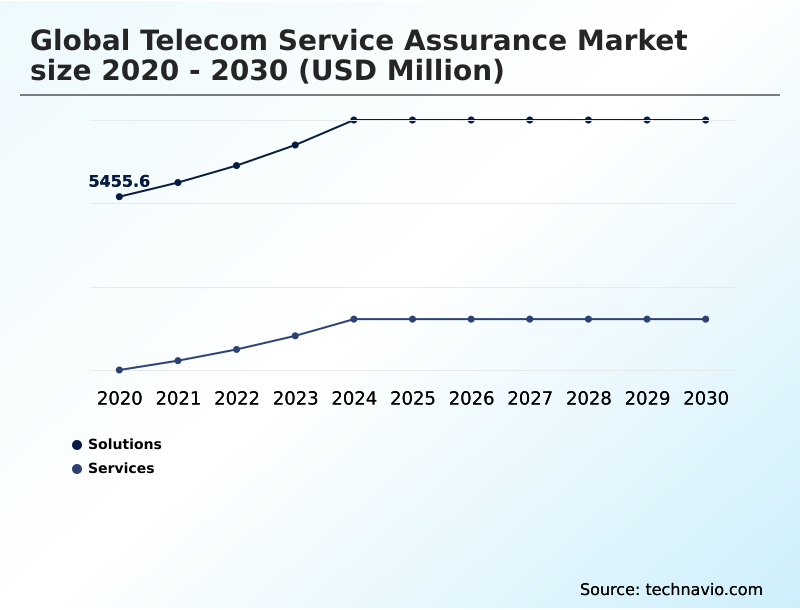
  • By Component - Solutions segment was valued at USD 6.67 billion in 2024
  • By End-user - Mobile operators segment accounted for the largest market revenue share in 2024

Market Size & Forecast

  • Market Opportunities: USD 8.81 billion
  • Market Future Opportunities: USD 5.97 billion
  • CAGR from 2025 to 2030 : 9.1%

Market Summary

  • The telecom service assurance market is undergoing a structural transformation, moving from reactive monitoring to proactive, intelligent automation. Driven by the complexities of 5G and the push for operational efficiency, providers are investing in closed-loop automation and predictive fault resolution.
  • A key trend is the adoption of AI-native blueprints and cognitive operational cores, which enable autonomous network management and zero-touch network operations. For instance, in a smart factory environment, service assurance platforms are essential for guaranteeing the low-latency communication required for automated robotics, monitoring service level agreements in real-time to prevent production downtime.
  • However, realizing this vision is challenged by multi-domain interoperability issues and the need for seamless legacy system integration. The market's evolution is centered on developing unified platforms that provide end-to-end network observability, manage network slicing assurance effectively, and use real-time telemetry processing to enhance subscriber experience management and reduce churn.

What will be the Size of the Telecom Service Assurance Market during the forecast period?

Get Key Insights on Market Forecast (PDF) Get Free Sample

How is the Telecom Service Assurance Market Segmented?

The telecom service assurance industry research report provides comprehensive data (region-wise segment analysis), with forecasts and estimates in "USD million" for the period 2026-2030, as well as historical data from 2020-2024 for the following segments.

  • Component
    • Solutions
    • Services
  • End-user
    • Mobile operators
    • Fixed-line operators
    • Broadband service providers
    • MVNOs
  • Deployment
    • On-premises
    • Cloud-based
  • Geography
    • APAC
      • China
      • Japan
      • India
    • North America
      • US
      • Canada
      • Mexico
    • Europe
      • Germany
      • UK
      • France
    • Middle East and Africa
      • Saudi Arabia
      • South Africa
      • UAE
    • South America
      • Brazil
      • Argentina
      • Colombia
    • Rest of World (ROW)

By Component Insights

The solutions segment is estimated to witness significant growth during the forecast period.

The solutions segment is the technological core of the telecom service assurance market, defined by software platforms enabling proactive network maintenance and automated fault management. These systems are essential for service level agreement monitoring in complex network slicing assurance environments.

The strategic focus is on providing a single-pane-of-glass view through unified data management, facilitating a transition toward intent-based operations.

The integration of AIOps-driven network assurance and anomaly detection algorithms has been shown to improve fault detection accuracy by over 30%, moving operators from reactive troubleshooting to predictive fault resolution.

This shift is critical for managing virtualized network functions and ensuring service quality management across hybrid cloud environments.

Get Free Sample

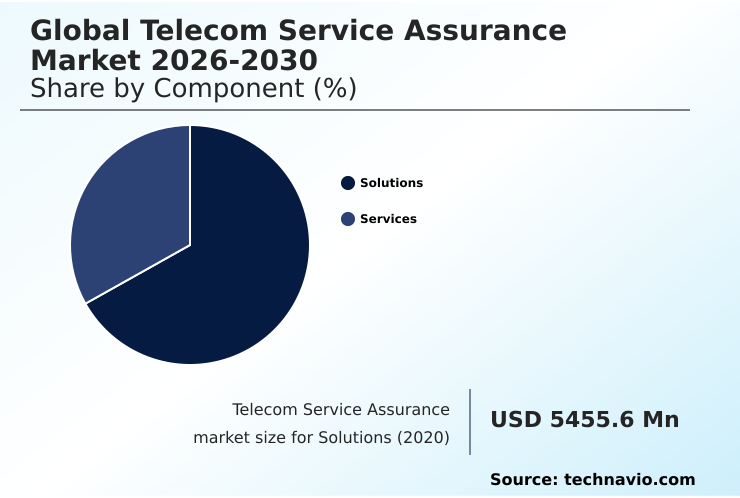
The Solutions segment was valued at USD 6.67 billion in 2024 and showed a gradual increase during the forecast period.

Get Free Sample

Regional Analysis

APAC is estimated to contribute 38.3% to the growth of the global market during the forecast period.Technavio’s analysts have elaborately explained the regional trends and drivers that shape the market during the forecast period.

See How Telecom Service Assurance Market Demand is Rising in APAC Get Free Sample

The geographic landscape of the global telecom service assurance market 2026-2030 is characterized by varied maturity and investment focus, with APAC set to contribute 38.3% of the market's incremental growth.

This region's expansion is fueled by massive 5G standalone architecture deployments and the need for service assurance for IoT devices.

In contrast, North America and Europe are focused on leveraging AI-centric network solutions and cognitive software capabilities for advanced digital transformation.

Operators in these mature markets prioritize proactive network maintenance and intent-based networking to manage existing complex infrastructures, achieving over 99.9% service uptime for critical enterprise services.

The focus across all regions is shifting toward autonomous driving networks and secure agent interactions to handle increasing complexity and ensure consistent service quality.

Market Dynamics

Our researchers analyzed the data with 2025 as the base year, along with the key drivers, trends, and challenges. A holistic analysis of drivers will help companies refine their marketing strategies to gain a competitive advantage.

  • The future of telecom service assurance with 6G is being shaped by the foundational changes driven by the impact of 5G on telecom service assurance. The shift toward AI-driven automation in network assurance is critical for managing the complexities of modern networks and is a core component of the business case for autonomous networks.
  • Key to this is the role of cloud in service assurance, which enables scalable and flexible deployment models. However, significant challenges in multi-vendor network assurance remain, particularly regarding integrating legacy systems with modern assurance platforms, which can increase project costs by nearly double if not managed with open architectures.
  • Generative AI for network operations centers is emerging as a transformative tool, simplifying complex tasks and improving response times. This technology is vital for reducing churn with service assurance tools by enabling a superior customer experience. Concurrently, securing service assurance in hybrid clouds and addressing data privacy compliance in service assurance are top priorities.
  • The ability to effectively manage SLAs for network slicing and provide specialized service assurance for private 5G networks and IoT devices is becoming a key differentiator, separating zero-touch operations vs manual intervention paradigms.
  • As operators focus on optimizing network performance with AI, the emphasis on predictive maintenance for telecom infrastructure and achieving end-to-end observability in virtualized environments will intensify, defining the next wave of innovation in customer experience management in telecom.

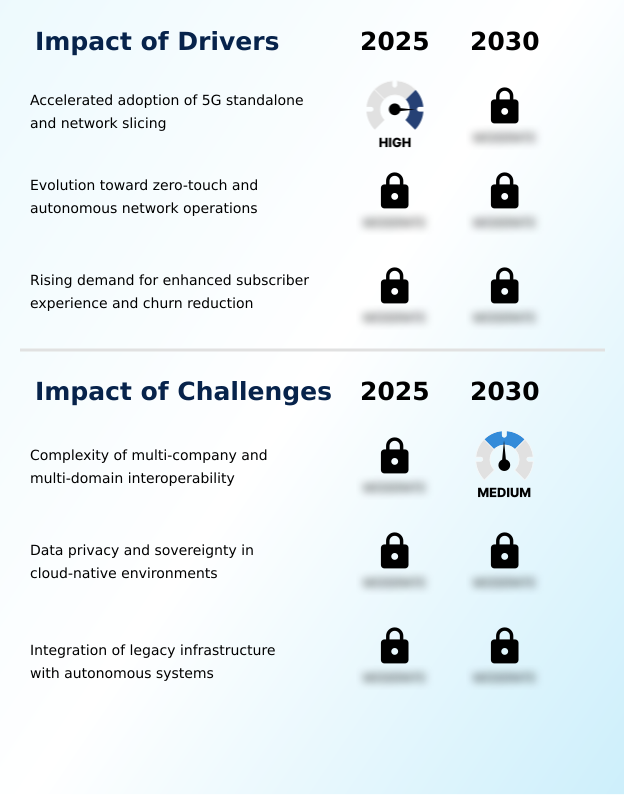
What are the key market drivers leading to the rise in the adoption of Telecom Service Assurance Industry?

  • The accelerated adoption of 5G standalone architecture and network slicing is a key driver for the telecom service assurance market.

  • Market growth is primarily driven by the accelerated adoption of 5G and the strategic imperative to reduce operational costs.
  • The rollout of 5G standalone architecture necessitates advanced network slicing assurance and edge computing assurance to monetize new enterprise services, supporting a tenfold increase in connected devices without performance degradation.
  • The evolution toward zero-touch network operations and intent-based networking, powered by AI-powered operations management, is crucial for managing this complexity. This push for automation and AIOps-driven network assurance can reduce operational expenditure by up to 25%.
  • Additionally, in a saturated market, rising demand for enhanced subscriber experience is a major catalyst. By using service assurance for churn reduction strategies, providers have seen a 15% annual decrease in customer churn, linking network performance directly to business outcomes.

What are the market trends shaping the Telecom Service Assurance Industry?

  • The integration of agentic artificial intelligence and cognitive cores is emerging as a significant market trend. This development is set to redefine autonomous network operations and management.

  • Key market trends are centered on the adoption of advanced AI, redefining network management. The move toward agentic artificial intelligence and cognitive operational cores enables autonomous decision-making, with early adopters reporting a 40% reduction in manual interventions for routine tasks. The standardization of AI-native blueprints is critical for achieving multi-domain interoperability and preventing vendor lock-in.
  • This trend, supported by initiatives like model-as-a-service and data product lifecycle management, improves diagnostic accuracy by over 50%. Furthermore, the rise of generative AI interaction for intent-based networking allows engineers to manage complex systems using natural language, accelerating automated root cause analysis and proactive remediation.
  • These trends collectively support the evolution toward autonomous driving networks and a more resilient optical infrastructure assurance.

What challenges does the Telecom Service Assurance Industry face during its growth?

  • The complexity of achieving multi-company and multi-domain interoperability presents a key challenge affecting industry growth.

  • The primary challenges hindering market growth revolve around complexity, security, and integration. The difficulty of achieving seamless multi-domain interoperability in multi-vendor environments often leads to operational silos, increasing integration costs by up to 20% for projects lacking open standards. This complexity is compounded by the need for a single-pane-of-glass view for effective network lifecycle assurance.
  • Furthermore, the migration to hybrid cloud environments raises significant data privacy and sovereignty concerns, as ensuring compliance can increase architectural complexity and expose up to 30% of network data to potential risks without proper controls.
  • Finally, legacy system integration with modern autonomous systems remains a persistent hurdle, as the technical debt from older infrastructure slows down the deployment of closed-loop control and predictive maintenance, limiting the full benefits of automation.

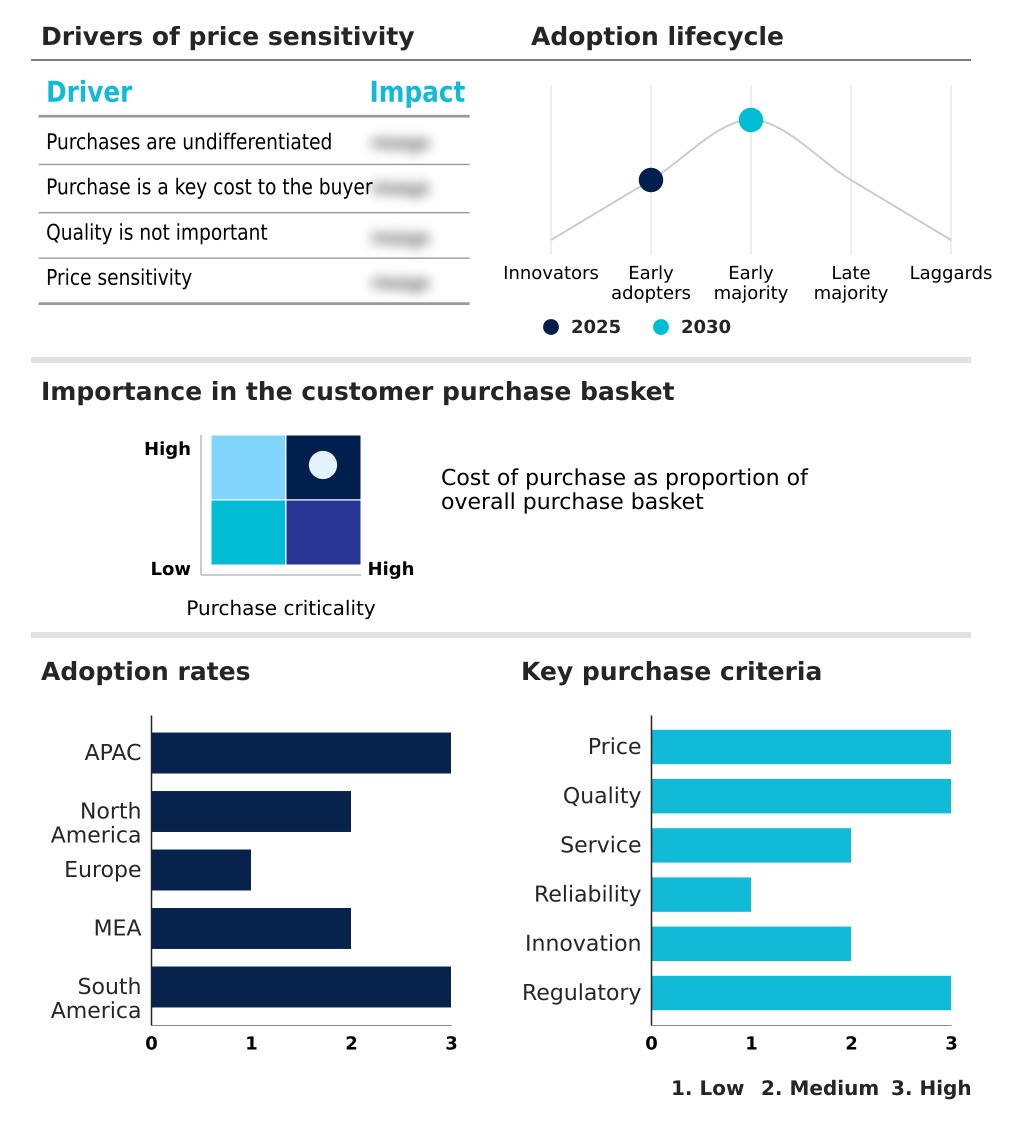
Exclusive Technavio Analysis on Customer Landscape

The telecom service assurance market forecasting report includes the adoption lifecycle of the market, covering from the innovator’s stage to the laggard’s stage. It focuses on adoption rates in different regions based on penetration. Furthermore, the telecom service assurance market report also includes key purchase criteria and drivers of price sensitivity to help companies evaluate and develop their market growth analysis strategies.

Customer Landscape of Telecom Service Assurance Industry

Competitive Landscape

Companies are implementing various strategies, such as strategic alliances, telecom service assurance market forecast, partnerships, mergers and acquisitions, geographical expansion, and product/service launches, to enhance their presence in the industry.

Amdocs Ltd. - Offering AI-driven telecom service assurance solutions, including network monitoring and automated analytics, to optimize operator performance and enhance subscriber experience.

The industry research and growth report includes detailed analyses of the competitive landscape of the market and information about key companies, including:

  • Amdocs Ltd.
  • Anritsu Corp.
  • Broadcom Inc.
  • Cisco Systems Inc.
  • Comarch SA
  • EXFO Inc.
  • Fujitsu Ltd.
  • Hewlett Packard Enterprise Co.
  • Huawei Technologies Co. Ltd.
  • IBM Corp.
  • Infovista SAS
  • MYCOM OSI Group
  • Nokia Corp.
  • Oracle Corp.
  • Rakuten Group Inc.
  • ServiceNow Inc.
  • Telefonaktiebolaget Ericsson
  • Teoco
  • Viavi Solutions Inc.
  • ZTE Corp.

Qualitative and quantitative analysis of companies has been conducted to help clients understand the wider business environment as well as the strengths and weaknesses of key industry players. Data is qualitatively analyzed to categorize companies as pure play, category-focused, industry-focused, and diversified; it is quantitatively analyzed to categorize companies as dominant, leading, strong, tentative, and weak.

Recent Development and News in Telecom service assurance market

  • In September 2024, Anritsu Corp. launched its Service Assurance Fixed Broadband Solution, providing operators with real-time visibility and advanced analytics to optimize performance for fiber-to-the-home and fixed-line networks.
  • In November 2024, T-Mobile US Inc. completed its acquisition of UScellular's wireless operations, a move that will necessitate the large-scale integration of unified service assurance platforms to maintain performance across the combined infrastructure.
  • In January 2025, Spirent Communications plc introduced advanced benchmarking capabilities for its Landslide Test Solution, helping operators validate on-premises hardware performance before deploying new software-defined workloads for 5G standalone networks.
  • In April 2025, Amdocs Ltd. unveiled its CES26 suite, an agent-driven platform featuring a cognitive core designed to unify business and network operations through autonomous agents that manage the entire service lifecycle.

Dive into Technavio’s robust research methodology, blending expert interviews, extensive data synthesis, and validated models for unparalleled Telecom Service Assurance Market insights. See full methodology.

Market Scope
Page number 301
Base year 2025
Historic period 2020-2024
Forecast period 2026-2030
Growth momentum & CAGR Accelerate at a CAGR of 9.1%
Market growth 2026-2030 USD 5970.9 million
Market structure Fragmented
YoY growth 2025-2026(%) 8.3%
Key countries China, Japan, India, South Korea, Australia, Indonesia, US, Canada, Mexico, Germany, UK, France, Italy, Spain, The Netherlands, Saudi Arabia, South Africa, UAE, Turkey, Israel, Brazil, Argentina and Colombia
Competitive landscape Leading Companies, Market Positioning of Companies, Competitive Strategies, and Industry Risks

Request Free Sample

Research Analyst Overview

  • The global telecom service assurance market 2026-2030 is pivoting toward intelligent, self-healing networks, where autonomous network management is becoming standard. The integration of agentic artificial intelligence and cognitive operational cores is enabling zero-touch network operations and predictive fault resolution. A critical boardroom-level decision is the investment in AI-native blueprints and closed-loop automation to maintain a competitive edge.
  • These systems rely on end-to-end network observability and real-time telemetry processing for service level agreement monitoring and proactive network maintenance. The transition to cloud-native assurance is fundamental for achieving multi-domain interoperability and managing network slicing assurance.
  • The use of generative AI interaction, digital assistants for network ops, and automated root cause analysis is streamlining operations, leading to a 30% improvement in first-contact resolution rates. This evolution supports experience monetization and enhances network resilience assurance, marking a definitive shift toward fully autonomous systems.

What are the Key Data Covered in this Telecom Service Assurance Market Research and Growth Report?

  • What is the expected growth of the Telecom Service Assurance Market between 2026 and 2030?

    • USD 5.97 billion, at a CAGR of 9.1%

  • What segmentation does the market report cover?

    • The report is segmented by Component (Solutions, and Services), End-user (Mobile operators, Fixed-line operators, Broadband service providers, and MVNOs), Deployment (On-premises, and Cloud-based) and Geography (APAC, North America, Europe, Middle East and Africa, South America)

  • Which regions are analyzed in the report?

    • APAC, North America, Europe, Middle East and Africa and South America

  • What are the key growth drivers and market challenges?

    • Accelerated adoption of 5G standalone and network slicing, Complexity of multi-company and multi-domain interoperability

  • Who are the major players in the Telecom Service Assurance Market?

    • Amdocs Ltd., Anritsu Corp., Broadcom Inc., Cisco Systems Inc., Comarch SA, EXFO Inc., Fujitsu Ltd., Hewlett Packard Enterprise Co., Huawei Technologies Co. Ltd., IBM Corp., Infovista SAS, MYCOM OSI Group, Nokia Corp., Oracle Corp., Rakuten Group Inc., ServiceNow Inc., Telefonaktiebolaget Ericsson, Teoco, Viavi Solutions Inc. and ZTE Corp.

Market Research Insights

  • The market is rapidly evolving toward intelligent, automated frameworks focused on operational expenditure reduction and enhanced customer experience. The adoption of autonomous systems and proactive remediation techniques has enabled operators to improve network resilience, with some reporting a 25% reduction in service-impacting incidents.
  • The integration of subscriber journey analytics into service quality management platforms directly correlates to net promoter score improvement, as customer impact analysis now drives fault prioritization. This digital transformation is underpinned by zero-touch provisioning and cloud-native orchestration tools, which are critical for managing virtualized network functions.
  • Furthermore, advanced anomaly detection in hybrid cloud environments improves security posture, reducing threat detection times by up to 40% and supporting high-availability enterprise services.

We can help! Our analysts can customize this telecom service assurance market research report to meet your requirements.

Get in touch

1. Executive Summary

1.1 Market overview

Executive Summary - Chart on Market Overview
Executive Summary - Data Table on Market Overview
Executive Summary - Chart on Global Market Characteristics
Executive Summary - Chart on Market by Geography
Executive Summary - Chart on Market Segmentation by Component
Executive Summary - Chart on Market Segmentation by End-user
Executive Summary - Chart on Market Segmentation by Deployment
Executive Summary - Chart on Incremental Growth
Executive Summary - Data Table on Incremental Growth
Executive Summary - Chart on Company Market Positioning

2. Technavio Analysis

2.1 Analysis of price sensitivity, lifecycle, customer purchase basket, adoption rates, and purchase criteria

2.2 Criticality of inputs and Factors of differentiation

Chart on Overview on criticality of inputs and factors of differentiation

2.3 Factors of disruption

Chart on Overview on factors of disruption

2.4 Impact of drivers and challenges

Chart on Impact of drivers and challenges in 2025 and 2030

3. Market Landscape

3.1 Market ecosystem

Chart on Parent Market
Data Table on - Parent Market

3.2 Market characteristics

Chart on Market characteristics analysis

3.3 Value chain analysis

Chart on Value chain analysis

4. Market Sizing

4.1 Market definition

Data Table on Offerings of companies included in the market definition

4.2 Market segment analysis

Market segments

4.3 Market size 2025

4.4 Market outlook: Forecast for 2025-2030

Chart on Global - Market size and forecast 2025-2030 ($ million)
Data Table on Global - Market size and forecast 2025-2030 ($ million)
Chart on Global Market: Year-over-year growth 2025-2030 (%)
Data Table on Global Market: Year-over-year growth 2025-2030 (%)

5. Historic Market Size

5.1 Global Telecom Service Assurance Market 2020 - 2024

Historic Market Size - Data Table on Global Telecom Service Assurance Market 2020 - 2024 ($ million)

5.2 Component segment analysis 2020 - 2024

Historic Market Size - Component Segment 2020 - 2024 ($ million)

5.3 End-user segment analysis 2020 - 2024

Historic Market Size - End-user Segment 2020 - 2024 ($ million)

5.4 Deployment segment analysis 2020 - 2024

Historic Market Size - Deployment Segment 2020 - 2024 ($ million)

5.5 Geography segment analysis 2020 - 2024

Historic Market Size - Geography Segment 2020 - 2024 ($ million)

5.6 Country segment analysis 2020 - 2024

Historic Market Size - Country Segment 2020 - 2024 ($ million)

6. Qualitative Analysis

6.1 Impact of AI on global telecom service assurance market

6.2 Impact of geopolitical conflicts on global telecom service assurance market

7. Five Forces Analysis

7.1 Five forces summary

Five forces analysis - Comparison between 2025 and 2030

7.2 Bargaining power of buyers

Bargaining power of buyers - Impact of key factors 2025 and 2030

7.3 Bargaining power of suppliers

Bargaining power of suppliers - Impact of key factors in 2025 and 2030

7.4 Threat of new entrants

Threat of new entrants - Impact of key factors in 2025 and 2030

7.5 Threat of substitutes

Threat of substitutes - Impact of key factors in 2025 and 2030

7.6 Threat of rivalry

Threat of rivalry - Impact of key factors in 2025 and 2030

7.7 Market condition

Chart on Market condition - Five forces 2025 and 2030

8. Market Segmentation by Component

8.1 Market segments

Chart on Component - Market share 2025-2030 (%)
Data Table on Component - Market share 2025-2030 (%)

8.2 Comparison by Component

Chart on Comparison by Component
Data Table on Comparison by Component

8.3 Solutions - Market size and forecast 2025-2030

Chart on Solutions - Market size and forecast 2025-2030 ($ million)
Data Table on Solutions - Market size and forecast 2025-2030 ($ million)
Chart on Solutions - Year-over-year growth 2025-2030 (%)
Data Table on Solutions - Year-over-year growth 2025-2030 (%)

8.4 Services - Market size and forecast 2025-2030

Chart on Services - Market size and forecast 2025-2030 ($ million)
Data Table on Services - Market size and forecast 2025-2030 ($ million)
Chart on Services - Year-over-year growth 2025-2030 (%)
Data Table on Services - Year-over-year growth 2025-2030 (%)

8.5 Market opportunity by Component

Market opportunity by Component ($ million)
Data Table on Market opportunity by Component ($ million)

9. Market Segmentation by End-user

9.1 Market segments

Chart on End-user - Market share 2025-2030 (%)
Data Table on End-user - Market share 2025-2030 (%)

9.2 Comparison by End-user

Chart on Comparison by End-user
Data Table on Comparison by End-user

9.3 Mobile operators - Market size and forecast 2025-2030

Chart on Mobile operators - Market size and forecast 2025-2030 ($ million)
Data Table on Mobile operators - Market size and forecast 2025-2030 ($ million)
Chart on Mobile operators - Year-over-year growth 2025-2030 (%)
Data Table on Mobile operators - Year-over-year growth 2025-2030 (%)

9.4 Fixed-line operators - Market size and forecast 2025-2030

Chart on Fixed-line operators - Market size and forecast 2025-2030 ($ million)
Data Table on Fixed-line operators - Market size and forecast 2025-2030 ($ million)
Chart on Fixed-line operators - Year-over-year growth 2025-2030 (%)
Data Table on Fixed-line operators - Year-over-year growth 2025-2030 (%)

9.5 Broadband service providers - Market size and forecast 2025-2030

Chart on Broadband service providers - Market size and forecast 2025-2030 ($ million)
Data Table on Broadband service providers - Market size and forecast 2025-2030 ($ million)
Chart on Broadband service providers - Year-over-year growth 2025-2030 (%)
Data Table on Broadband service providers - Year-over-year growth 2025-2030 (%)

9.6 MVNOs - Market size and forecast 2025-2030

Chart on MVNOs - Market size and forecast 2025-2030 ($ million)
Data Table on MVNOs - Market size and forecast 2025-2030 ($ million)
Chart on MVNOs - Year-over-year growth 2025-2030 (%)
Data Table on MVNOs - Year-over-year growth 2025-2030 (%)

9.7 Market opportunity by End-user

Market opportunity by End-user ($ million)
Data Table on Market opportunity by End-user ($ million)

10. Market Segmentation by Deployment

10.1 Market segments

Chart on Deployment - Market share 2025-2030 (%)
Data Table on Deployment - Market share 2025-2030 (%)

10.2 Comparison by Deployment

Chart on Comparison by Deployment
Data Table on Comparison by Deployment

10.3 On-premises - Market size and forecast 2025-2030

Chart on On-premises - Market size and forecast 2025-2030 ($ million)
Data Table on On-premises - Market size and forecast 2025-2030 ($ million)
Chart on On-premises - Year-over-year growth 2025-2030 (%)
Data Table on On-premises - Year-over-year growth 2025-2030 (%)

10.4 Cloud-based - Market size and forecast 2025-2030

Chart on Cloud-based - Market size and forecast 2025-2030 ($ million)
Data Table on Cloud-based - Market size and forecast 2025-2030 ($ million)
Chart on Cloud-based - Year-over-year growth 2025-2030 (%)
Data Table on Cloud-based - Year-over-year growth 2025-2030 (%)

10.5 Market opportunity by Deployment

Market opportunity by Deployment ($ million)
Data Table on Market opportunity by Deployment ($ million)

11. Customer Landscape

11.1 Customer landscape overview

Analysis of price sensitivity, lifecycle, customer purchase basket, adoption rates, and purchase criteria

12. Geographic Landscape

12.1 Geographic segmentation

Chart on Market share by geography 2025-2030 (%)
Data Table on Market share by geography 2025-2030 (%)

12.2 Geographic comparison

Chart on Geographic comparison
Data Table on Geographic comparison

12.3 APAC - Market size and forecast 2025-2030

Chart on APAC - Market size and forecast 2025-2030 ($ million)
Data Table on APAC - Market size and forecast 2025-2030 ($ million)
Chart on APAC - Year-over-year growth 2025-2030 (%)
Data Table on APAC - Year-over-year growth 2025-2030 (%)
Chart on Regional Comparison - APAC
Data Table on Regional Comparison - APAC

12.3.1 China - Market size and forecast 2025-2030

Chart on China - Market size and forecast 2025-2030 ($ million)
Data Table on China - Market size and forecast 2025-2030 ($ million)
Chart on China - Year-over-year growth 2025-2030 (%)
Data Table on China - Year-over-year growth 2025-2030 (%)

12.3.2 Japan - Market size and forecast 2025-2030

Chart on Japan - Market size and forecast 2025-2030 ($ million)
Data Table on Japan - Market size and forecast 2025-2030 ($ million)
Chart on Japan - Year-over-year growth 2025-2030 (%)
Data Table on Japan - Year-over-year growth 2025-2030 (%)

12.3.3 India - Market size and forecast 2025-2030

Chart on India - Market size and forecast 2025-2030 ($ million)
Data Table on India - Market size and forecast 2025-2030 ($ million)
Chart on India - Year-over-year growth 2025-2030 (%)
Data Table on India - Year-over-year growth 2025-2030 (%)

12.3.4 South Korea - Market size and forecast 2025-2030

Chart on South Korea - Market size and forecast 2025-2030 ($ million)
Data Table on South Korea - Market size and forecast 2025-2030 ($ million)
Chart on South Korea - Year-over-year growth 2025-2030 (%)
Data Table on South Korea - Year-over-year growth 2025-2030 (%)

12.3.5 Australia - Market size and forecast 2025-2030

Chart on Australia - Market size and forecast 2025-2030 ($ million)
Data Table on Australia - Market size and forecast 2025-2030 ($ million)
Chart on Australia - Year-over-year growth 2025-2030 (%)
Data Table on Australia - Year-over-year growth 2025-2030 (%)

12.3.6 Indonesia - Market size and forecast 2025-2030

Chart on Indonesia - Market size and forecast 2025-2030 ($ million)
Data Table on Indonesia - Market size and forecast 2025-2030 ($ million)
Chart on Indonesia - Year-over-year growth 2025-2030 (%)
Data Table on Indonesia - Year-over-year growth 2025-2030 (%)

12.4 North America - Market size and forecast 2025-2030

Chart on North America - Market size and forecast 2025-2030 ($ million)
Data Table on North America - Market size and forecast 2025-2030 ($ million)
Chart on North America - Year-over-year growth 2025-2030 (%)
Data Table on North America - Year-over-year growth 2025-2030 (%)
Chart on Regional Comparison - North America
Data Table on Regional Comparison - North America

12.4.1 US - Market size and forecast 2025-2030

Chart on US - Market size and forecast 2025-2030 ($ million)
Data Table on US - Market size and forecast 2025-2030 ($ million)
Chart on US - Year-over-year growth 2025-2030 (%)
Data Table on US - Year-over-year growth 2025-2030 (%)

12.4.2 Canada - Market size and forecast 2025-2030

Chart on Canada - Market size and forecast 2025-2030 ($ million)
Data Table on Canada - Market size and forecast 2025-2030 ($ million)
Chart on Canada - Year-over-year growth 2025-2030 (%)
Data Table on Canada - Year-over-year growth 2025-2030 (%)

12.4.3 Mexico - Market size and forecast 2025-2030

Chart on Mexico - Market size and forecast 2025-2030 ($ million)
Data Table on Mexico - Market size and forecast 2025-2030 ($ million)
Chart on Mexico - Year-over-year growth 2025-2030 (%)
Data Table on Mexico - Year-over-year growth 2025-2030 (%)

12.5 Europe - Market size and forecast 2025-2030

Chart on Europe - Market size and forecast 2025-2030 ($ million)
Data Table on Europe - Market size and forecast 2025-2030 ($ million)
Chart on Europe - Year-over-year growth 2025-2030 (%)
Data Table on Europe - Year-over-year growth 2025-2030 (%)
Chart on Regional Comparison - Europe
Data Table on Regional Comparison - Europe

12.5.1 Germany - Market size and forecast 2025-2030

Chart on Germany - Market size and forecast 2025-2030 ($ million)
Data Table on Germany - Market size and forecast 2025-2030 ($ million)
Chart on Germany - Year-over-year growth 2025-2030 (%)
Data Table on Germany - Year-over-year growth 2025-2030 (%)

12.5.2 UK - Market size and forecast 2025-2030

Chart on UK - Market size and forecast 2025-2030 ($ million)
Data Table on UK - Market size and forecast 2025-2030 ($ million)
Chart on UK - Year-over-year growth 2025-2030 (%)
Data Table on UK - Year-over-year growth 2025-2030 (%)

12.5.3 France - Market size and forecast 2025-2030

Chart on France - Market size and forecast 2025-2030 ($ million)
Data Table on France - Market size and forecast 2025-2030 ($ million)
Chart on France - Year-over-year growth 2025-2030 (%)
Data Table on France - Year-over-year growth 2025-2030 (%)

12.5.4 Italy - Market size and forecast 2025-2030

Chart on Italy - Market size and forecast 2025-2030 ($ million)
Data Table on Italy - Market size and forecast 2025-2030 ($ million)
Chart on Italy - Year-over-year growth 2025-2030 (%)
Data Table on Italy - Year-over-year growth 2025-2030 (%)

12.5.5 Spain - Market size and forecast 2025-2030

Chart on Spain - Market size and forecast 2025-2030 ($ million)
Data Table on Spain - Market size and forecast 2025-2030 ($ million)
Chart on Spain - Year-over-year growth 2025-2030 (%)
Data Table on Spain - Year-over-year growth 2025-2030 (%)

12.5.6 The Netherlands - Market size and forecast 2025-2030

Chart on The Netherlands - Market size and forecast 2025-2030 ($ million)
Data Table on The Netherlands - Market size and forecast 2025-2030 ($ million)
Chart on The Netherlands - Year-over-year growth 2025-2030 (%)
Data Table on The Netherlands - Year-over-year growth 2025-2030 (%)

12.6 Middle East and Africa - Market size and forecast 2025-2030

Chart on Middle East and Africa - Market size and forecast 2025-2030 ($ million)
Data Table on Middle East and Africa - Market size and forecast 2025-2030 ($ million)
Chart on Middle East and Africa - Year-over-year growth 2025-2030 (%)
Data Table on Middle East and Africa - Year-over-year growth 2025-2030 (%)
Chart on Regional Comparison - Middle East and Africa
Data Table on Regional Comparison - Middle East and Africa

12.6.1 Saudi Arabia - Market size and forecast 2025-2030

Chart on Saudi Arabia - Market size and forecast 2025-2030 ($ million)
Data Table on Saudi Arabia - Market size and forecast 2025-2030 ($ million)
Chart on Saudi Arabia - Year-over-year growth 2025-2030 (%)
Data Table on Saudi Arabia - Year-over-year growth 2025-2030 (%)

12.6.2 South Africa - Market size and forecast 2025-2030

Chart on South Africa - Market size and forecast 2025-2030 ($ million)
Data Table on South Africa - Market size and forecast 2025-2030 ($ million)
Chart on South Africa - Year-over-year growth 2025-2030 (%)
Data Table on South Africa - Year-over-year growth 2025-2030 (%)

12.6.3 UAE - Market size and forecast 2025-2030

Chart on UAE - Market size and forecast 2025-2030 ($ million)
Data Table on UAE - Market size and forecast 2025-2030 ($ million)
Chart on UAE - Year-over-year growth 2025-2030 (%)
Data Table on UAE - Year-over-year growth 2025-2030 (%)

12.6.4 Turkey - Market size and forecast 2025-2030

Chart on Turkey - Market size and forecast 2025-2030 ($ million)
Data Table on Turkey - Market size and forecast 2025-2030 ($ million)
Chart on Turkey - Year-over-year growth 2025-2030 (%)
Data Table on Turkey - Year-over-year growth 2025-2030 (%)

12.6.5 Israel - Market size and forecast 2025-2030

Chart on Israel - Market size and forecast 2025-2030 ($ million)
Data Table on Israel - Market size and forecast 2025-2030 ($ million)
Chart on Israel - Year-over-year growth 2025-2030 (%)
Data Table on Israel - Year-over-year growth 2025-2030 (%)

12.7 South America - Market size and forecast 2025-2030

Chart on South America - Market size and forecast 2025-2030 ($ million)
Data Table on South America - Market size and forecast 2025-2030 ($ million)
Chart on South America - Year-over-year growth 2025-2030 (%)
Data Table on South America - Year-over-year growth 2025-2030 (%)
Chart on Regional Comparison - South America
Data Table on Regional Comparison - South America

12.7.1 Brazil - Market size and forecast 2025-2030

Chart on Brazil - Market size and forecast 2025-2030 ($ million)
Data Table on Brazil - Market size and forecast 2025-2030 ($ million)
Chart on Brazil - Year-over-year growth 2025-2030 (%)
Data Table on Brazil - Year-over-year growth 2025-2030 (%)

12.7.2 Argentina - Market size and forecast 2025-2030

Chart on Argentina - Market size and forecast 2025-2030 ($ million)
Data Table on Argentina - Market size and forecast 2025-2030 ($ million)
Chart on Argentina - Year-over-year growth 2025-2030 (%)
Data Table on Argentina - Year-over-year growth 2025-2030 (%)

12.7.3 Colombia - Market size and forecast 2025-2030

Chart on Colombia - Market size and forecast 2025-2030 ($ million)
Data Table on Colombia - Market size and forecast 2025-2030 ($ million)
Chart on Colombia - Year-over-year growth 2025-2030 (%)
Data Table on Colombia - Year-over-year growth 2025-2030 (%)

12.8 Market opportunity by geography

Market opportunity by geography ($ million)
Data Tables on Market opportunity by geography ($ million)

13. Drivers, Challenges, and Opportunity

13.1 Market drivers

Accelerated adoption of 5G standalone and network slicing
Evolution toward zero-touch and autonomous network operations
Rising demand for enhanced subscriber experience and churn reduction

13.2 Market challenges

Complexity of multi-company and multi-domain interoperability
Data privacy and sovereignty in cloud-native environments
Integration of legacy infrastructure with autonomous systems

13.3 Impact of drivers and challenges

Impact of drivers and challenges in 2025 and 2030

13.4 Market opportunities

Integration of agentic artificial intelligence and cognitive cores
Standardization of AI-native blueprints and open architectures
Focus on generative AI for intent based human machine interaction

14. Competitive Landscape

14.1 Overview

14.2

Overview on criticality of inputs and factors of differentiation

14.3 Landscape disruption

Overview on factors of disruption

14.4 Industry risks

Impact of key risks on business

15. Competitive Analysis

15.1 Companies profiled

Companies covered

15.2 Company ranking index

15.3 Market positioning of companies

Matrix on companies position and classification

15.4 Amdocs Ltd.

Amdocs Ltd. - Overview
Amdocs Ltd. - Product / Service
Amdocs Ltd. - Key offerings
SWOT

15.5 Broadcom Inc.

Broadcom Inc. - Overview
Broadcom Inc. - Business segments
Broadcom Inc. - Key offerings
Broadcom Inc. - Segment focus
SWOT

15.6 Cisco Systems Inc.

Cisco Systems Inc. - Overview
Cisco Systems Inc. - Business segments
Cisco Systems Inc. - Key news
Cisco Systems Inc. - Key offerings
Cisco Systems Inc. - Segment focus
SWOT

15.7 Comarch SA

Comarch SA - Overview
Comarch SA - Product / Service
Comarch SA - Key news
Comarch SA - Key offerings
SWOT

15.8 EXFO Inc.

EXFO Inc. - Overview
EXFO Inc. - Product / Service
EXFO Inc. - Key offerings
SWOT

15.9 Fujitsu Ltd.

Fujitsu Ltd. - Overview
Fujitsu Ltd. - Business segments
Fujitsu Ltd. - Key offerings
Fujitsu Ltd. - Segment focus
SWOT

15.10 Hewlett Packard Enterprise Co.

Hewlett Packard Enterprise Co. - Overview
Hewlett Packard Enterprise Co. - Business segments
Hewlett Packard Enterprise Co. - Key news
Hewlett Packard Enterprise Co. - Key offerings
Hewlett Packard Enterprise Co. - Segment focus
SWOT

15.11 Huawei Technologies Co. Ltd.

Huawei Technologies Co. Ltd. - Overview
Huawei Technologies Co. Ltd. - Product / Service
Huawei Technologies Co. Ltd. - Key offerings
SWOT

15.12 IBM Corp.

IBM Corp. - Overview
IBM Corp. - Business segments
IBM Corp. - Key news
IBM Corp. - Key offerings
IBM Corp. - Segment focus
SWOT

15.13 Nokia Corp.

Nokia Corp. - Overview
Nokia Corp. - Business segments
Nokia Corp. - Key offerings
Nokia Corp. - Segment focus
SWOT

15.14 Oracle Corp.

Oracle Corp. - Overview
Oracle Corp. - Business segments
Oracle Corp. - Key news
Oracle Corp. - Key offerings
Oracle Corp. - Segment focus
SWOT

15.15 ServiceNow Inc.

ServiceNow Inc. - Overview
ServiceNow Inc. - Product / Service
ServiceNow Inc. - Key news
ServiceNow Inc. - Key offerings
SWOT

15.16 Telefonaktiebolaget Ericsson

Telefonaktiebolaget Ericsson - Overview
Telefonaktiebolaget Ericsson - Business segments
Telefonaktiebolaget Ericsson - Key offerings
Telefonaktiebolaget Ericsson - Segment focus
SWOT

15.17 Viavi Solutions Inc.

Viavi Solutions Inc. - Overview
Viavi Solutions Inc. - Business segments
Viavi Solutions Inc. - Key offerings
Viavi Solutions Inc. - Segment focus
SWOT

15.18 ZTE Corp.

ZTE Corp. - Overview
ZTE Corp. - Business segments
ZTE Corp. - Key offerings
ZTE Corp. - Segment focus
SWOT

16. Appendix

16.1 Scope of the report

Market definition
Objectives
Notes and caveats

16.2 Inclusions and exclusions checklist

Inclusions checklist
Exclusions checklist

16.3 Currency conversion rates for US$

16.4 Research methodology

16.5 Data procurement

Information sources

16.6 Data validation

16.7 Validation techniques employed for market sizing

16.8 Data synthesis

16.9 360 degree market analysis

16.10 List of abbreviations

Research Methodology

Technavio presents a detailed picture of the market by way of study, synthesis, and summation of data from multiple sources. The analysts have presented the various facets of the market with a particular focus on identifying the key industry influencers. The data thus presented is comprehensive, reliable, and the result of extensive research, both primary and secondary.

INFORMATION SOURCES

Primary sources

  • Manufacturers and suppliers
  • Channel partners
  • Industry experts
  • Strategic decision makers

Secondary sources

  • Industry journals and periodicals
  • Government data
  • Financial reports of key industry players
  • Historical data
  • Press releases

DATA ANALYSIS

Data Synthesis

  • Collation of data
  • Estimation of key figures
  • Analysis of derived insights

Data Validation

  • Triangulation with data models
  • Reference against proprietary databases
  • Corroboration with industry experts

REPORT WRITING

Qualitative

  • Market drivers
  • Market challenges
  • Market trends
  • Five forces analysis

Quantitative

  • Market size and forecast
  • Market segmentation
  • Geographical insights
  • Competitive landscape

Interested in this report?

Get your sample now to see our research methodology and insights!

Download Now

Frequently Asked Questions

Telecom Service Assurance market growth will increase by USD 5970.9 million during 2026-2030.

The Telecom Service Assurance market is expected to grow at a CAGR of 9.1% during 2026-2030.

Telecom Service Assurance market is segmented by Component (Solutions, Services) End-user (Mobile operators, Fixed-line operators, Broadband service providers, MVNOs) Deployment (On-premises, Cloud-based)

Amdocs Ltd., Anritsu Corp., Broadcom Inc., Cisco Systems Inc., Comarch SA, EXFO Inc., Fujitsu Ltd., Hewlett Packard Enterprise Co., Huawei Technologies Co. Ltd., IBM Corp., Infovista SAS, MYCOM OSI Group, Nokia Corp., Oracle Corp., Rakuten Group Inc., ServiceNow Inc., Telefonaktiebolaget Ericsson, Teoco, Viavi Solutions Inc., ZTE Corp. are a few of the key vendors in the Telecom Service Assurance market.

APAC will register the highest growth rate of 38.3% among the other regions. Therefore, the Telecom Service Assurance market in APAC is expected to garner significant business opportunities for the vendors during the forecast period.

China, Japan, India, South Korea, Australia, Indonesia, US, Canada, Mexico, Germany, UK, France, Italy, Spain, The Netherlands, Saudi Arabia, South Africa, UAE, Turkey, Israel, Brazil, Argentina, Colombia

  • Accelerated adoption of 5G standalone and network slicing is the driving factor this market.

The Telecom Service Assurance market vendors should focus on grabbing business opportunities from the Component segment as it accounted for the largest market share in the base year.
RIA - Research AI Assistant
Ask RIA