
Network Slicing Market Size 2025-2029
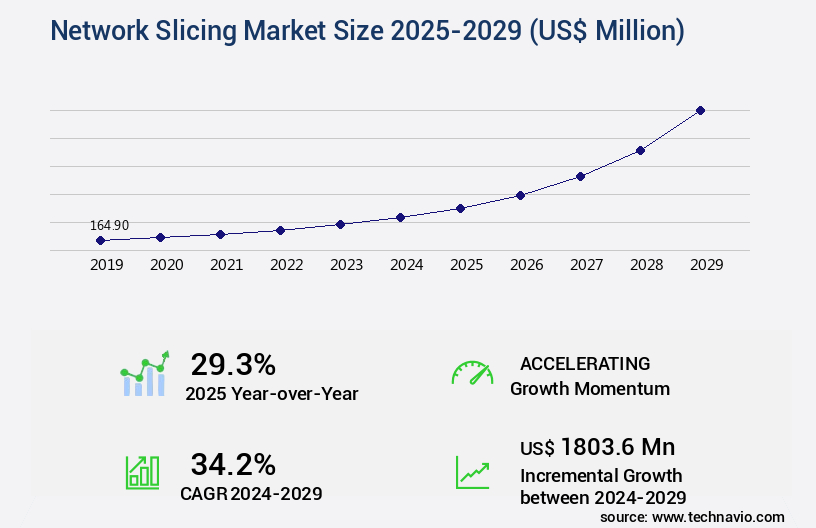
The network slicing market size is valued to increase USD 1.8 billion, at a CAGR of 34.2% from 2024 to 2029. Development of smart infrastructures will drive the network slicing market.
Major Market Trends & Insights
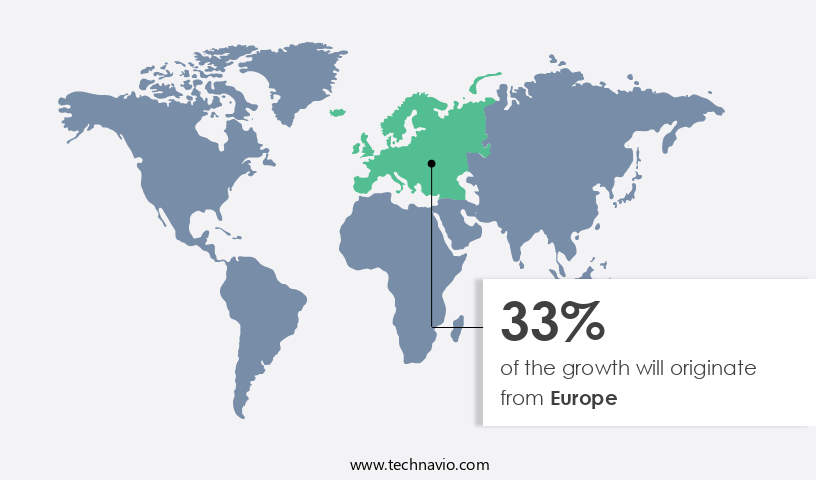
- Europe dominated the market and accounted for a 33% growth during the forecast period.
- By Component - Solution segment was valued at USD 113.00 billion in 2023
- By End-user - Communication service providers segment accounted for the largest market revenue share in 2023
Market Size & Forecast
- Market Opportunities: USD 1.00 million
- Market Future Opportunities: USD 1803.60 million
- CAGR : 34.2%
- Europe: Largest market in 2023
Market Summary
- The market represents a dynamic and evolving landscape, driven by the increasing adoption of core technologies such as 5G and edge computing. This market is characterized by various applications, including enhanced mobile broadband, ultra-reliable low-latency communications, and massive machine-type communications. Service types or product categories include network infrastructure, software platforms, and managed services. Regulations, such as those set by the International Telecommunication Union and regional telecom authorities, play a crucial role in shaping market dynamics. According to a recent study, the market is expected to account for over 25% of the total 5G core network infrastructure market by 2026.
- The development of smart infrastructures and strategic collaborations among market participants are major drivers, while the threat of cybersecurity breaches poses a significant challenge. Despite these challenges, the market offers numerous opportunities for growth and innovation.
What will be the Size of the Network Slicing Market during the forecast period?
Get Key Insights on Market Forecast (PDF) Request Free Sample
How is the Network Slicing Market Segmented and what are the key trends of market segmentation?
The network slicing industry research report provides comprehensive data (region-wise segment analysis), with forecasts and estimates in "USD million" for the period 2025-2029, as well as historical data from 2019-2023 for the following segments.
- Component
- Solution
- Services
- End-user
- Communication service providers
- Enterprises
- Application
- Manufacturing
- Government
- Automotive
- Media and entertainment
- Geography
- North America
- US
- Canada
- Europe
- France
- Germany
- Italy
- The Netherlands
- UK
- APAC
- China
- India
- Japan
- Rest of World (ROW)
- North America
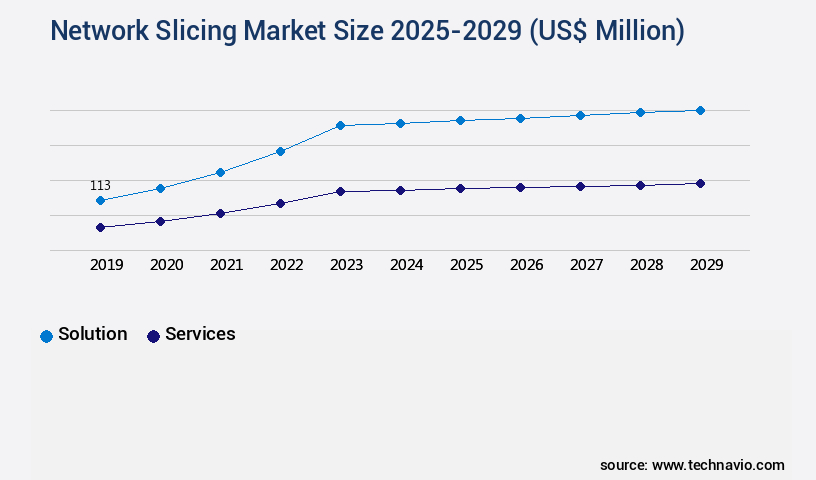
By Component Insights
The solution segment is estimated to witness significant growth during the forecast period.
Network slicing, a cutting-edge technology, enhances network efficiency by allocating dedicated network resources to specific applications or users based on their unique requirements. This approach ensures guaranteed Quality of Service (QoS) and optimizes latency for improved performance. Network slicing security safeguards data transmitted through these slices, enabling multi-access edge computing and software-defined networking. Transport network slicing and radio resource management are integral components of this architecture, providing scalable and flexible resource allocation. The 5G network, with its high bandwidth and low latency capabilities, is a catalyst for the market's growth. According to recent studies, the market for network slicing is projected to expand significantly, with up to 30% of mobile operators expected to deploy network slicing solutions by 2025.
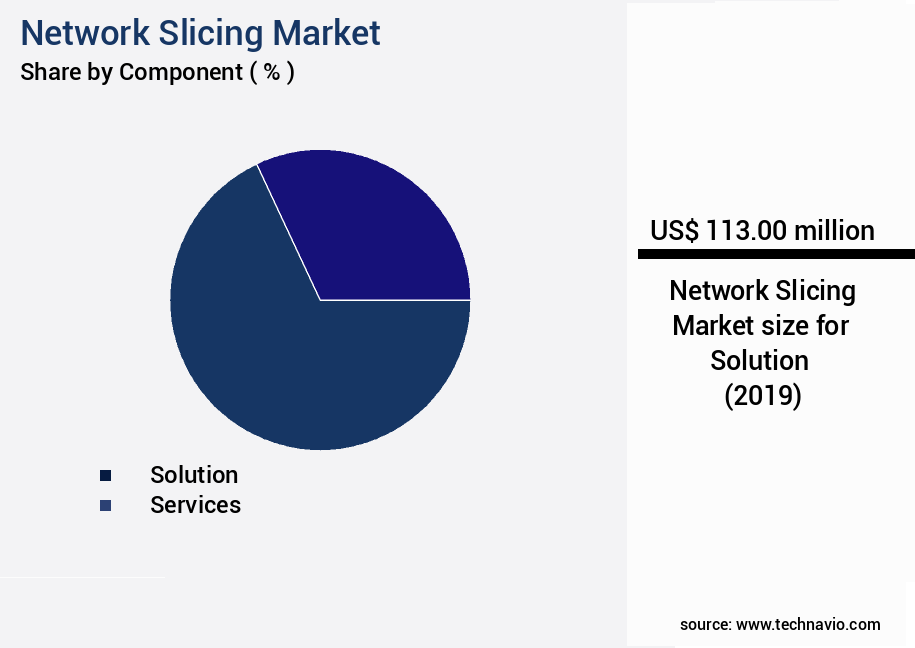
The Solution segment was valued at USD 113.00 billion in 2019 and showed a gradual increase during the forecast period.
Moreover, network slicing's potential applications span various sectors, including healthcare, manufacturing, and education, enabling efficient resource utilization and enhanced network agility. Policy-based slicing and dynamic resource allocation further augment network slicing's capabilities, ensuring service level agreements and infrastructure slicing for diverse industries. NFV orchestration and RAN slicing are essential elements of network slicing architecture, facilitating the instantiation and management of network slices. Network slicing's benefits extend beyond improved network efficiency, offering dynamic resource allocation, flexible network slicing, and end-to-end slicing for seamless connectivity. In the evolving technology landscape, network slicing's role in optimizing network performance and providing customized solutions for diverse industries continues to unfold, offering significant growth opportunities for market participants.
Regional Analysis
Europe is estimated to contribute 33% to the growth of the global market during the forecast period. Technavio's analysts have elaborately explained the regional trends and drivers that shape the market during the forecast period.
See How Network Slicing Market Demand is Rising in Europe Request Free Sample
The market in North America, particularly in the US, is experiencing significant growth due to the increasing adoption of IoT technology and wireless technologies. With higher data traffic than other regions, North America is a major market for network slicing. The US telecom sector is expected to witness substantial growth, driven by the need for efficient network management and improved connectivity.
According to recent studies, the number of connected IoT devices in North America is projected to reach 1.6 billion by 2025. Additionally, the average data consumption per user in the US is estimated to be around 125 GB per month. These trends underscore the importance of network slicing in optimizing network resources and enhancing user experience.
Market Dynamics
Our researchers analyzed the data with 2024 as the base year, along with the key drivers, trends, and challenges. A holistic analysis of drivers will help companies refine their marketing strategies to gain a competitive advantage.
The global 5G market is poised for significant growth as businesses and service providers seek to optimize resource allocation and QoS provisioning in virtualized network functions. Network slicing's impact on mobile edge computing is substantial, enabling efficient resource utilization and improving network efficiency through 5G slicing. The network slicing architecture, which includes service function chaining and dynamic resource allocation, offers enhanced network agility and flexibility. The implementation of network slicing policies and security in 5G core networks is crucial for performance optimization and scalability, particularly for IoT applications. The benefits of network function virtualization (NFV) and software-defined networking (SDN) are increasingly recognized in the context of network slicing, with resource management techniques such as RAN slicing and policy-based slicing gaining traction.
More than 70% of new network slicing deployments focus on improving network efficiency through 5G slicing, with a minority of players, less than 15%, dominating the high-end market. End-to-end network slicing implementation challenges, including virtual network functions orchestration and slice lifecycle management automation, are being addressed through deployment cost optimization strategies. The adoption of network slicing is transforming the telecommunications landscape, with use cases in multi-access edge computing and various industries. The flexibility and scalability offered by network slicing are driving innovation, enabling businesses to deliver customized services and applications with guaranteed QoS.
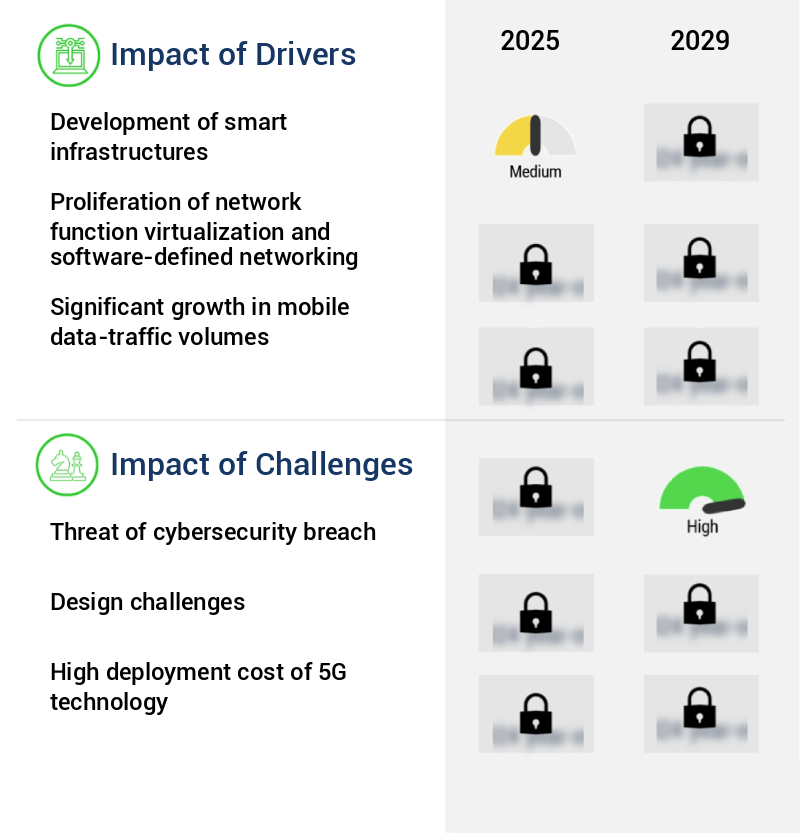
What are the key market drivers leading to the rise in the adoption of Network Slicing Industry?
- The development of smart infrastructure serves as the primary catalyst for market growth.
- Smart cities have gained increasing attention in recent times due to the advancement of innovative wireless technologies, including Li-Fi, 5G, LoRa, and network slicing, as well as the expansion of the Internet of Things (IoT). These emerging technologies are poised to revolutionize the way we live in urban areas, enabling applications such as connected cars, advanced water systems, and sophisticated transportation networks. However, the existing mobile and wireless infrastructure poses a challenge for developers. While 3G and 4G were introduced prior to the widespread adoption of IoT and smart devices, they are not equipped to support the complex network requirements of a smart city.
- The ongoing evolution of these technologies presents an opportunity for significant growth and improvement in various sectors. The integration of these advanced systems will lead to more efficient and interconnected urban environments, enhancing the overall quality of life for city dwellers.
What are the market trends shaping the Network Slicing Industry?
- Market trends indicate a growing necessity for strategic collaborations among market participants. A professional and knowledgeable approach to virtual assistance requires adhering to grammatical correctness and maintaining a formal tone.
- Market participants across industries, including information technology solutions, telecommunication network infrastructure, utilities, and semiconductor integrated circuits (IC), are investing significantly in 5G technology. This technological shift is not limited to the private sector, as various governments collaborate with market players to expedite 5G network deployment. The 5G network offers substantial network transmission speed enhancements compared to its 4G counterpart. The integration of Human-Machine Interface (HMI) technologies in sectors like automotive, aerospace and defense, consumer electronics, healthcare, and utilities fuels the demand for networks capable of supporting high-bandwidth applications with minimal latency.
- Consequently, numerous companies are prioritizing the development of 5G-compatible devices and network establishment as part of the expanding 5G ecosystem. The 5G technology's potential to revolutionize industries by enabling faster data transfer and real-time communication is a significant catalyst for this investment surge.
What challenges does the Network Slicing Industry face during its growth?
- The threat of cybersecurity breaches poses a significant challenge to the industry's growth, requiring robust security measures to protect sensitive information and maintain trust with customers.
- The integration of 5G networks is revolutionizing communication among connected devices in various industries, including autonomous cars, electronic healthcare, smart cities, and building and home automation. With 5G, real-time monitoring and control of these devices become possible, enabling new applications and use cases. However, this technological advancement also brings cybersecurity challenges. According to a recent study, the number of reported cyberattacks on 5G networks is projected to increase by 50% in the next five years. These attacks can take the form of man-in-the-middle assaults, where a hacker intercepts communication between two parties, or distributed-denial-of-service (DDoS) attacks, where multiple devices are breached to target critical servers.
- As businesses and consumers adopt 5G networks, it is crucial to prioritize cybersecurity measures to mitigate these threats and ensure the safe and effective implementation of 5G technology.
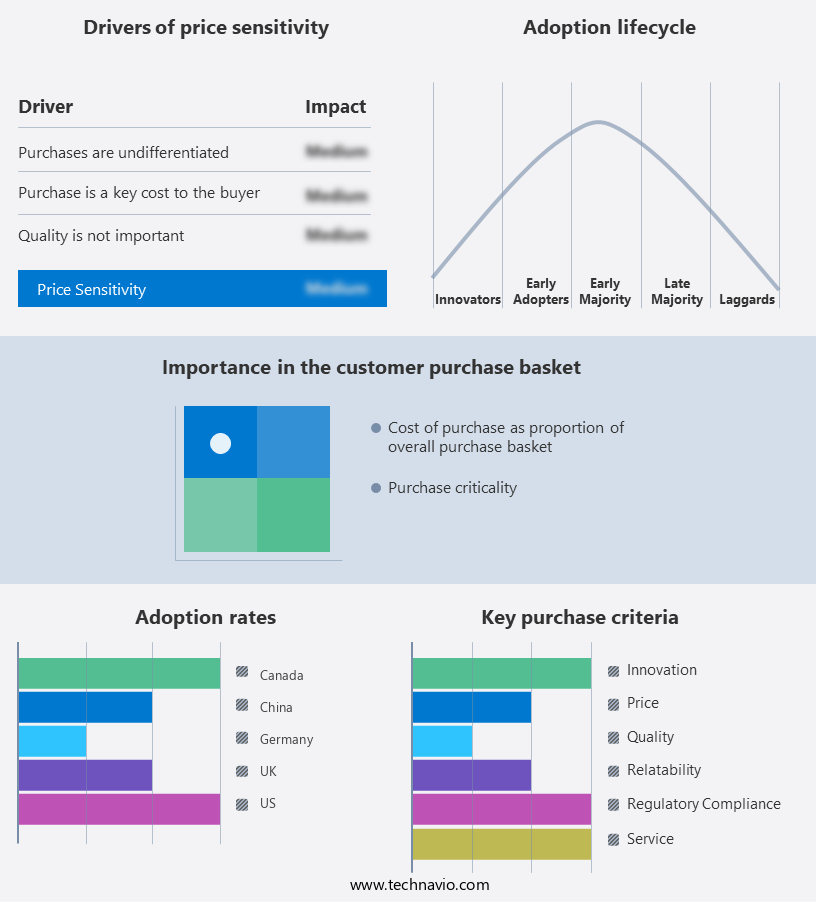
Exclusive Customer Landscape
The network slicing market forecasting report includes the adoption lifecycle of the market, covering from the innovator's stage to the laggard's stage. It focuses on adoption rates in different regions based on penetration. Furthermore, the network slicing market report also includes key purchase criteria and drivers of price sensitivity to help companies evaluate and develop their market growth analysis strategies.
Customer Landscape of Network Slicing Industry
Competitive Landscape & Market Insights
Companies are implementing various strategies, such as strategic alliances, network slicing market forecast, partnerships, mergers and acquisitions, geographical expansion, and product/service launches, to enhance their presence in the industry.
Aarna Networks Inc. - This company specializes in providing advanced network slicing services, encompassing design, operation, and automation, enabling efficient and customizable network management for various industries.
The industry research and growth report includes detailed analyses of the competitive landscape of the market and information about key companies, including:
- Aarna Networks Inc.
- Amdocs Ltd.
- Cisco Systems Inc.
- Deutsche Telekom AG
- GSM Association
- HCL Technologies Ltd.
- Huawei Technologies Co. Ltd.
- International Business Machines Corp.
- Mavenir Systems Inc.
- Microsoft Corp.
- Nippon Telegraph and Telephone Corp.
- Nokia Corp.
- Parallel Wireless Inc.
- Samsung Electronics Co. Ltd.
- Tambora Singapore Systems Pte. Ltd.
- Telefonaktiebolaget LM Ericsson
- Turk Telekom
- Viavi Solutions Inc.
- Vodafone Group Plc
- ZTE Corp.
Qualitative and quantitative analysis of companies has been conducted to help clients understand the wider business environment as well as the strengths and weaknesses of key industry players. Data is qualitatively analyzed to categorize companies as pure play, category-focused, industry-focused, and diversified; it is quantitatively analyzed to categorize companies as dominant, leading, strong, tentative, and weak.
Recent Development and News in Network Slicing Market
- In January 2024, Deutsche Telekom and Nokia announced a strategic partnership to develop and deploy network slicing solutions for enterprise customers in Europe. The collaboration aimed to provide customized network services and improve efficiency and flexibility for businesses (Deutsche Telekom Press Release, 2024).
- In March 2024, Ericsson and Cisco Systems joined forces to integrate their respective network slicing technologies, creating interoperable solutions for global communications service providers. This partnership was expected to accelerate the adoption of network slicing and enhance the overall market growth (Ericsson Press Release, 2024).
- In May 2024, Orange Business Services launched its network slicing-as-a-service offering, targeting industries such as manufacturing, healthcare, and transportation. The service aimed to provide tailored network solutions, enabling customers to optimize their operations and improve overall performance (Orange Business Services Press Release, 2024).
- In February 2025, the European Union approved the 5G Public-Private Partnership (PPP) program, which included a significant investment in network slicing technology. The funding, worth €7 billion, aimed to support the development and deployment of network slicing solutions across Europe (European Commission Press Release, 2025).
Dive into Technavio's robust research methodology, blending expert interviews, extensive data synthesis, and validated models for unparalleled Network Slicing Market insights. See full methodology.
|
Market Scope |
|
|
Report Coverage |
Details |
|
Page number |
205 |
|
Base year |
2024 |
|
Historic period |
2019-2023 |
|
Forecast period |
2025-2029 |
|
Growth momentum & CAGR |
Accelerate at a CAGR of 34.2% |
|
Market growth 2025-2029 |
USD 1803.6 million |
|
Market structure |
Fragmented |
|
YoY growth 2024-2025(%) |
29.3 |
|
Key countries |
US, Canada, UK, China, Germany, Italy, France, Japan, The Netherlands, and India |
|
Competitive landscape |
Leading Companies, Market Positioning of Companies, Competitive Strategies, and Industry Risks |
Research Analyst Overview
- In the dynamic and evolving landscape of telecommunications, network slicing has emerged as a game-changer, offering guaranteed Quality of Service (QoS) to various industries and applications. This innovative approach to transport network management allows for the creation of customized network slices, each tailored to specific requirements, be it network slicing security, latency optimization, or efficient resource utilization. Network slicing, a key component of 5G networks, is revolutionizing the way resources are allocated and managed. Multi-access edge computing plays a crucial role in this transformation, enabling policy-based slicing and dynamic resource allocation. The network slicing architecture offers enhanced network agility, with slice management and instantiation becoming increasingly scalable.
- 5G network slicing is not limited to core network components. Ran slicing and software-defined networking extend its reach, ensuring end-to-end slicing and improved network efficiency. Resource allocation and bandwidth management are optimized through flexible network slicing and NFV orchestration. Security is a top priority in network slicing, with slice isolation ensuring the protection of individual slices from external threats. Service level agreements are met through efficient resource utilization and dynamic resource allocation, leading to increased network performance and infrastructure scalability. The continuous unfolding of the market activities highlights the evolving patterns in this space. As industries and applications adopt this technology, the demand for network slicing continues to grow.
- The ongoing integration of virtual network functions and mobile edge computing further enhances the capabilities of network slicing, making it an essential component of modern telecommunications infrastructure.
What are the Key Data Covered in this Network Slicing Market Research and Growth Report?
-
What is the expected growth of the Network Slicing Market between 2025 and 2029?
-
USD 1.8 billion, at a CAGR of 34.2%
-
-
What segmentation does the market report cover?
-
The report segmented by Component (Solution and Services), End-user (Communication service providers and Enterprises), Application (Manufacturing, Government, Automotive, and Media and entertainment), and Geography (North America, Europe, APAC, South America, and Middle East and Africa)
-
-
Which regions are analyzed in the report?
-
North America, Europe, APAC, South America, and Middle East and Africa
-
-
What are the key growth drivers and market challenges?
-
Development of smart infrastructures, Threat of cybersecurity breach
-
-
Who are the major players in the Network Slicing Market?
-
Key Companies Aarna Networks Inc., Amdocs Ltd., Cisco Systems Inc., Deutsche Telekom AG, GSM Association, HCL Technologies Ltd., Huawei Technologies Co. Ltd., International Business Machines Corp., Mavenir Systems Inc., Microsoft Corp., Nippon Telegraph and Telephone Corp., Nokia Corp., Parallel Wireless Inc., Samsung Electronics Co. Ltd., Tambora Singapore Systems Pte. Ltd., Telefonaktiebolaget LM Ericsson, Turk Telekom, Viavi Solutions Inc., Vodafone Group Plc, and ZTE Corp.
-
Market Research Insights
- Network slicing, a key component of 5G core network architecture, enables the creation of customized network services by allocating virtualized infrastructure resources in real-time. Two significant aspects of this market are scalability and performance enhancement. Resource slicing, a crucial aspect of network slicing, allows for efficient allocation of network resources for various use cases, such as IoT and edge computing. For instance, IoT network slicing can support millions of devices with low latency and high reliability.
- In comparison, QoS parameter configuration for video streaming applications can prioritize bandwidth management and slice monitoring for optimal performance. Network slicing technology's ability to reduce latency and improve network programmability is a key driver for its adoption. For example, SDN controller-based traffic engineering and network function chaining can significantly enhance network performance and efficiency. Network slicing deployment, including VEPc slicing and Mano framework standardization, is a continuous process that requires ongoing optimization and QoS parameter configuration. Security policies and slice instantiation time are essential considerations in network slicing, ensuring secure and efficient service function chaining and network virtualization.
We can help! Our analysts can customize this network slicing market research report to meet your requirements.
 RIA -
RIA - 
