Telecom Tower Market Size 2026-2030
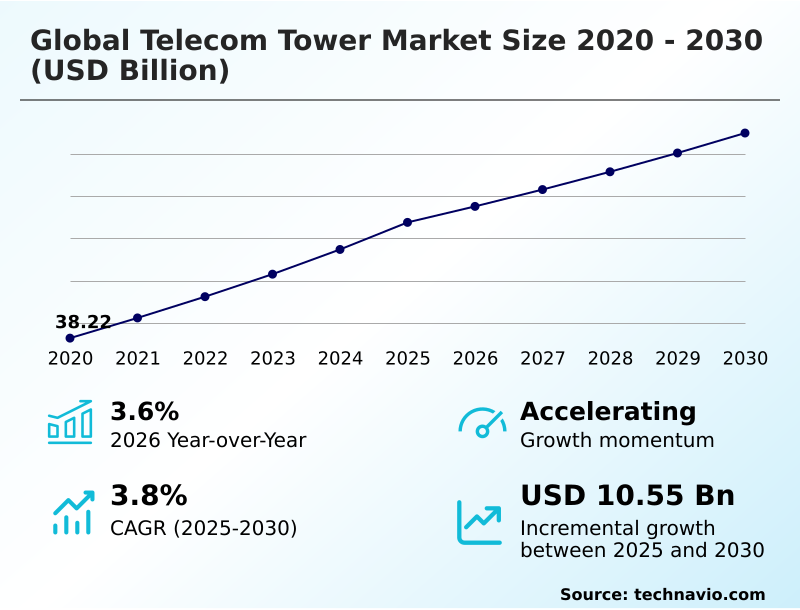
The telecom tower market size is valued to increase by USD 10.55 billion, at a CAGR of 3.8% from 2025 to 2030. Escalating mobile penetration and exponential growth in data traffic will drive the telecom tower market.
Major Market Trends & Insights
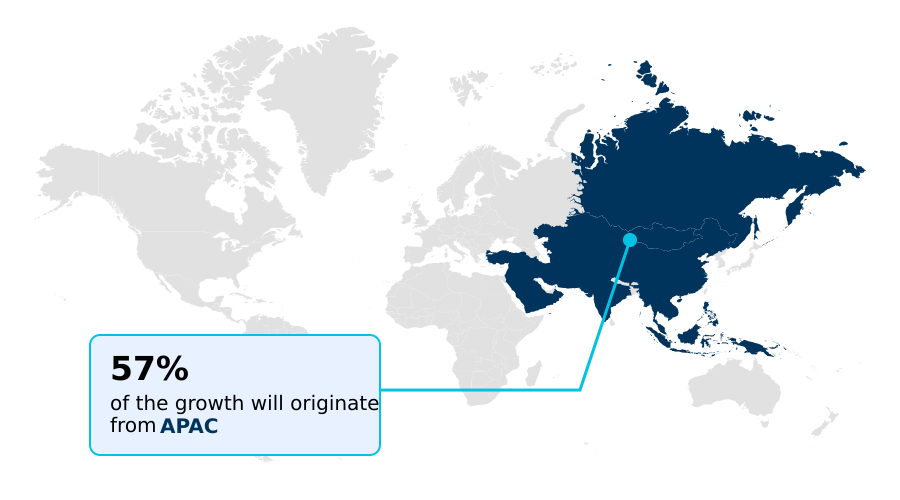
- APAC dominated the market and accounted for a 56.9% growth during the forecast period.
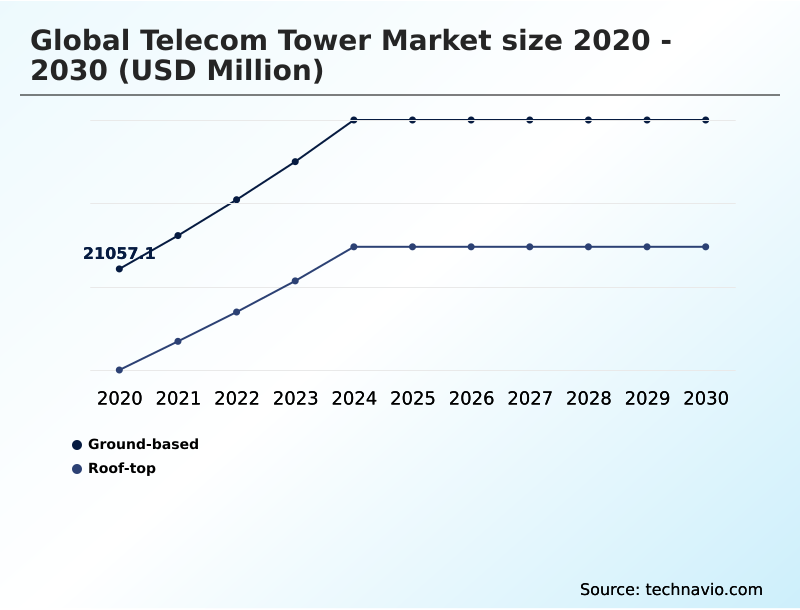
- By Deployment - Ground-based segment was valued at USD 26.79 billion in 2024
- By Business Segment - Operator-led tower companies segment accounted for the largest market revenue share in 2024
Market Size & Forecast
- Market Opportunities: USD 24.23 billion
- Market Future Opportunities: USD 10.55 billion
- CAGR from 2025 to 2030 : 3.8%
Market Summary
- The telecom tower market is undergoing a profound structural transformation, driven by the capital-intensive nature of 5G network deployment and the strategic shift toward an asset-light strategy. The insatiable growth in mobile data consumption necessitates continuous network densification, compelling operators to upgrade macro tower sites and deploy a vast number of small cell networks.
- In response, a common business scenario involves a mobile network operator executing a sale and leaseback model, divesting its passive tower infrastructure to a specialized independent provider. This move unlocks capital for critical investments in spectrum and active radio equipment, transforming a large capital expenditure into a predictable operating expense under a master lease agreement.
- This trend fosters a more efficient ecosystem focused on multi-tenant economics and operational excellence. Concurrently, the industry is navigating challenges related to complex zoning approval processes while embracing opportunities in sustainable telecom infrastructure and the development of edge computing nodes at tower locations, positioning them as critical digital infrastructure providers for next-generation networks.
What will be the Size of the Telecom Tower Market during the forecast period?
Get Key Insights on Market Forecast (PDF) Get Free Sample
How is the Telecom Tower Market Segmented?
The telecom tower industry research report provides comprehensive data (region-wise segment analysis), with forecasts and estimates in "USD million" for the period 2026-2030, as well as historical data from 2020-2024 for the following segments.
- Deployment
- Ground-based
- Roof-top
- Business segment
- Operator-led tower companies
- MNO captive sites
- Independent tower companies
- Joint venture infrastructure companies
- Type
- Lattice towers
- Monopole towers
- Guyed towers
- Stealth towers
- Geography
- APAC
- China
- India
- Japan
- North America
- US
- Canada
- Mexico
- Europe
- Germany
- UK
- France
- Middle East and Africa
- UAE
- Saudi Arabia
- South Africa
- South America
- Brazil
- Argentina
- Colombia
- Rest of World (ROW)
- APAC
By Deployment Insights
The ground-based segment is estimated to witness significant growth during the forecast period.
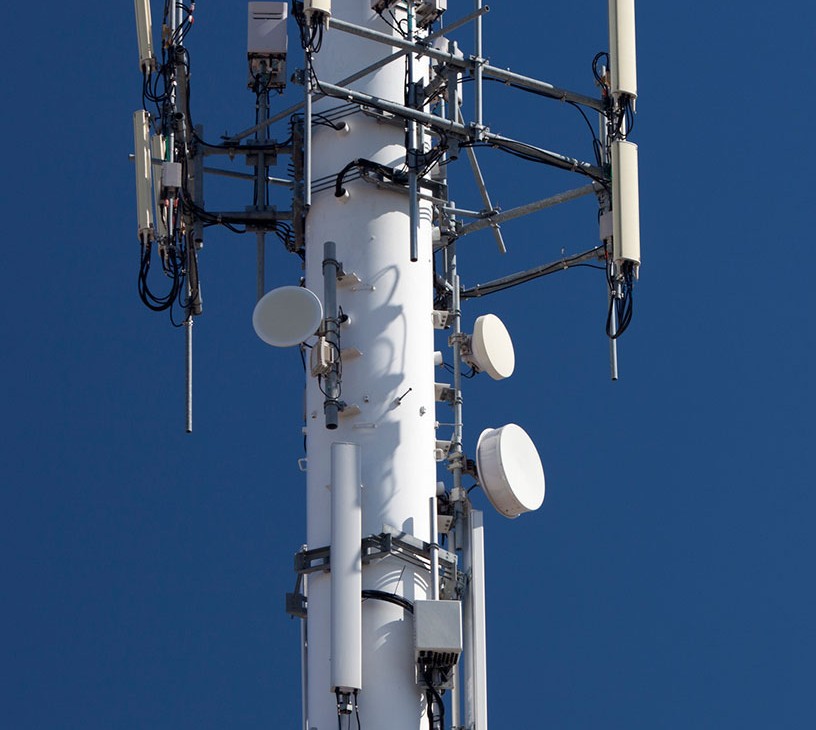
The ground-based towers segment is the foundation of wireless networks, indispensable for establishing broad geographical coverage. These structures, including lattice tower construction and monopole tower design, support heavy equipment loads, making them ideal for colocation infrastructure services.
This is critical as the industry manages a capital intensive industry model, where a focus on multi-tenant economics drives profitability.
The strategic necessity for ground-based towers is underscored by their role in remote community connectivity and in the initial rollout of next-generation networks.
However, deployment is often complicated by a challenging zoning approval process and community opposition nimbyism, which can delay projects.
Despite these regulatory compliance hurdles and the complexities of network rationalization initiatives, ground-based sites form the backbone of network resilience planning, ensuring service continuity.
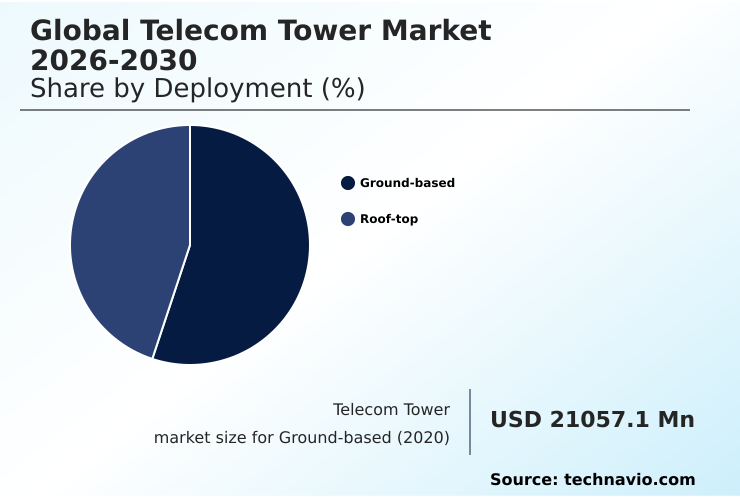
The Ground-based segment was valued at USD 26.79 billion in 2024 and showed a gradual increase during the forecast period.
Regional Analysis
APAC is estimated to contribute 56.9% to the growth of the global market during the forecast period.Technavio’s analysts have elaborately explained the regional trends and drivers that shape the market during the forecast period.
See How Telecom Tower Market Demand is Rising in APAC Get Free Sample
The geographic landscape of the market is defined by varying stages of technological adoption and infrastructure maturity.
APAC leads global growth, accounting for over 56% of the market's incremental opportunity, driven by massive investments in the radio access network and rapid urbanization. This region sees significant deployment of roof-top installations to support dense networks.
In contrast, mature regions like North America and Europe focus on enhancing existing assets through strategic tower sharing solutions and developing specialized private network tower solutions.
The implementation of cross-border 5G corridor projects and shared rural network initiatives highlights a move toward collaborative infrastructure.
Innovative off-grid power systems, such as the solar hybrid tower, are gaining traction globally, with some projects reducing diesel consumption by up to 35%. This trend, coupled with multi-tenant economics, underpins the strategy of global digital infrastructure providers.
Market Dynamics
Our researchers analyzed the data with 2025 as the base year, along with the key drivers, trends, and challenges. A holistic analysis of drivers will help companies refine their marketing strategies to gain a competitive advantage.
- Strategic planning in the telecom tower market requires a granular understanding of complex operational and financial trade-offs. The build-to-suit tower development process, for example, must be weighed against acquiring existing assets, with decisions influenced by the regulatory challenges in tower site acquisition.
- For portfolio owners, improving tower tenancy ratio metrics is a primary goal, often achieved by offering competitive colocation services for multiple wireless providers. The transition to 5G necessitates structural reinforcement for new 5G antennas and deploying fiber backhaul for macro towers, which significantly impacts capital planning.
- Businesses are increasingly evaluating the total cost of passive infrastructure divestment, factoring in the terms of the subsequent sale and leaseback agreement negotiation. A detailed comparison of monopole vs lattice tower cost is essential for site-specific deployments, just as understanding the criteria for ground-based vs rooftop site selection is for urban densification.
- Moreover, the industry must assess the long-term impact of M&A on tower lease rates and the potential disruption from the open ran impact on tower infrastructure. Managing opex for off-grid towers through sustainable energy sources is also becoming a key performance indicator.
- Firms that master these nuanced decisions, such as a disciplined approach to managing wind load on guyed towers, can achieve deployment timelines that are months shorter than their competitors.
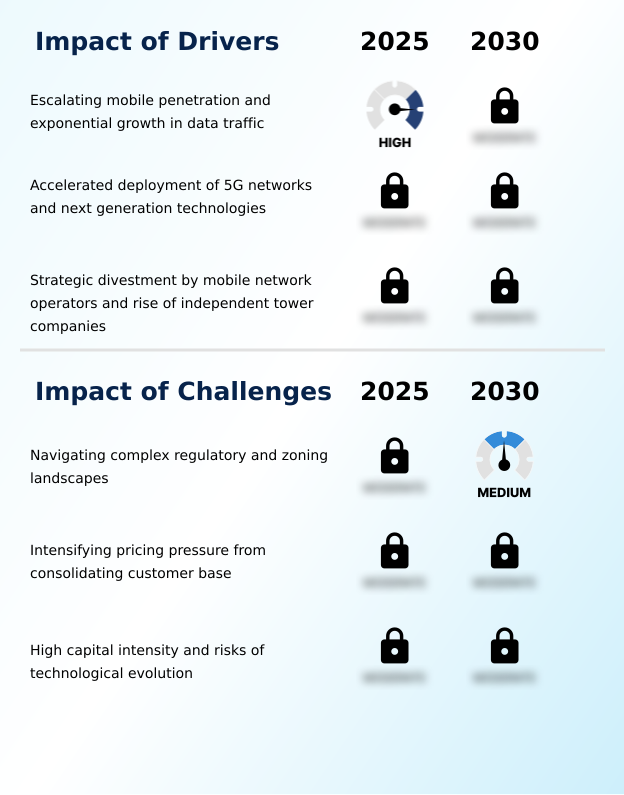
What are the key market drivers leading to the rise in the adoption of Telecom Tower Industry?
- Escalating mobile penetration and the exponential growth of data traffic serve as key drivers propelling market expansion.
- The global 5G network deployment is the principal market driver, mandating widespread network densification and the expansion of both macro tower sites and small cell networks.
- This technological shift has accelerated the adoption of an asset-light strategy among carriers, who increasingly favor the sale and leaseback model.
- This allows them to fund investments in next-generation networks while converting capital assets into operational expenses under a master lease agreement.
- Consequently, independent tower companies thrive by maximizing the tower tenancy ratio, which can boost asset ROI by over 50% compared to single-tenant captive sites.
- This efficient model is crucial for supporting the expansion of private 5G networks and diverse IoT connectivity offerings.
- Furthermore, M&A consolidation trends continue to reshape the customer landscape, while network resilience planning becomes a key consideration for all stakeholders involved in building out this critical infrastructure.
What are the market trends shaping the Telecom Tower Industry?
- The insatiable demand for data is a primary trend driving the market. It compels operators to implement continuous upgrades to network capacity.
- Key trends are reshaping passive tower infrastructure as the industry pivots to serve surging mobile data consumption. Strategic diversification is moving providers beyond simple leasing to become comprehensive digital infrastructure providers, integrating services like fiber optic backhaul and distributed antenna systems.
- The deployment of edge computing nodes at tower sites is emerging as a critical opportunity for smart city integration, creating new revenue streams. Simultaneously, there is a powerful shift toward sustainable telecom infrastructure, with tower companies implementing green energy solutions to achieve significant operational expenditure savings; certain solar hybrid projects have cut diesel generator use by 35%.
- This focus also mitigates asset obsolescence risk. To handle the data deluge, network capacity upgrades are constant, often requiring structural reinforcement of existing towers to support heavier 5G equipment. These upgrades have been shown to improve network throughput by over 40% in targeted urban zones.
What challenges does the Telecom Tower Industry face during its growth?
- Navigating complex and varied regulatory and zoning landscapes presents a key challenge affecting industry growth and deployment timelines.
- The market faces significant operational and structural challenges that can impede growth. The process for site acquisition services remains a primary hurdle, complicated by stringent zoning approval processes and community opposition nimbyism, which can delay projects by more than 18 months in some jurisdictions.
- As M&A consolidation trends continue, network rationalization initiatives often lead to site decommissioning churn, creating revenue uncertainty for tower owners. The capital intensive industry also grapples with the risk of technological disruption from alternatives like low earth orbit satellite constellations offering direct-to-device connectivity and the evolution of open ran architectures.
- These factors could alter long-term demand for tower sharing solutions and traditional urban rooftop infrastructure. Consequently, providers of wireless tower leasing and tower colocation services must innovate to maintain their value proposition in a rapidly changing technological and commercial landscape.
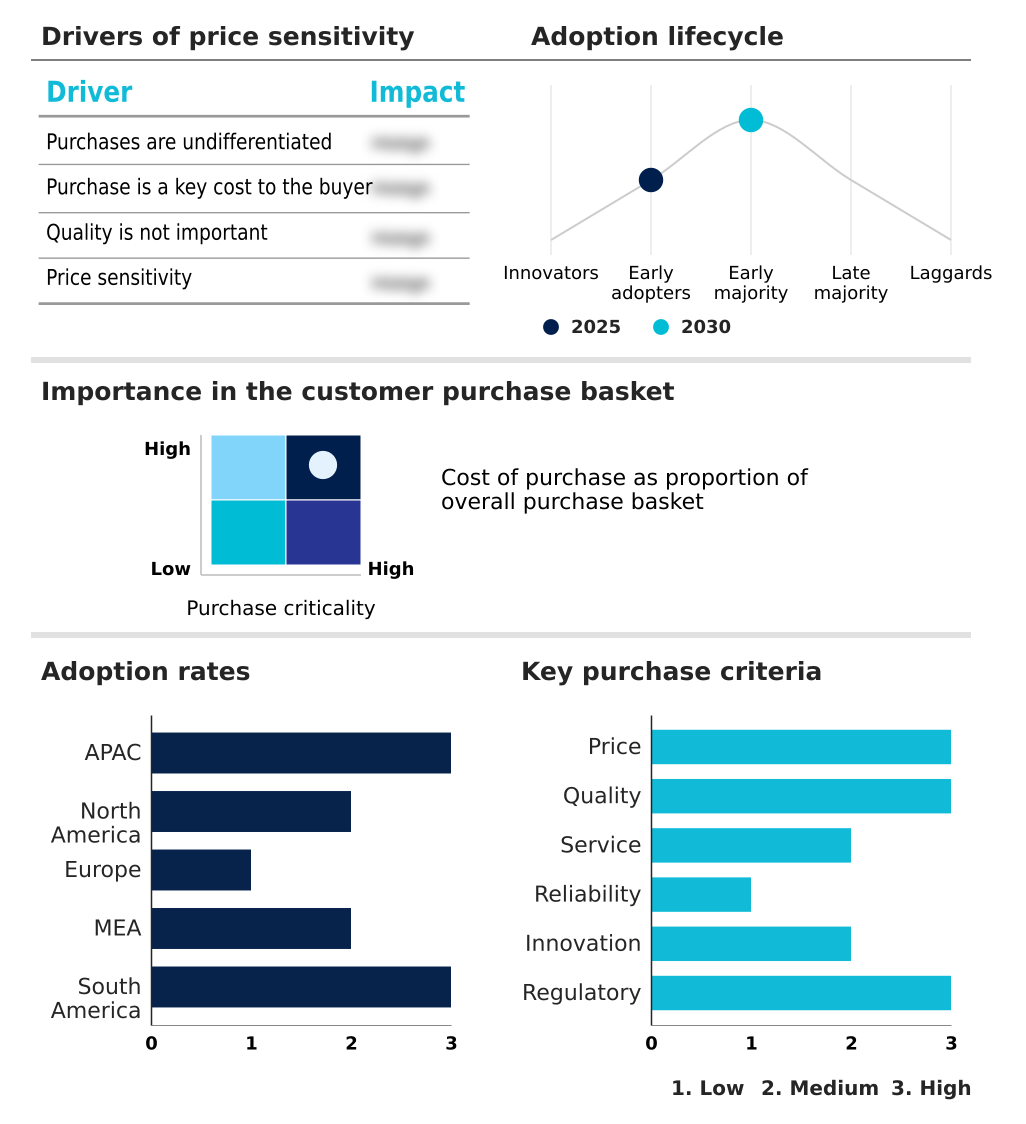
Exclusive Technavio Analysis on Customer Landscape
The telecom tower market forecasting report includes the adoption lifecycle of the market, covering from the innovator’s stage to the laggard’s stage. It focuses on adoption rates in different regions based on penetration. Furthermore, the telecom tower market report also includes key purchase criteria and drivers of price sensitivity to help companies evaluate and develop their market growth analysis strategies.
Customer Landscape of Telecom Tower Industry
Competitive Landscape
Companies are implementing various strategies, such as strategic alliances, telecom tower market forecast, partnerships, mergers and acquisitions, geographical expansion, and product/service launches, to enhance their presence in the industry.
American Tower Corp. - Offerings include wireless tower leasing and colocation infrastructure services, enabling network expansion and technology upgrades for telecommunication clients without direct asset ownership.
The industry research and growth report includes detailed analyses of the competitive landscape of the market and information about key companies, including:
- American Tower Corp.
- Atlas Tower Group
- Boldyn Networks
- China Tower Corp. Ltd.
- Crown Castle Inc.
- CTI Towers Inc.
- Diamond Communications LLC
- edotco Group Sdn Bhd
- Harmoni Towers
- Helios Towers plc
- IHS Holding Ltd.
- Phoenix Tower International
- SBA Communications Corp.
- Shared Access
- Sitios Latinoamerica SAB de CV
- Summit Digitel Ltd.
- Tillman Infrastructure LLC
- TOTEM
- Vantage Towers AG
- Vertical Bridge REIT LLC
Qualitative and quantitative analysis of companies has been conducted to help clients understand the wider business environment as well as the strengths and weaknesses of key industry players. Data is qualitatively analyzed to categorize companies as pure play, category-focused, industry-focused, and diversified; it is quantitatively analyzed to categorize companies as dominant, leading, strong, tentative, and weak.
Recent Development and News in Telecom tower market
- In January 2025, Vantage Towers, in partnership with TOTEM, Orange, and Telefonica, announced a joint initiative to establish a cross-border 5G highway corridor to support connected vehicle services.
- In January 2025, Rogers Communications announced the enhancement of its Internet of Things offerings with rSIM technology, aiming to provide more reliable connectivity for Canada's growing IoT ecosystem.
- In December 2024, Zain Group announced the acquisition of the remaining 70% stake in IHS Kuwait, gaining full control over its extensive portfolio of telecom towers to optimize network performance.
- In April 2025, EdgePoint Infrastructure launched Malaysia's first solar hybrid tower, which achieved a 35% reduction in diesel runtime, setting a new benchmark for sustainable infrastructure in the region.
Dive into Technavio’s robust research methodology, blending expert interviews, extensive data synthesis, and validated models for unparalleled Telecom Tower Market insights. See full methodology.
| Market Scope | |
|---|---|
| Page number | 326 |
| Base year | 2025 |
| Historic period | 2020-2024 |
| Forecast period | 2026-2030 |
| Growth momentum & CAGR | Accelerate at a CAGR of 3.8% |
| Market growth 2026-2030 | USD 10552.0 million |
| Market structure | Fragmented |
| YoY growth 2025-2026(%) | 3.6% |
| Key countries | China, India, Japan, Indonesia, South Korea, Singapore, US, Canada, Mexico, Germany, UK, France, Italy, Spain, The Netherlands, UAE, Saudi Arabia, South Africa, Nigeria, Kenya, Brazil, Argentina and Colombia |
| Competitive landscape | Leading Companies, Market Positioning of Companies, Competitive Strategies, and Industry Risks |
Research Analyst Overview
- The telecom tower market is fundamentally reshaping into a ecosystem of specialized digital infrastructure providers. The core business of wireless tower leasing and colocation infrastructure services is evolving with the demands of 5G network deployment, which requires extensive network densification through both macro tower sites and small cell networks.
- This has solidified the asset-light strategy for carriers, who now rely on the neutral host infrastructure of independent tower companies. These TowerCos focus on maximizing the tower tenancy ratio under long-term master lease agreements, with firms leveraging multi-tenant economics achieving a return on investment over two times greater than single-tenant models.
- The entire value chain, from site acquisition services to remote site management, is being optimized. This includes deploying distributed antenna systems and preparing for edge computing nodes. Growth requires continuous network capacity upgrades and structural reinforcement of ground-based towers, including lattice tower construction, monopole tower design, and guyed tower stability, alongside discreet urban rooftop infrastructure and stealth tower concealment.
- Managing this diverse portfolio, which includes everything from roof-top installations to ensuring power purchase agreements for green energy, is critical for future success.
What are the Key Data Covered in this Telecom Tower Market Research and Growth Report?
-
What is the expected growth of the Telecom Tower Market between 2026 and 2030?
-
USD 10.55 billion, at a CAGR of 3.8%
-
-
What segmentation does the market report cover?
-
The report is segmented by Deployment (Ground-based, and Roof-top), Business Segment (Operator-led tower companies, MNO captive sites, Independent tower companies, and Joint venture infrastructure companies), Type (Lattice towers, Monopole towers, Guyed towers, and Stealth towers) and Geography (APAC, North America, Europe, Middle East and Africa, South America)
-
-
Which regions are analyzed in the report?
-
APAC, North America, Europe, Middle East and Africa and South America
-
-
What are the key growth drivers and market challenges?
-
Escalating mobile penetration and exponential growth in data traffic, Navigating complex regulatory and zoning landscapes
-
-
Who are the major players in the Telecom Tower Market?
-
American Tower Corp., Atlas Tower Group, Boldyn Networks, China Tower Corp. Ltd., Crown Castle Inc., CTI Towers Inc., Diamond Communications LLC, edotco Group Sdn Bhd, Harmoni Towers, Helios Towers plc, IHS Holding Ltd., Phoenix Tower International, SBA Communications Corp., Shared Access, Sitios Latinoamerica SAB de CV, Summit Digitel Ltd., Tillman Infrastructure LLC, TOTEM, Vantage Towers AG and Vertical Bridge REIT LLC
-
Market Research Insights
- The market's momentum is shaped by the relentless rise in mobile data consumption, pushing digital infrastructure providers to support next-generation networks. The adoption of a sale and leaseback model is widespread, with M&A consolidation trends further concentrating the customer base.
- This shift fuels the need for sustainable telecom infrastructure, where deploying green energy solutions can cut operational expenditure savings by over 40% on off-grid power systems. This focus on efficiency is critical, as independent providers consistently achieve a tower tenancy ratio that is up to 25% higher than MNO captive sites.
- As the industry moves toward private 5G networks and expanded IoT connectivity offerings, managing these dynamics while planning for network resilience is paramount for sustained performance and profitability.
We can help! Our analysts can customize this telecom tower market research report to meet your requirements.
 RIA -
RIA - 
