
Tellurium Market Size 2026-2030
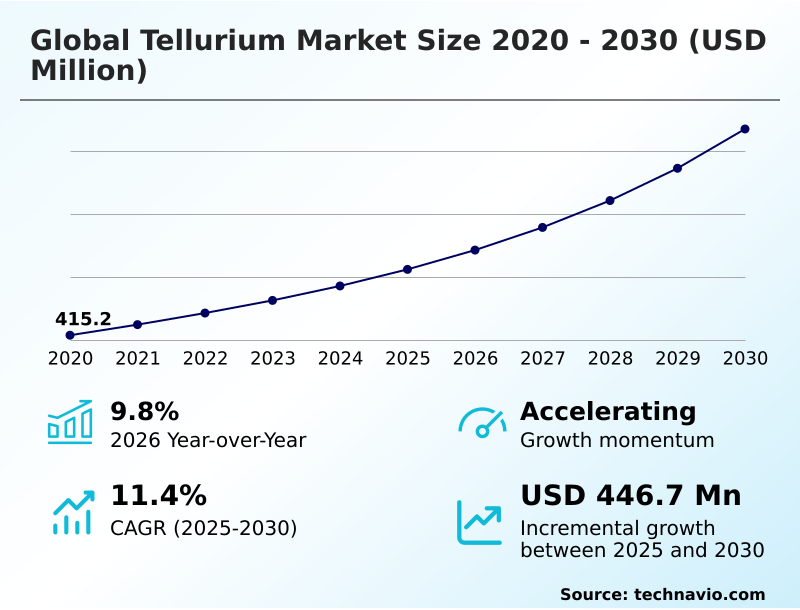
The Tellurium Market size was valued at USD 624.7 million in 2025, growing at a CAGR of 11.4% during the forecast period 2026-2030.
Major Market Trends & Insights
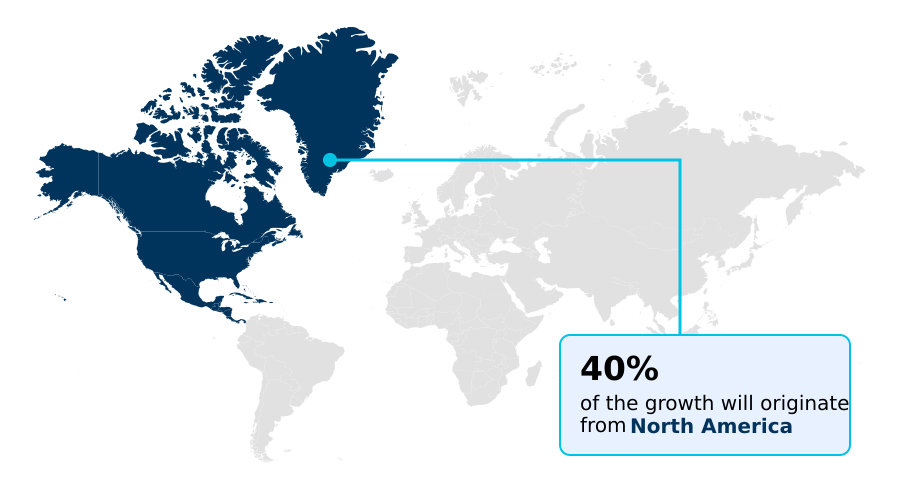
- North America dominated the market and accounted for a 39.7% growth during the forecast period.
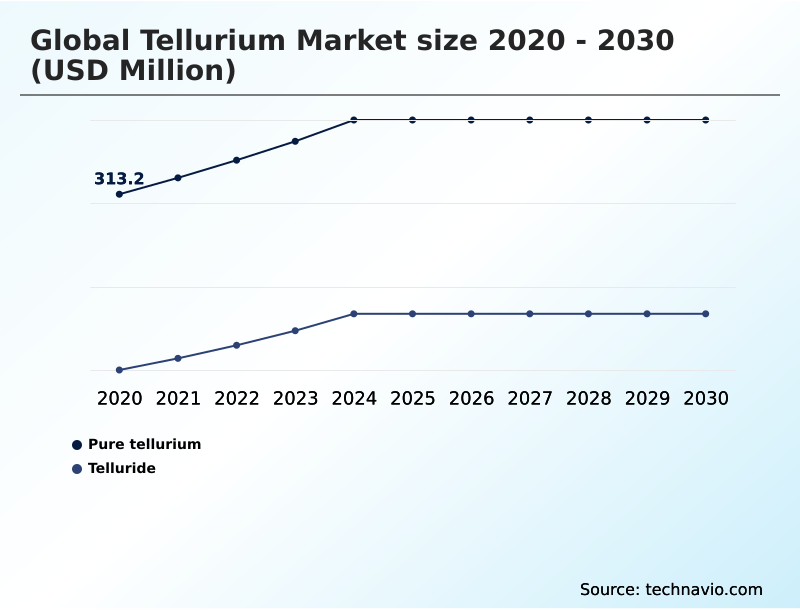
- By Type - Pure tellurium segment was valued at USD 402.4 million in 2024
- By Application - Solar panels segment accounted for the largest market revenue share in 2024
Market Size & Forecast
- Historic Market Opportunities 2020-2024: USD 656.2 million
- Market Future Opportunities 2025-2030: USD 446.7 million
- CAGR from 2025 to 2030 : 11.4%
Market Summary
- The tellurium market is defined by its dependency on copper refining, with over 90% of its global supply sourced as a byproduct from electrolytic processing.
- This linkage creates inherent supply volatility; for example, a 5% downturn in copper production can lead to significant price spikes for tellurium, impacting manufacturers of cadmium telluride (CdTe) solar panels who rely on stable input costs. A key driver is the expansion of utility-scale solar projects, where CdTe panels offer superior performance in high-temperature conditions compared to silicon-based alternatives.
- However, the market faces a significant challenge from the availability of substitutes. For instance, in thermoelectric applications, advancements in bismuth-free nanomaterials threaten to capture market share from traditional bismuth-telluride compounds. This dynamic forces producers to balance investments in high-purity refining for advanced electronics against the risk of material substitution in high-volume applications, shaping long-term strategic planning.
What will be the Size of the Tellurium Market during the forecast period?
Get Key Insights on Market Forecast (PDF) Request Free Sample
How is the Tellurium Market Segmented?
The tellurium industry research report provides comprehensive data (region-wise segment analysis), with forecasts and analysis for the period 2026-2030, as well as historical data from 2020-2024 for the following segments.
- Type
- Pure tellurium
- Telluride
- Application
- Solar panels
- Thermoelectric production
- Metallurgy
- Others
- Product
- Metal
- Powder
- Others
- Geography
- North America
- US
- Canada
- Mexico
- Europe
- Germany
- UK
- France
- APAC
- China
- Japan
- India
- Middle East and Africa
- Saudi Arabia
- UAE
- South Africa
- South America
- Brazil
- Argentina
- Colombia
- Rest of World (ROW)
- North America
How is the Tellurium Market Segmented by Type?
The pure tellurium segment is estimated to witness significant growth during the forecast period.
The pure tellurium segment is driven by high-purity applications, where grades exceeding 99.999% purity are essential for semiconductor materials, accounting for over 60% of specialty use cases.
This material is primarily recovered as a byproduct of electrolytic copper refining, where its extraction efficiency from copper anode slimes directly impacts supply availability.
For instance, optimized metallurgical processing can improve recovery rates by up to 15% compared to conventional methods. As a metallurgical additive, pure tellurium enhances the machinability of steel and copper, a critical factor in industrial manufacturing.
Its role as a deoxidizing agent and its thermoelectric properties also drive demand in niche electronics, making supply chain security a key operational focus for manufacturers reliant on this p-type semiconductor.
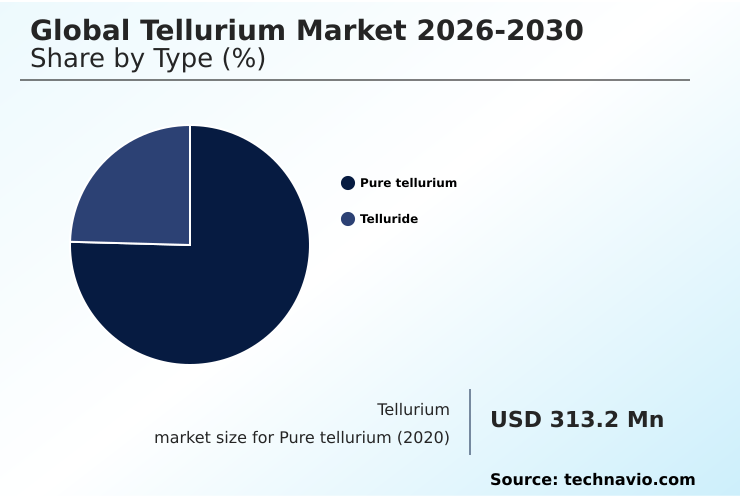
The Pure tellurium segment was valued at USD 402.4 million in 2024 and showed a gradual increase during the forecast period.
How demand for the Tellurium market is rising in the leading region?
North America is estimated to contribute 39.7% to the growth of the global market during the forecast period.Technavio’s analysts have elaborately explained the regional trends and drivers that shape the market during the forecast period.
See How Tellurium Market demand is rising in North America Request Free Sample
The geographic landscape of the tellurium market is dominated by APAC, which accounts for over 55% of global production, largely due to China's extensive copper smelting operations.
In contrast, North America, while contributing a smaller share of primary production at around 20%, leads in consumption for high-value applications.
The US market, for example, directs a significant portion of its tellurium consumption toward CdTe solar panel manufacturing, where conversion efficiency is a key performance metric. This differs from the metallurgical processing focus in some APAC nations.
This regional divergence in end-use creates distinct supply chain dynamics; North American firms prioritize supply chain security and strategic stockpiling due to high import reliance, while Chinese producers focus on optimizing byproduct recovery to serve both domestic and export markets.
This imbalance underscores the geopolitical risk inherent in the market's structure.
What are the key Drivers, Trends, and Challenges in the Tellurium Market?
Our researchers analyzed the data with 2025 as the base year, along with the key drivers, trends, and challenges. A holistic analysis of drivers will help companies refine their marketing strategies to gain a competitive advantage.
- Strategic analysis of the tellurium market for solar panels reveals a critical dependency on the material's unique properties, with CdTe technology holding a notable efficiency advantage in high-temperature climates over silicon-based alternatives. This segment's growth is directly tied to global renewable energy targets, influencing investment in sustainable tellurium extraction methods to meet demand without exacerbating environmental concerns.
- Concurrently, the use of bismuth telluride in thermoelectric production is expanding, driven by waste heat recovery applications in industrial and automotive sectors, which can improve energy efficiency by up to 8%.
- Understanding the cadmium telluride photovoltaic technology market is essential for forecasting, as it consumes a significant share of tellurium supply, making it a focal point for tellurium price volatility analysis. Fluctuations in copper refining output, the primary source of tellurium, can cause supply shifts of more than 10% annually.
- These tellurium supply chain disruption risks necessitate robust risk management strategies, including supplier diversification and investment in secondary recovery, to ensure operational continuity for downstream manufacturers. This interconnectedness highlights the complex balance between raw material availability, technological advancement, and market demand that defines the industry.
What are the key market drivers leading to the rise in the adoption of Tellurium Industry?
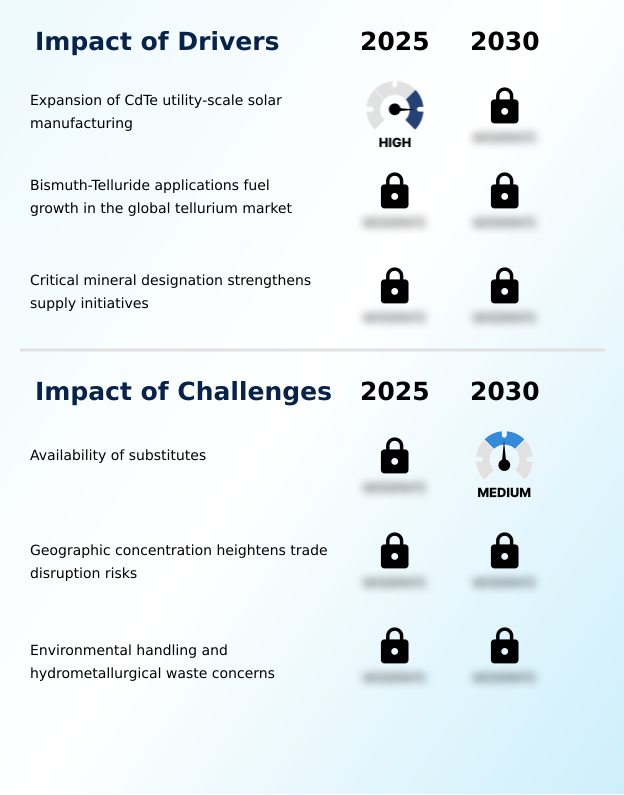
- The expansion of cadmium telluride utility-scale solar manufacturing is a primary driver for the tellurium market, stemming from its critical role in thin-film photovoltaic technology.
- The expansion of cadmium telluride (CdTe) utility-scale solar manufacturing, which now accounts for over 5% of the global solar market, is a significant driver increasing tellurium demand.
- This growth stems from CdTe technology's superior performance, including a 10-15% higher energy yield in hot climates compared to traditional silicon panels.
- The global push for industrial decarbonization directly translates into higher demand for CdTe modules, requiring tellurium as a key semiconductor component.
- This trend positions the expansion of CdTe solar manufacturing as a pivotal growth catalyst, reinforcing the need for stable supply chains to meet energy efficiency goals. The critical mineral designation of tellurium further strengthens this driver.
What are the market trends shaping the Tellurium Industry?
- Electrochemical leaching is emerging as a transformative trend, driving sustainable innovation by reducing the chemical footprint of tellurium recycling processes.
- A key trend reshaping the market is the adoption of advanced recycling processes like electrochemical leaching, which can improve tellurium recovery rates from industrial waste by up to 20% compared to traditional methods. This innovation addresses sustainability goals by minimizing hazardous waste from smelting operations and reducing the energy consumption of secondary production by over 30%.
- The driver behind this trend is the need to supplement limited primary production and mitigate supply chain disruption risks. For businesses, this supports circular economy principles and provides a more stable, economically viable source of secondary raw materials for critical applications like CdTe solar cells and bismuth-telluride thermoelectric devices.
What challenges does the Tellurium Industry face during its growth?
- The availability of and advancements in substitute materials, particularly in the solar and thermoelectric sectors, pose a significant challenge to the growth of the tellurium market.
- A primary challenge is the geographic concentration of tellurium production, with over 60% originating from China, heightening trade disruption risks and price volatility. This dependency makes the supply chain vulnerable to policy shifts, which can cause price spikes exceeding 25% in a short period.
- Downstream industries, including manufacturers of thermoelectric devices and solar panels, face significant procurement risks due to the lack of supply diversification. This vulnerability is compounded by environmental handling concerns related to hydrometallurgical waste from smelting operations, which adds compliance costs and limits production scalability, hindering the market's ability to meet rising demand from high-tech sectors.
Exclusive Technavio Analysis on Customer Landscape
The tellurium market forecasting report includes the adoption lifecycle of the market, covering from the innovator’s stage to the laggard’s stage. It focuses on adoption rates in different regions based on penetration. Furthermore, the tellurium market report also includes key purchase criteria and drivers of price sensitivity to help companies evaluate and develop their market growth analysis strategies.

Customer Landscape of Tellurium Industry
Competitive Landscape
Companies are implementing various strategies, such as strategic alliances, tellurium market forecast, partnerships, mergers and acquisitions, geographical expansion, and product/service launches, to enhance their presence in the industry.
Aurubis AG - Offerings center on high-purity tellurium and its compounds, primarily derived as byproducts from nonferrous metal refining, serving critical applications in solar and thermoelectric sectors.
The industry research and growth report includes detailed analyses of the competitive landscape of the market and information about key companies, including:
- Aurubis AG
- Boliden Group
- Central Drug House Pvt. Ltd.
- Dowa Holdings Co. Ltd.
- Hindustan Zinc Ltd.
- NAC Kazatomprom JSC
- Korea Zinc Co. Ltd
- Mitsubishi Materials Corp.
- PJSC MMC Norilsk Nickel
- Nyrstar
- Otto Chemie Pvt. Ltd.
- Sidhartha Metal
- Sumitomo Metal Mining Co. Ltd.
- Teck Resources Ltd.
- Umicore SA
- Zhuzhou Keneng New Material Co.
Qualitative and quantitative analysis of companies has been conducted to help clients understand the wider business environment as well as the strengths and weaknesses of key industry players. Data is qualitatively analyzed to categorize companies as pure play, category-focused, industry-focused, and diversified; it is quantitatively analyzed to categorize companies as dominant, leading, strong, tentative, and weak.
Market Intelligence Radar: High-Impact Developments & Growth Signals
- In the Diversified Metals and Mining industry, the implementation of critical mineral designation frameworks in North America and Europe has intensified efforts toward supply chain security for tellurium. This has led to government-backed initiatives promoting domestic byproduct recovery and strategic stockpiling, directly impacting tellurium availability for solar panel and thermoelectric production.
- The adoption of advanced hydrometallurgical and electrochemical leaching techniques for processing copper anode slimes is improving byproduct recovery rates for tellurium by over 10%. This technological shift enhances sustainable sourcing and supports circular economy principles by enabling more efficient extraction from both primary ores and secondary raw materials.
- Heightened geopolitical risk and trade disruption risks associated with concentrated smelting operations are compelling downstream consumers to prioritize supply diversification. This trend is fostering long-term agreements with producers in politically stable regions and driving investment in recycling infrastructure to mitigate price volatility.
- A surge in industrial decarbonization targets is accelerating the demand for materials enabling energy efficiency goals, directly increasing consumption of tellurium for waste heat recovery systems. This demand shift is causing a re-evaluation of tellurium's value within the mining portfolio, moving it from a minor byproduct to a strategic asset.
Dive into Technavio’s robust research methodology, blending expert interviews, extensive data synthesis, and validated models for unparalleled Tellurium Market insights. See full methodology.
| Market Scope | |
|---|---|
| Page number | 294 |
| Base year | 2025 |
| Historic period | 2020-2024 |
| Forecast period | 2026-2030 |
| Growth momentum & CAGR | Accelerate at a CAGR of 11.4% |
| Market growth 2026-2030 | USD 446.7 million |
| Market structure | Fragmented |
| YoY growth 2025-2026(%) | 9.8% |
| Key countries | US, Canada, Mexico, Germany, UK, France, Italy, Spain, The Netherlands, China, Japan, India, South Korea, Australia, Indonesia, Saudi Arabia, UAE, South Africa, Israel, Turkey, Brazil, Argentina and Colombia |
| Competitive landscape | Leading Companies, Market Positioning of Companies, Competitive Strategies, and Industry Risks |
Research Analyst Overview
- The tellurium market ecosystem is fundamentally shaped by upstream copper refiners, who control over 90% of the primary supply as a byproduct of their smelting operations. These raw material suppliers provide tellurium to specialized chemical producers and manufacturers, who then create high-purity metals and compounds like tellurium dioxide for end-users.
- The value chain is heavily influenced by the solar industry, which consumes a significant portion for CdTe photovoltaic manufacturing, where panels can achieve an energy payback period 15% shorter than silicon competitors. Distribution channels involve direct sales to large industrial consumers and specialized distributors for smaller-volume, high-purity applications in electronics and research.
- Regulatory bodies influence the market through critical mineral designation and environmental handling standards for hydrometallurgical waste, impacting both production costs and supply chain security for end-users in thermoelectric and metallurgical sectors.
What are the Key Data Covered in this Tellurium Market Research and Growth Report?
-
What is the expected growth of the Tellurium Market between 2026 and 2030?
-
The Tellurium Market is expected to grow by USD 446.7 million during 2026-2030, registering a CAGR of 11.4%. Year-over-year growth in 2026 is estimated at 9.8%%. This acceleration is shaped by expansion of cdte utility‑scale solar manufacturing, which is intensifying demand across multiple end-use verticals covered in the report.
-
-
What segmentation does the market report cover?
-
The report is segmented by Type (Pure tellurium, and Telluride), Application (Solar panels, Thermoelectric production, Metallurgy, and Others), Product (Metal, Powder, and Others) and Geography (North America, Europe, APAC, Middle East and Africa, South America). Among these, the Pure tellurium segment is estimated to witness significant growth during the forecast period, driven by rising adoption across key application areas. Each segment includes detailed qualitative and quantitative analysis, along with historical data from 2020-2024 and forecasts through 2030 with year-over-year growth rates.
-
-
Which regions are analyzed in the report?
-
The report covers North America, Europe, APAC, Middle East and Africa and South America. North America is estimated to contribute 39.7% to market growth during the forecast period. Country-level analysis includes US, Canada, Mexico, Germany, UK, France, Italy, Spain, The Netherlands, China, Japan, India, South Korea, Australia, Indonesia, Saudi Arabia, UAE, South Africa, Israel, Turkey, Brazil, Argentina and Colombia, with dedicated market size tables and year-over-year growth for each.
-
-
What are the key growth drivers and market challenges?
-
The primary driver is expansion of cdte utility‑scale solar manufacturing, which is accelerating investment and industry demand. The main challenge is availability of substitutes, creating operational barriers for key market participants. The report quantifies the impact of each driver and challenge across 2026 and 2030 with comparative analysis.
-
-
Who are the major players in the Tellurium Market?
-
Key vendors include Aurubis AG, Boliden Group, Central Drug House Pvt. Ltd., Dowa Holdings Co. Ltd., Hindustan Zinc Ltd., NAC Kazatomprom JSC, Korea Zinc Co. Ltd, Mitsubishi Materials Corp., PJSC MMC Norilsk Nickel, Nyrstar, Otto Chemie Pvt. Ltd., Sidhartha Metal, Sumitomo Metal Mining Co. Ltd., Teck Resources Ltd., Umicore SA and Zhuzhou Keneng New Material Co.. The report provides qualitative and quantitative analysis categorizing companies as dominant, leading, strong, tentative, and weak based on their market positioning. Company profiles include business segment analysis, SWOT assessment, key offerings, and recent strategic developments.
-
Market Research Insights
- The competitive landscape for tellurium is highly concentrated, with the top five producers, primarily diversified mining conglomerates, accounting for over 70% of global output. Companies such as Aurubis AG and Umicore SA are focusing on enhancing byproduct recovery efficiency to meet rising demand.
- For instance, recent process enhancements aim to increase tellurium yield from copper anode slimes by up to 10%, directly addressing supply chain security concerns from the renewable energy sector. This focus on optimization is a response to the growing demand for high-purity materials needed for advanced thermoelectric devices and CdTe solar panels.
- The primary challenge remains the market's reliance on copper production cycles, which dictates supply irrespective of tellurium-specific demand. To mitigate this, key players are also investing in advanced recycling technologies, creating a secondary supply stream to stabilize price volatility.
We can help! Our analysts can customize this tellurium market research report to meet your requirements.
 RIA -
RIA - 
