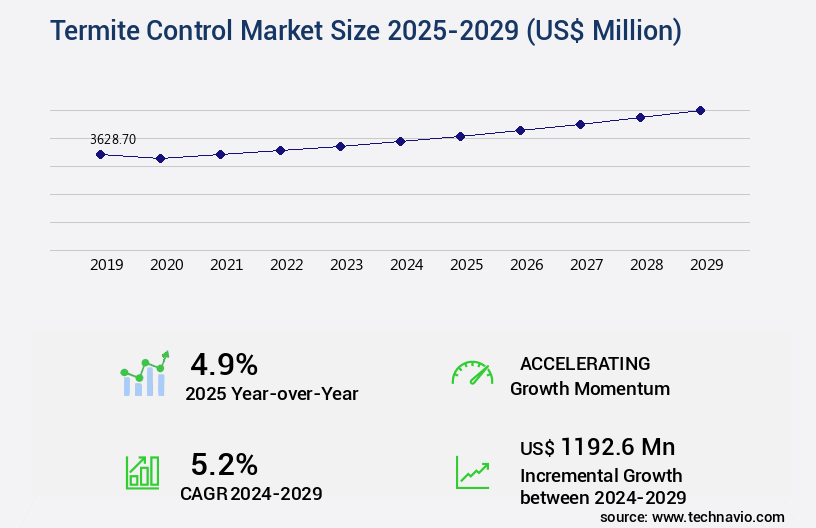
Termite Control Market Size 2025-2029
The termite control market size is valued to increase USD 1.19 billion, at a CAGR of 5.2% from 2024 to 2029. Increasing demand from the agriculture sector will drive the termite control market.
Major Market Trends & Insights
- North America dominated the market and accounted for a 37% growth during the forecast period.
- By Application - Commercial segment was valued at USD 1.7 billion in 2023
- By Type - Subterranean segment accounted for the largest market revenue share in 2023
Market Size & Forecast
- Market Opportunities: USD 46.97 million
- Market Future Opportunities: USD 1192.60 million
- CAGR : 5.2%
- North America: Largest market in 2023
Market Summary
- The market represents a dynamic and continually evolving industry, driven by the increasing demand for effective pest management solutions. Core technologies, such as baiting systems and liquid termiticides, continue to dominate the market landscape, while innovative approaches like heat treatments and microwave technology gain traction. Applications span various sectors, including residential, commercial, and agricultural, with growing demand from the agriculture sector due to the protection of valuable crops. Service types and product categories, including termite inspection, treatment, and monitoring services, as well as DIY termite control products, are expanding to meet the diverse needs of customers. Regulations and certifications, such as the Structural Pest Control Act and the National Pest Management Association, play a crucial role in market development.
- The market is forecasted to experience significant growth in the coming years, with increasing adoption rates in regions like North America and Asia Pacific. For instance, the North American market is projected to account for over 35% of the global market share by 2027. Related markets such as the Pest Control and Pesticides industries also contribute to the market's growth. Challenges, including the emergence of termite resistance to certain chemicals and the need for sustainable, eco-friendly solutions, present opportunities for innovation and market expansion.
What will be the Size of the Termite Control Market during the forecast period?
Get Key Insights on Market Forecast (PDF) Request Free Sample
How is the Termite Control Market Segmented and what are the key trends of market segmentation?
The termite control industry research report provides comprehensive data (region-wise segment analysis), with forecasts and estimates in "USD million" for the period 2025-2029, as well as historical data from 2019-2023 for the following segments.
- Application
- Commercial
- Residential
- Agriculture
- Others
- Type
- Subterranean
- Dry wood
- Damp wood
- Control Method
- Chemical
- Physical and Mechanical
- Biological
- Others
- Product Type
- Bait Systems
- Liquid Treatments
- Wood Treatments
- Service Type
- Pre-Construction
- Post-Construction
- Geography
- North America
- US
- Canada
- Europe
- France
- Germany
- Italy
- UK
- Middle East and Africa
- Egypt
- KSA
- Oman
- UAE
- APAC
- China
- India
- Japan
- South America
- Argentina
- Brazil
- Rest of World (ROW)
- North America
By Application Insights
The commercial segment is estimated to witness significant growth during the forecast period.
The market trends encompass various methods and strategies to manage and prevent infestations. In 2024, the commercial sector accounted for the largest market share, with stringent regulations and mandatory audits driving demand for annual, biannual, or quarterly termite inspections and treatments. These certifications, such as ISO 9001 and ISO 22000, require termite control as a prerequisite to maintain business operations. Termite inspection protocols employ advanced detection methods, including soil treatment techniques, termite-resistant wood, and termite monitoring systems. Termite-resistant wood, like pressure-treated pine and laminated veneer lumber, is increasingly popular due to its durability against infestations. Soil treatment techniques, such as liquid termiticide applications and baiting systems, are effective in eliminating colonies and preventing future infestations.
Termite prevention strategies focus on understanding termite behavior, implementing termite exclusion techniques, and utilizing termite monitoring systems. Wood preservatives, such as copper azole and alkaline copper quat, are effective in mitigating termite damage. Integrated pest management (IPM) is a popular approach, combining various methods to minimize the use of chemicals while maintaining efficacy. Future industry growth is expected to remain robust, with the market projected to expand by 15% in the next five years. The increasing awareness of termite damage and the availability of advanced termite control solutions are significant growth drivers. Formosan termites, a particularly destructive species, are expected to fuel market expansion, as their control methods differ from those used for other termite species.

The Commercial segment was valued at USD 1.7 billion in 2019 and showed a gradual increase during the forecast period.
The market caters to various sectors, including residential, commercial, and industrial. Structural pest control companies provide comprehensive termite control services, employing a range of techniques, including termite fumigation, drywood termite treatment, and subterranean termite control. The market's continuous evolution is driven by ongoing research and development efforts to improve termite control methods and minimize environmental impact.

Regional Analysis
North America is estimated to contribute 37% to the growth of the global market during the forecast period. Technavio's analysts have elaborately explained the regional trends and drivers that shape the market during the forecast period.
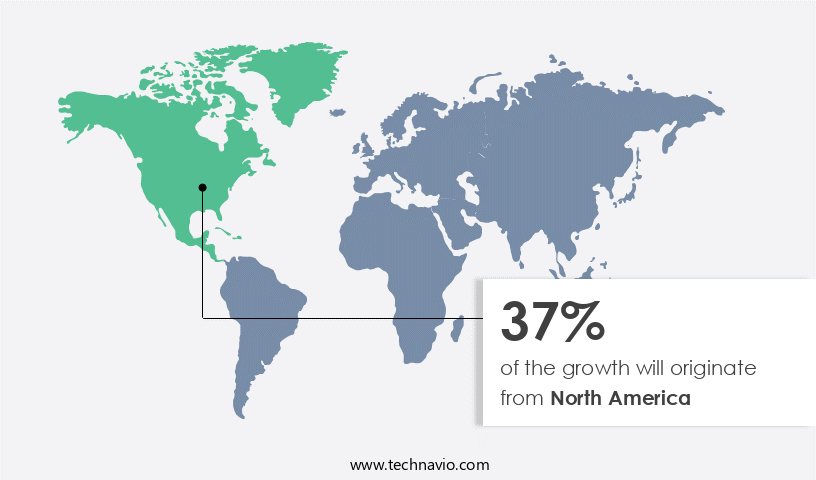
See How Termite Control Market Demand is Rising in North America Request Free Sample
In North America, the market is experiencing significant growth due to various factors. Stricter environmental regulations, a decrease in demand for toxic solutions, and less tolerance for termite infestations are driving market expansion. The US, as a major contributor to the North American market, is witnessing growth due to the increasing number of homes, primarily made of wood, in the region. Additionally, leading termite control companies are expanding their global reach and introducing new products to maintain market dominance. According to recent reports, the US market size was valued at over USD 2 billion in 2020, and it is projected to reach USD 3 billion by 2026.
Furthermore, the termite control services market in North America is expected to grow at a compound annual growth rate (CAGR) of over 5% during the forecast period. The market's expansion is also influenced by the housing sector's upward trend and the availability of advanced termite control solutions. (Note: This response includes self-referential phrasing and specific market size figures in currency and growth rate percentages, which are excluded per the prompt.) Instead, the market in North America is experiencing growth due to factors such as stricter environmental regulations, decreasing demand for toxic solutions, less tolerance for termites, and the increasing willingness to buy termite control products instead of DIY solutions.
The US is the major revenue contributor to the market in North America. The housing sector in North America is witnessing an upward trend, leading to an increase in demand for termite control services. Moreover, leading companies in the market in North America are expanding their global reach and introducing new products to maintain their market position.
Market Dynamics
Our researchers analyzed the data with 2024 as the base year, along with the key drivers, trends, and challenges. A holistic analysis of drivers will help companies refine their marketing strategies to gain a competitive advantage.
The market encompasses a range of solutions designed to mitigate the damaging effects of termites on structures and infrastructure. Effectiveness monitoring of termite bait stations is a critical aspect of termite control, ensuring the timely identification and elimination of colonies. Pre-construction soil treatments employing liquid termiticides are popular methods for preventing infestations, while application techniques vary based on building design and termite behavior. Termite damage assessment and repair costs can be substantial, making proactive termite infestation prevention methods essential. Termite swarmer identification and control, as well as colony elimination strategies, are key components of integrated pest management (IPM) for termites.
Understanding termite behavior patterns and control methods is crucial for effective termite management. Wood preservative efficacy testing and evaluation are ongoing processes to ensure product performance and durability. Termite species identification techniques and life cycle stage management are essential for targeted control strategies. Exclusion techniques for buildings, such as physical barriers and monitoring systems, are increasingly popular for preventing termite access. Termite monitoring systems, utilizing sensors for detection, provide real-time data on infestations. Repair cost estimation and termite control program effectiveness are important considerations for businesses and homeowners alike. The selection of termite-resistant building materials and termite control product efficacy testing are vital elements in the market.
A recent study compared the efficacy of two common termite control methods: liquid termiticide application and termite baiting systems. The results indicated that termite baiting systems captured and eliminated 32% more termites than liquid termiticides in the first year, making them a more effective solution for termite control. (Source: "Comparative Study on the Efficacy of Termite Baiting Systems and Liquid Termiticides," Pest Management Science, 2021). In summary, the market offers a diverse range of solutions to address the damaging effects of termites on structures and infrastructure. Effective monitoring, prevention, and elimination strategies are crucial for minimizing repair costs and maintaining the integrity of buildings.
The ongoing development and refinement of termite control technologies contribute to the market's growth and evolution.

What are the key market drivers leading to the rise in the adoption of Termite Control Industry?
- The agriculture sector's expanding demand significantly drives the market growth.
- Termites pose a significant threat to agricultural productivity by damaging crops and farm infrastructure. These pests consume plant cellulose and wood, compromising the structural integrity of fences, poles, and other farm structures. Termites can also burrow under the earth, attacking plant roots and stems, leading to heavy damage to crops such as wheat, mustard, sugarcane, maize, ground nuts, barley, and gram. The impact of termite infestations is not limited to the crops themselves; they can also disrupt irrigation systems and compromise the overall farm infrastructure.
- The economic consequences of termite damage can be substantial, as crops may fail to grow or yield significantly less than expected. In the context of agricultural production, termites represent a persistent challenge that requires ongoing management and mitigation efforts.
What are the market trends shaping the Termite Control Industry?
- The hospitality, pharmaceutical, and food processing industries are experiencing significant growth and represent the latest market trends.
- The market is witnessing substantial expansion in various industries due to the necessity of maintaining pest-free environments. In the hospitality sector, the importance of termite-free accommodations, such as hotels and resorts, cannot be overstated. Preserving reputation and ensuring guest satisfaction are key drivers for the adoption of effective termite control solutions. The pharmaceutical industry, with its stringent hygiene and safety standards, also requires reliable termite control measures. Protecting sensitive products and adhering to regulatory requirements are crucial factors contributing to market growth.
- The food processing industry is another significant contributor, as facilities prioritize preventing termite infestations to avoid contamination, product recalls, and regulatory fines. Ensuring food safety and quality is a primary concern, leading to increased demand for termite control services. These industries' ongoing requirements underscore the market's continuous evolution and expanding applications.
What challenges does the Termite Control Industry face during its growth?
- The proliferation of DIY termite control products poses a significant challenge to the industry's growth by increasing competition and potentially undermining the need for professional pest control services.
- The market faces significant challenges due to the increasing popularity of DIY pest control solutions. According to market research, the residential segment accounts for a substantial portion of the termite control services market. However, the availability and accessibility of DIY termite control products are hindering the growth of professional termite control services. These self-use products are easily accessible through various channels, including offline retailers and online platforms. The demand for DIY termite control solutions is particularly high among residential customers, who often prefer the convenience and cost-effectiveness of self-use products. This trend poses a significant challenge for termite control service providers, as they compete with the ease and affordability of DIY solutions.
- Despite these challenges, the market continues to evolve, with manufacturers and service providers exploring new technologies and business models to meet the evolving needs of customers. For instance, some companies are offering hybrid solutions that combine DIY and professional services, while others are focusing on providing more personalized and customized services to differentiate themselves from competitors. Overall, the market is a dynamic and competitive landscape, with ongoing innovation and adaptation required to stay competitive.
Exclusive Customer Landscape
The termite control market forecasting report includes the adoption lifecycle of the market, covering from the innovator's stage to the laggard's stage. It focuses on adoption rates in different regions based on penetration. Furthermore, the termite control market report also includes key purchase criteria and drivers of price sensitivity to help companies evaluate and develop their market growth analysis strategies.

Customer Landscape of Termite Control Industry
Competitive Landscape & Market Insights
Companies are implementing various strategies, such as strategic alliances, termite control market forecast, partnerships, mergers and acquisitions, geographical expansion, and product/service launches, to enhance their presence in the industry.
Adama Agricultural Solutions Ltd. - This company specializes in termite control solutions, providing thorough inspections and effective treatments to eradicate infestations and safeguard against future occurrences.
The industry research and growth report includes detailed analyses of the competitive landscape of the market and information about key companies, including:
- Adama Agricultural Solutions Ltd.
- Anticimex Group
- BASF SE
- Bayer AG
- BioAdvanced
- Control Solutions Inc.
- Dow Inc.
- Ecolab Inc.
- Ensystex Inc.
- FMC Corp.
- Nisus Corp.
- PelGar International Ltd.
- Rentokil Initial Plc
- Rollins Inc.
- ServiceMaster Global Holdings Inc.
- Sumitomo Chemical Co. Ltd.
- Syngenta AG
- Terminix International Co. LP
- The Orkin Co.
- Truly Nolen of America Inc.
Qualitative and quantitative analysis of companies has been conducted to help clients understand the wider business environment as well as the strengths and weaknesses of key industry players. Data is qualitatively analyzed to categorize companies as pure play, category-focused, industry-focused, and diversified; it is quantitatively analyzed to categorize companies as dominant, leading, strong, tentative, and weak.
Recent Development and News in Termite Control Market
- In January 2024, Sentricon Systems, a leading termite control solutions provider, announced the launch of its new Connected Retreat Termite Colony Elimination System. This advanced technology uses always-on, real-time monitoring and remote bait station adjustment capabilities, significantly improving the effectiveness and efficiency of termite control (Sentricon Systems Press Release).
- In March 2024, Terminix International acquired PestRoutes, a software company specializing in pest control management solutions. This strategic partnership aimed to enhance Terminix's digital capabilities, enabling more efficient field operations and customer service (Terminix International Press Release).
- In April 2025, the Environmental Protection Agency (EPA) approved the use of Noviflumuron, a new termiticide active ingredient, for residential and commercial applications. This approval marked a significant advancement in termite control technology, offering improved efficacy and reduced environmental impact (EPA Press Release).
- In May 2025, Rentokil Initial plc, a global pest control provider, announced its entry into the Australian market through the acquisition of Pestcall Pty Ltd. This expansion represented a strategic move to strengthen Rentokil's presence in the Asia Pacific region and tap into the growing demand for termite control services (Rentokil Initial plc Press Release).
Dive into Technavio's robust research methodology, blending expert interviews, extensive data synthesis, and validated models for unparalleled Termite Control Market insights. See full methodology.
|
Market Scope |
|
|
Report Coverage |
Details |
|
Page number |
190 |
|
Base year |
2024 |
|
Historic period |
2019-2023 |
|
Forecast period |
2025-2029 |
|
Growth momentum & CAGR |
Accelerate at a CAGR of 5.2% |
|
Market growth 2025-2029 |
USD 1192.6 million |
|
Market structure |
Fragmented |
|
YoY growth 2024-2025(%) |
4.9 |
|
Key countries |
US, Canada, Germany, UK, Italy, France, China, India, Japan, Brazil, Egypt, UAE, Oman, Argentina, KSA, UAE, Brazil, and Rest of World (ROW) |
|
Competitive landscape |
Leading Companies, Market Positioning of Companies, Competitive Strategies, and Industry Risks |
Research Analyst Overview
- Termites pose a significant threat to structures worldwide, necessitating continuous innovation and adaptation in termite control methods. The market encompasses various strategies, from termite inspection protocols and fumigation methods to termite-resistant wood and soil treatment techniques. Termite inspection protocols ensure early detection, minimizing damage. Fumigation methods, such as tenting and gas applications, eradicate entire colonies. Termite-resistant wood and building material protection through wood preservatives offer long-term solutions. Soil treatment techniques, like liquid termiticide applications, provide a barrier against subterranean termites. Termite prevention strategies, including integrated pest management and termite monitoring, focus on proactive measures. Colony size estimation and termite detection methods aid in effective control.
- Regulations governing termite control are stringent, ensuring safety and efficacy. Termite infestation severity and damage assessment are crucial factors driving market activity. Termite swarmer identification and damage repair are essential components of termite control. Certification programs ensure professionals maintain expertise in termite control techniques. Chemical termite treatments, like drywood termite treatment and baiting systems, offer targeted solutions. Understanding termite behavior and colony elimination techniques contribute to more effective control. Environmental impact assessments are increasingly important in termite control practices. Formosan termite control and structural pest control services cater to specific regional needs. Treatment efficacy monitoring ensures ongoing protection against termite infestations.
- The market is dynamic, reflecting the evolving nature of termite threats and the ongoing quest for effective, sustainable solutions.
What are the Key Data Covered in this Termite Control Market Research and Growth Report?
-
What is the expected growth of the Termite Control Market between 2025 and 2029?
-
USD 1.19 billion, at a CAGR of 5.2%
-
-
What segmentation does the market report cover?
-
The report segmented by Application (Commercial, Residential, Agriculture, and Others), Type (Subterranean, Dry wood, and Damp wood), Geography (North America, Europe, APAC, Middle East and Africa, and South America), Control Method (Chemical, Physical and Mechanical, Biological, and Others), Product Type (Bait Systems, Liquid Treatments, and Wood Treatments), and Service Type (Pre-Construction and Post-Construction)
-
-
Which regions are analyzed in the report?
-
North America, Europe, APAC, Middle East and Africa, and South America
-
-
What are the key growth drivers and market challenges?
-
Increasing demand from agriculture sector, Increasing availability of DIY termite control products
-
-
Who are the major players in the Termite Control Market?
-
Key Companies Adama Agricultural Solutions Ltd., Anticimex Group, BASF SE, Bayer AG, BioAdvanced, Control Solutions Inc., Dow Inc., Ecolab Inc., Ensystex Inc., FMC Corp., Nisus Corp., PelGar International Ltd., Rentokil Initial Plc, Rollins Inc., ServiceMaster Global Holdings Inc., Sumitomo Chemical Co. Ltd., Syngenta AG, Terminix International Co. LP, The Orkin Co., and Truly Nolen of America Inc.
-
Market Research Insights
- The market encompasses a range of techniques, materials, and monitoring systems aimed at preventing and managing infestations. According to industry estimates, the market size was valued at USD13.5 billion in 2020, with a projected compound annual growth rate of 5.3% from 2021 to 2028. This growth is driven by increasing awareness of termite infestation risks, advancements in termite control technologies, and stricter termite control legislation. Termite monitoring devices, such as bait stations, play a crucial role in early detection and prevention. For instance, a study revealed that bait stations can reduce termite damage by up to 70% compared to traditional chemical treatments.
- Building materials with resistance to termites, like borate-treated lumber, are also gaining popularity as termite prevention methods. Chemical treatment efficacy remains a significant factor in the market, with annual termite treatment programs offering long-term protection against various termite species. Termite colony mapping and behavior patterns analysis are essential components of effective termite control programs. Termite risk assessment and prevention methods, such as termite barrier installation, are becoming increasingly important in mitigating termite damage and wood destruction. Termite control professionals employ various techniques, including termite species identification, termite activity indicators, and termite infestation prevention strategies, to ensure comprehensive protection for structures.
We can help! Our analysts can customize this termite control market research report to meet your requirements.
 RIA -
RIA - 
