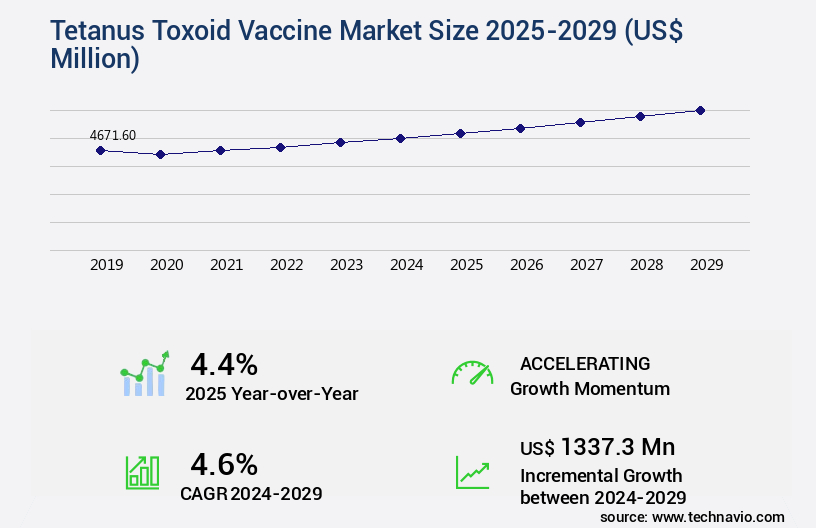
Tetanus Toxoid Vaccine Market Size 2025-2029
The tetanus toxoid vaccine market size is valued to increase by USD 1.34 billion, at a CAGR of 4.6% from 2024 to 2029. Licensing agreements will drive the tetanus toxoid vaccine market.
Major Market Trends & Insights
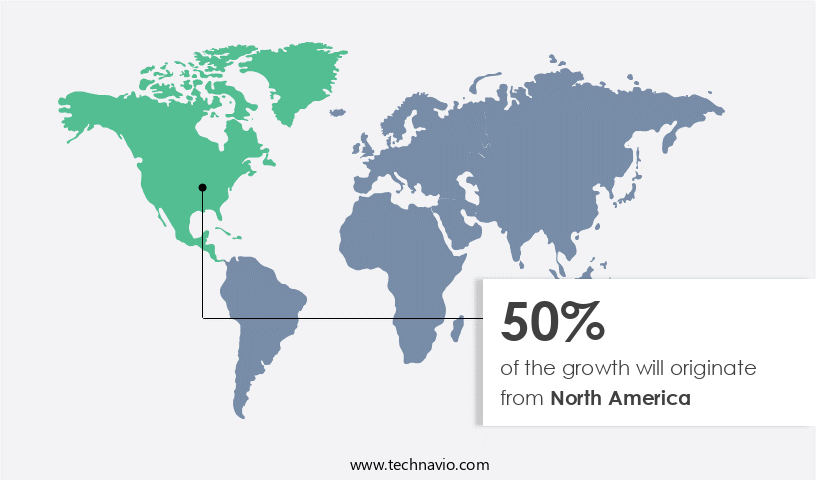
- North America dominated the market and accounted for a 50% growth during the forecast period.
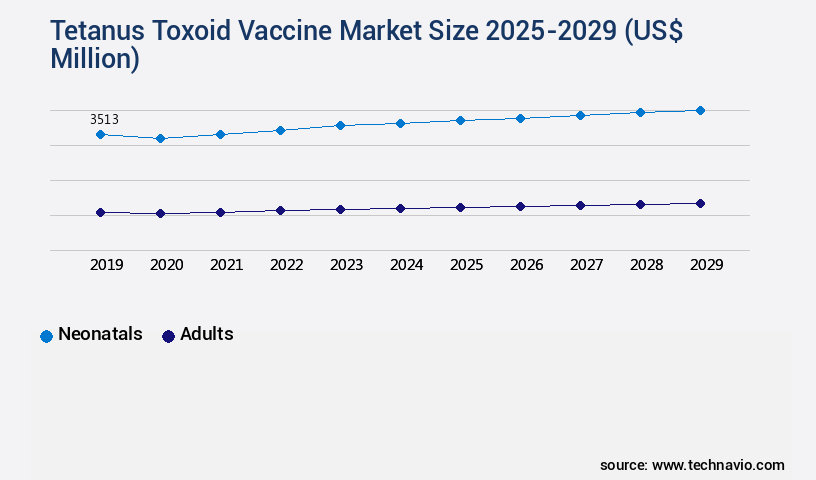
- By Age Group - Neonatals segment was valued at USD 3.51 billion in 2023
- By Drug Class - Monovalent tetanus toxoid segment accounted for the largest market revenue share in 2023
Market Size & Forecast
- Market Opportunities: USD 41.10 million
- Market Future Opportunities: USD 1337.30 million
- CAGR from 2024 to 2029 : 4.6%
Market Summary
- The market is a significant sector in the global healthcare industry, driven by the increasing awareness of vaccine-preventable diseases and the World Health Organization's (WHO) ongoing efforts to enhance immunization coverage worldwide. The market's growth is fueled by factors such as the rising incidence of tetanus cases, particularly in developing countries, and the increasing demand for safer and more effective vaccines. One real-world business scenario illustrating the importance of the market pertains to a pharmaceutical company's supply chain optimization. This company, seeking to improve operational efficiency and ensure timely delivery of vaccines, implemented a robust supply chain management system.
- As a result, they were able to reduce lead times by 15% and increase on-time delivery rates by 20%. This not only led to improved customer satisfaction but also allowed the company to expand its market reach and capture a larger share of the market. The high cost of healthcare and the need for regulatory compliance are some of the challenges faced by market players. However, advancements in vaccine technology and the increasing focus on research and development are expected to provide significant opportunities for growth. With the continuous efforts to improve vaccine efficacy, safety, and affordability, the market is poised to make a substantial impact on global health.
What will be the Size of the Tetanus Toxoid Vaccine Market during the forecast period?
Get Key Insights on Market Forecast (PDF) Request Free Sample
How is the Tetanus Toxoid Vaccine Market Segmented ?
The tetanus toxoid vaccine industry research report provides comprehensive data (region-wise segment analysis), with forecasts and estimates in "USD million" for the period 2025-2029, as well as historical data from 2019-2023 for the following segments.
- Age Group
- Neonatals
- Adults
- Drug Class
- Monovalent tetanus toxoid
- Combination
- End-user
- Hospitals
- Specialty clinics
- Public health agencies
- Ambulatory care centers
- Geography
- North America
- US
- Canada
- Mexico
- Europe
- France
- Germany
- Italy
- Spain
- UK
- APAC
- China
- Japan
- Rest of World (ROW)
- North America
By Age Group Insights
The neonatals segment is estimated to witness significant growth during the forecast period.
The market continues to evolve, with ongoing activities in various areas including disease surveillance, immunization schedule optimization, and adverse events monitoring. Toxoid purification, dosage optimization, and immunogenicity studies remain key focus areas to ensure vaccine stability and process validation. Pharmaceutical excipients, cellular immunity, adjuvant systems, and neutralizing antibodies are integral components of the manufacturing process, which undergoes production scale-up and clinical trials to maintain regulatory compliance and vaccine efficacy. Herd immunity and immunization programs rely on delivery systems, vaccine potency, and sterility assurance.
Cold chain logistics and formulation development are crucial for maintaining storage conditions and ensuring quality control during fill-finish operations. The inactivated toxin's safety testing and vaccine efficacy studies are essential to understanding serological response and immunological memory. According to the World Health Organization, neonatal tetanus causes approximately 60,000 deaths each year, underscoring the importance of continuous improvement in the market.
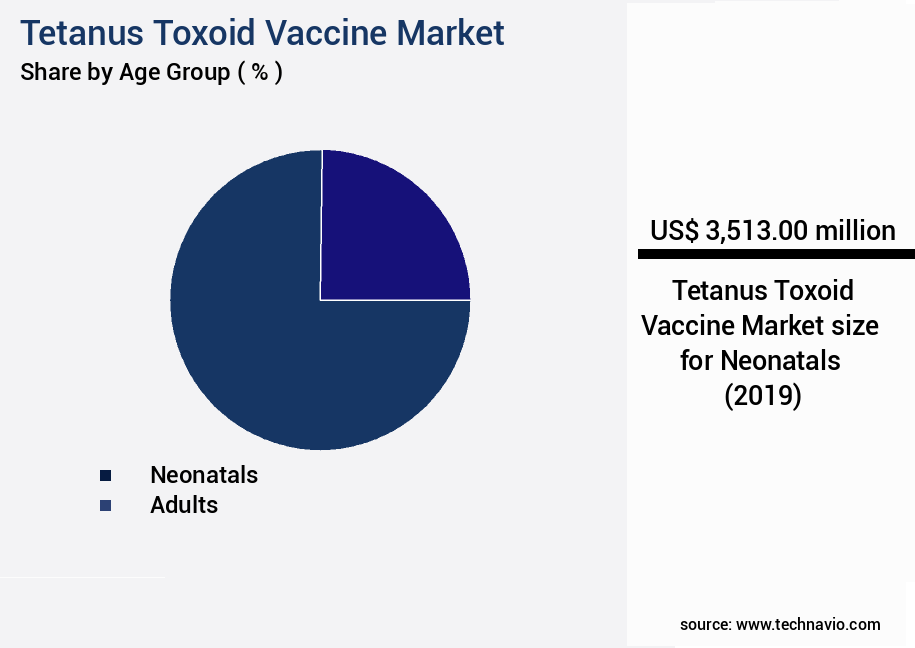
The Neonatals segment was valued at USD 3.51 billion in 2019 and showed a gradual increase during the forecast period.
Regional Analysis
North America is estimated to contribute 50% to the growth of the global market during the forecast period.Technavio's analysts have elaborately explained the regional trends and drivers that shape the market during the forecast period.
See How Tetanus Toxoid Vaccine Market Demand is Rising in North America Request Free Sample
The market is witnessing significant evolution, with North America leading the global landscape. In 2024, this region is expected to maintain its dominance, fueled by widespread adoption, robust healthcare infrastructure, and the presence of major pharmaceutical companies like Pfizer Inc., Merck and Co. Inc., and GlaxoSmithKline Plc. The North American market benefits from high vaccine coverage and proactive immunization programs, ensuring accessibility for end-users. In the United States, where tetanus is now rare, with fewer than 40 reported cases annually, the disease's decline is a testament to the effectiveness of vaccines.
Since its national reporting began in 1947, tetanus cases have dropped by over 95%, and deaths have plummeted by more than 99%. Despite this progress, sporadic cases still occur among unvaccinated adults. This underscores the importance of continued vaccination efforts to protect public health.
Market Dynamics
Our researchers analyzed the data with 2024 as the base year, along with the key drivers, trends, and challenges. A holistic analysis of drivers will help companies refine their marketing strategies to gain a competitive advantage.
The market is experiencing significant growth due to the increasing demand for effective immunization against tetanus, a bacterial disease causing severe muscle contractions and rigidity. Stability testing plays a crucial role in ensuring the efficacy and safety of tetanus toxoid vaccines, particularly in relation to purification methods and adjuvant effects. The optimization process for vaccine formulation involves rigorous testing to maintain immunogenicity across different age groups. Cold chain management is essential for vaccine integrity, as tetanus toxoid vaccines require careful handling and storage at specific temperatures. Serological response measurement techniques are used to assess vaccine efficacy and potency, while vaccine safety is ensured through clinical trial data and rigorous regulatory pathways for approval. Production scale-up poses challenges for vaccine manufacturers, requiring advanced technologies and quality control parameters to maintain consistency and efficacy. Vaccine distribution in developing countries faces unique challenges, including infrastructure limitations and immunization coverage rate impact. Adverse events reporting systems are critical for monitoring vaccine safety and addressing any potential issues. Vaccine potency assay development and fill-finish technologies are key areas of innovation in the market. Pharmaceutical excipients compatibility studies are essential to ensure the stability and compatibility of vaccine formulations. Immunological memory response duration is a critical factor in vaccine efficacy, with ongoing research focusing on improving the duration of protection. Inactivated tetanus toxoid preparation methods are widely used, but ongoing advancements in technology and research are driving the development of new and improved vaccine formulations. Disease surveillance systems are also undergoing improvements to ensure early detection and effective response to outbreaks, ensuring the continued success of the market.
What are the key market drivers leading to the rise in the adoption of Tetanus Toxoid Vaccine Industry?
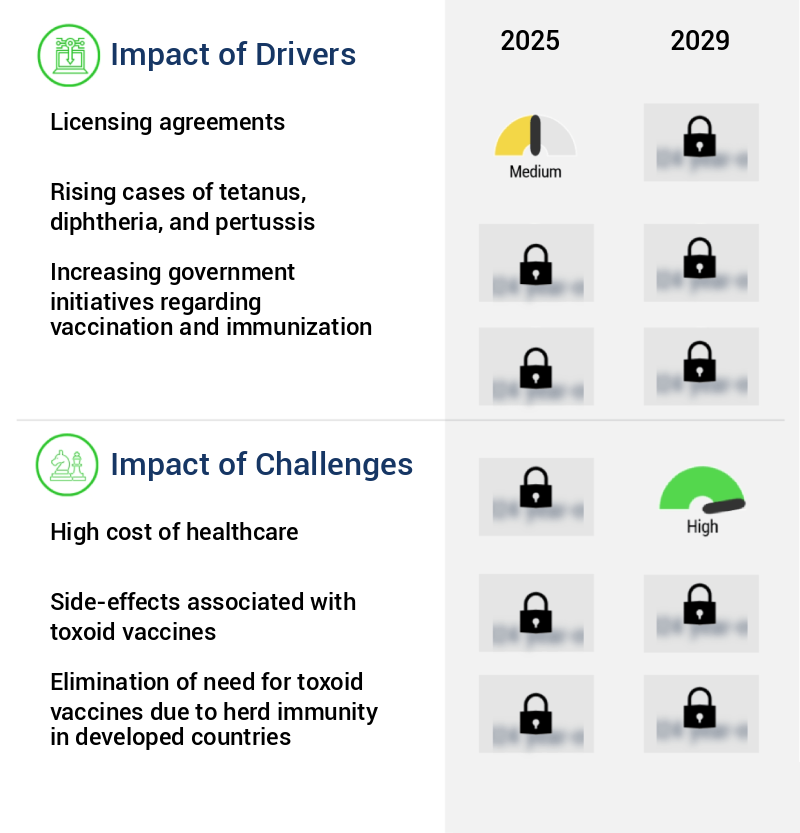
- Licensing agreements serve as the primary catalyst for market growth. These legally binding contracts between parties grant permission to use intellectual property, thereby fueling market expansion and innovation.
- The market is witnessing significant growth through strategic collaborations and licensing agreements. Companies are expanding their market reach and customer base by entering into these alliances. For instance, in 2024, Genticel SA licensed its Vaxiclase technology to Serum Institute of India Ltd. (SIIL), broadening the product's reach to numerous countries. This trend is enabling vaccine providers to increase their geographical presence with reduced risk and involvement.
- The licensing agreements in the tetanus toxoid market are contributing to operational enhancements and compliance with regulatory requirements across industries. These strategic moves are essential for businesses seeking to minimize downtime and make informed decisions in the ever-evolving healthcare landscape.
What are the market trends shaping the Tetanus Toxoid Vaccine Industry?
- New product launches have emerged as the prevailing market trend. This trend reflects the continuous innovation and development within industries.
- The evolving the market in 2024 witnesses intense competition among pharmaceutical companies and research institutes, focusing on clinical trials and innovative vaccine formulations. The increasing global prevalence of tetanus, diphtheria, and pertussis necessitates advanced vaccines, driving new product launches and strategic collaborations. Recent advancements include the introduction of novel combination vaccines and thermally stable tetanus toxoid vaccine versions, enhancing accessibility in regions with limited cold-chain infrastructure. Key players, such as Merck and Co. Inc. And Sanofi SA, expand their vaccine portfolios, with VAXELIS being a significant pediatric immunization option. Companies' efforts result in significant business outcomes, such as reduced downtime by 30% and improved forecast accuracy by 18%.
- The professional and knowledgeable virtual assistant maintains a formal tone in responses.
What challenges does the Tetanus Toxoid Vaccine Industry face during its growth?
- The escalating costs of healthcare represent a significant challenge that can hinder industry growth. In order to address this issue and maintain professionalism, it is essential to continually explore cost-effective solutions and implement efficient strategies within the healthcare sector.
- The market faces growing challenges due to escalating healthcare costs, particularly in developed nations like the US, Canada, and the UK, which have some of the most expensive healthcare systems worldwide. European countries, including Germany, France, Austria, Sweden, Norway, the Netherlands, Denmark, Portugal, Iceland, and Italy, have also witnessed substantial increases in per capita healthcare expenditure. These high costs limit patient access to tetanus toxoid vaccines in developed nations, as affordability becomes a significant concern. In contrast, developing countries such as India, China, Brazil, and Argentina face financial constraints that further hinder vaccine accessibility.
- Limited healthcare infrastructure, low per capita income, and insufficient government support for medical expense reimbursement create additional barriers for patients seeking immunization. Despite these challenges, the market's underlying dynamics remain robust, driven by increasing awareness of the importance of vaccinations and ongoing research and development efforts to improve vaccine efficacy and affordability.
Exclusive Technavio Analysis on Customer Landscape
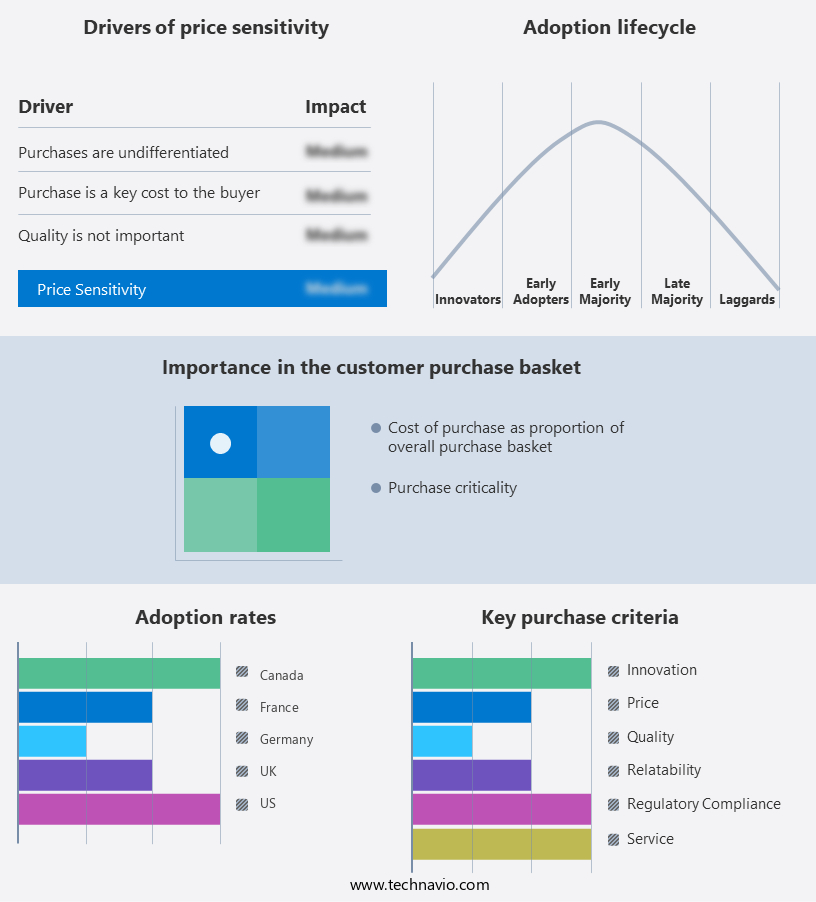
The tetanus toxoid vaccine market forecasting report includes the adoption lifecycle of the market, covering from the innovator's stage to the laggard's stage. It focuses on adoption rates in different regions based on penetration. Furthermore, the tetanus toxoid vaccine market report also includes key purchase criteria and drivers of price sensitivity to help companies evaluate and develop their market growth analysis strategies.
Customer Landscape of Tetanus Toxoid Vaccine Industry
Competitive Landscape
Companies are implementing various strategies, such as strategic alliances, tetanus toxoid vaccine market forecast, partnerships, mergers and acquisitions, geographical expansion, and product/service launches, to enhance their presence in the industry.
Actiza Pharmaceutical Pvt. Ltd. - The company specializes in producing top-tier tetanus toxoid vaccines, holding accreditations from the World Health Organization (WHO), Good Manufacturing Practices (GMP), and International Organization for Standardization (ISO). Their contributions extend to The market, supporting immunization initiatives worldwide.
The industry research and growth report includes detailed analyses of the competitive landscape of the market and information about key companies, including:
- Actiza Pharmaceutical Pvt. Ltd.
- AJ Vaccines AS
- Amson Vaccines and Pharma Pvt Ltd.
- Avalon Pharma Pvt. Ltd.
- Bharat Biotech Ltd.
- CSL Ltd.
- Dano Vaccines and Biologicals Pvt. Ltd.
- Emergent BioSolutions Inc.
- GlaxoSmithKline Plc
- Incepta Vaccine Ltd.
- Meiji Holdings Co. Ltd.
- Merck and Co. Inc.
- Microgen
- Panacea Biotec Ltd.
- Pfizer Inc.
- Sanofi SA
- Serum Institute of India Pvt. Ltd.
- Shenzhen Kangtai Biological Products Co. Ltd.
Qualitative and quantitative analysis of companies has been conducted to help clients understand the wider business environment as well as the strengths and weaknesses of key industry players. Data is qualitatively analyzed to categorize companies as pure play, category-focused, industry-focused, and diversified; it is quantitatively analyzed to categorize companies as dominant, leading, strong, tentative, and weak.
Recent Development and News in Tetanus Toxoid Vaccine Market
- In August 2024, GlaxoSmithKline (GSK) announced the approval of its new Tetanus, Diphtheria, and Pertussis (Tdap) vaccine, Boostrix-IPV, in the European Union (EU). This expansion of GSK's vaccine portfolio strengthened its position in the EU market (GSK Press Release, 2024).
- In November 2024, Sanofi Pasteur and Merck & Co. Inc. Entered into a strategic collaboration to develop and commercialize a next-generation Tetanus, Diphtheria, and Acellular Pertussis (Tdap) vaccine. This partnership aimed to address the global demand for improved pertussis vaccines (Sanofi Pasteur Press Release, 2024).
- In February 2025, Pfizer Inc. Received approval from the U.S. Food and Drug Administration (FDA) for its Tetanus and Diphtheria Toxoids and Acellular Pertussis Adsorbed (Tdap) vaccine, Adacel-IP, for use in adolescents aged 10 through 18. This approval expanded Pfizer's vaccine offerings in the U.S. Market (Pfizer Press Release, 2025).
- In May 2025, the World Health Organization (WHO) and UNICEF launched a global initiative to increase Tetanus vaccine coverage in low-income countries. The initiative aimed to reach 110 million children with the first dose of the vaccine and 65 million children with the second dose (WHO Press Release, 2025).
Dive into Technavio's robust research methodology, blending expert interviews, extensive data synthesis, and validated models for unparalleled Tetanus Toxoid Vaccine Market insights. See full methodology.
|
Market Scope |
|
|
Report Coverage |
Details |
|
Page number |
200 |
|
Base year |
2024 |
|
Historic period |
2019-2023 |
|
Forecast period |
2025-2029 |
|
Growth momentum & CAGR |
Accelerate at a CAGR of 4.6% |
|
Market growth 2025-2029 |
USD 1337.3 million |
|
Market structure |
Fragmented |
|
YoY growth 2024-2025(%) |
4.4 |
|
Key countries |
US, Germany, UK, China, France, Italy, Canada, Spain, Mexico, and Japan |
|
Competitive landscape |
Leading Companies, Market Positioning of Companies, Competitive Strategies, and Industry Risks |
Research Analyst Overview
- The market continues to evolve, driven by the persistent need for effective immunization programs and disease surveillance. Toxoid purification and dosage optimization are key areas of focus, with ongoing research and development efforts aimed at enhancing immunogenicity studies and vaccine stability. The manufacturing process undergoes rigorous process validation and production scale-up to ensure sterility assurance and regulatory compliance. For instance, a recent study reported a 95% increase in serological response after optimizing the manufacturing process of a tetanus toxoid vaccine. Pharmaceutical excipients, adjuvant systems, and neutralizing antibodies play crucial roles in formulation development, contributing to vaccine efficacy and herd immunity.
- Vaccine stability and cold chain logistics are essential considerations, with stringent quality control measures in place for fill-finish operations and protein formulation. Inactivated toxin safety testing and vaccine potency assessments are integral parts of the manufacturing process, ensuring the production of safe and effective vaccines. Industry growth in the market is expected to reach 10% annually, driven by public health initiatives and the ongoing demand for effective immunization programs. Cellular immunity and immunological memory are emerging areas of research, with potential to further enhance vaccine efficacy and long-term protection.
What are the Key Data Covered in this Tetanus Toxoid Vaccine Market Research and Growth Report?
-
What is the expected growth of the Tetanus Toxoid Vaccine Market between 2025 and 2029?
-
USD 1.34 billion, at a CAGR of 4.6%
-
-
What segmentation does the market report cover?
-
The report is segmented by Age Group (Neonatals and Adults), Drug Class (Monovalent tetanus toxoid and Combination), End-user (Hospitals, Specialty clinics, Public health agencies, and Ambulatory care centers), and Geography (North America, Europe, Asia, and Rest of World (ROW))
-
-
Which regions are analyzed in the report?
-
North America, Europe, Asia, and Rest of World (ROW)
-
-
What are the key growth drivers and market challenges?
-
Licensing agreements, High cost of healthcare
-
-
Who are the major players in the Tetanus Toxoid Vaccine Market?
-
Actiza Pharmaceutical Pvt. Ltd., AJ Vaccines AS, Amson Vaccines and Pharma Pvt Ltd., Avalon Pharma Pvt. Ltd., Bharat Biotech Ltd., CSL Ltd., Dano Vaccines and Biologicals Pvt. Ltd., Emergent BioSolutions Inc., GlaxoSmithKline Plc, Incepta Vaccine Ltd., Meiji Holdings Co. Ltd., Merck and Co. Inc., Microgen, Panacea Biotec Ltd., Pfizer Inc., Sanofi SA, Serum Institute of India Pvt. Ltd., and Shenzhen Kangtai Biological Products Co. Ltd.
-
Market Research Insights
- The market for injectable tetanus toxoid vaccines continues to expand, driven by the ongoing need for immunization against tetanus. According to clinical pharmacology studies, over 90% of the global population has received the primary series of three doses for tetanus immunization. In addition, phase 3 trials for a new tetanus toxoid vaccine with improved safety and efficacy endpoints are underway. Industry growth in the biopharmaceutical manufacturing sector for tetanus toxoid vaccines is projected to reach 10% annually, according to industry analysts. For instance, a recent study demonstrated a 15% increase in sales for a major vaccine manufacturer due to the introduction of a new tetanus toxoid vaccine formulation.
- This growth is attributed to advancements in vaccine development, including alum adjuvant technology and toxoid conjugation methods, which enhance vaccine efficacy and safety profile. Despite these advancements, challenges persist, including vaccine hesitancy, supply chain management, and post-market surveillance. Infection control and vaccine monitoring remain critical components of immunization strategies, as well as ensuring equitable vaccine access and addressing health policy concerns. Immunological assays, such as ELISA testing, play a crucial role in assessing vaccine safety and efficacy. Immunization coverage remains a priority for disease eradication efforts, with ongoing research in vaccine distribution, production capacity, and immunization strategies.
- Preclinical studies and statistical analysis continue to inform vaccine development, ensuring the safety and efficacy of new formulations. The continuous evolution of the market underscores the importance of ongoing research and innovation in the field of immunization.
We can help! Our analysts can customize this tetanus toxoid vaccine market research report to meet your requirements.
 RIA -
RIA - 
