Pharmaceutical Excipients Market Size 2025-2029
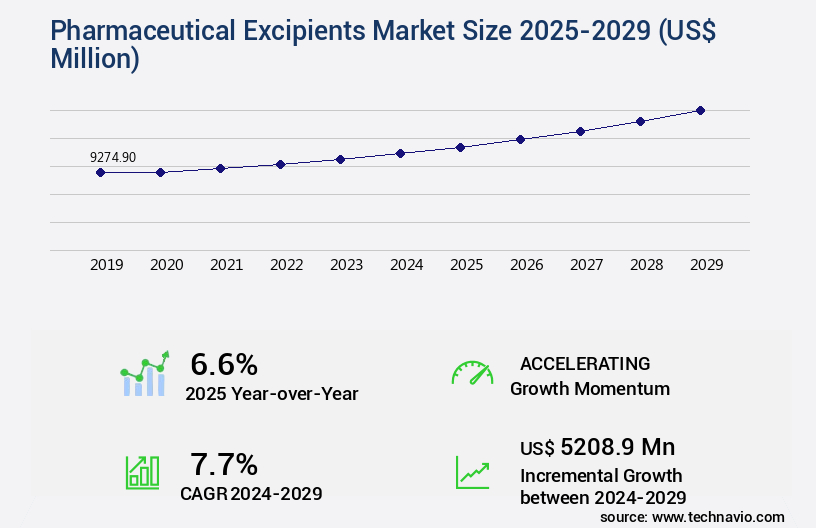
The pharmaceutical excipients market size is valued to increase USD 5.21 billion, at a CAGR of 7.7% from 2024 to 2029. Increasing demand for functional excipients will drive the pharmaceutical excipients market.
Major Market Trends & Insights
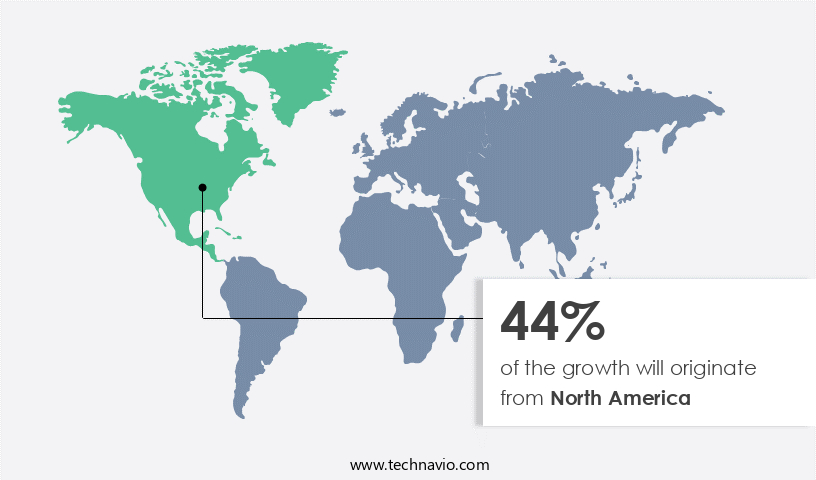
- North America dominated the market and accounted for a 44% growth during the forecast period.
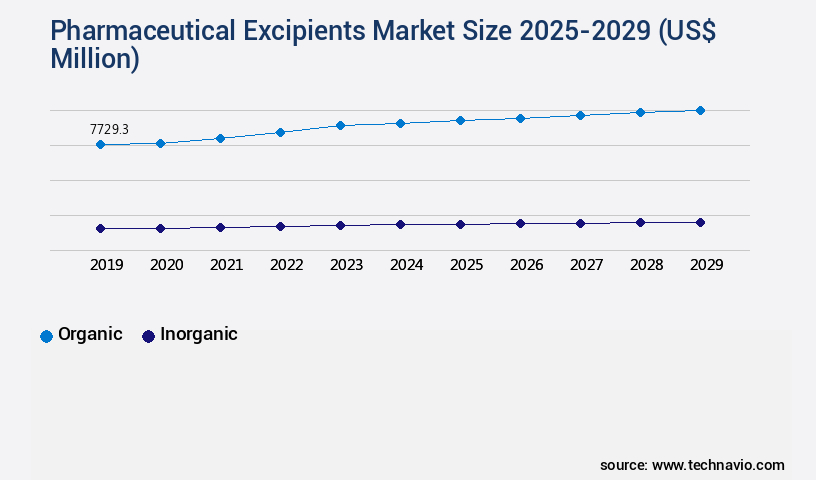
- By Type - Organic segment was valued at USD 7.73 billion in 2023
- By Product - Binders and fillers segment accounted for the largest market revenue share in 2023
Market Size & Forecast
- Market Opportunities: USD 80.78 billion
- Market Future Opportunities: USD 5.21 billion
- CAGR : 7.7%
- North America: Largest market in 2023
Market Summary
- The market encompasses a diverse range of inactive ingredients used in the formulation of pharmaceutical drugs. Core technologies and applications, such as wet granulation and direct compression, continue to evolve, driving the demand for advanced excipients. Service types or product categories, including functional excipients and binding agents, are in high demand due to their role in improving drug bioavailability and patient compliance. Regulatory compliance, particularly with stringent regulations like the FDA's Current Good Manufacturing Practice (CGMP), poses challenges for market participants.
- Looking ahead, the forecast period presents opportunities for growth, with increasing demand for new excipients to develop easily consumable drugs. For instance, the adoption of hydroxypropyl methylcellulose (HPMC) as a tablet binder has surged by over 5% in recent years. Related markets such as the dietary supplements and nutraceuticals industries also contribute to the market's dynamic landscape.
What will be the Size of the Pharmaceutical Excipients Market during the forecast period?

Get Key Insights on Market Forecast (PDF) Request Free Sample
How is the Pharmaceutical Excipients Market Segmented and what are the key trends of market segmentation?
The pharmaceutical excipients industry research report provides comprehensive data (region-wise segment analysis), with forecasts and estimates in "USD million" for the period 2025-2029, as well as historical data from 2019-2023 for the following segments.
- Type
- Product
- Binders and fillers
- Coating agents
- Disintegrants
- Others
- Route Of Administration
- Oral excipients
- Topical excipients
- Parenteral excipients
- Others
- Form Factor
- End-User
- Pharmaceutical Companies
- Contract Manufacturing Organizations
- Research Institutes
- Geography
- North America
- Europe
- Middle East and Africa
- APAC
- South America
- Rest of World (ROW)
By Type Insights
The organic segment is estimated to witness significant growth during the forecast period.
Pharmaceutical excipients play a crucial role in drug formulation, ensuring optimal efficacy and patient compliance. Organically derived excipients, including oleochemicals, carbohydrates, petrochemicals, proteins, and others, dominate the market. Oleochemical-based excipients, such as fatty alcohols, mineral stearates, and glycerin, account for a significant market share. Carbohydrate-based excipients, comprising sugars, sugar alcohols, artificial sweeteners, cellulose, starch, and petrochemicals, are essential components. Sugars like lactose, sucrose, and dextrose, sugar alcohols such as sorbitol and mannitol, artificial sweeteners, and various cellulose derivatives like microcrystalline cellulose, carboxymethyl cellulose (CMC), croscarmellose sodium, and cellulose esters are widely used. Starch types, including modified starch, dried starch, and converted starch, and petrochemicals like glycol, povidones, mineral hydrocarbons (petrolatum, mineral waxes, and mineral oils), and acrylic polymers, are also integral.
Biocompatibility testing is essential to ensure excipients do not adversely affect the patient. Emulsifiers and stabilizers, such as polysorbates, lecithin, and sodium lauryl sulfate, are vital for maintaining drug stability. Pharmacopeial standards and regulatory compliance are stringent, with regulatory bodies like the FDA and EMA setting guidelines. Degradation pathways, drug delivery systems, compression behavior, suspending agents, and pharmaceutical coatings are all critical aspects of the market.
The market for pharmaceutical excipients is expected to grow substantially, with a reported 15% increase in demand from the pharmaceutical industry. Furthermore, the market for pharmaceutical excipients in the biotechnology sector is projected to expand by 18%, driven by the rising demand for biologics and biosimilars. These trends reflect the continuous evolution of the pharmaceutical industry and the ongoing development of innovative drug delivery systems and formulations.

Request Free Sample
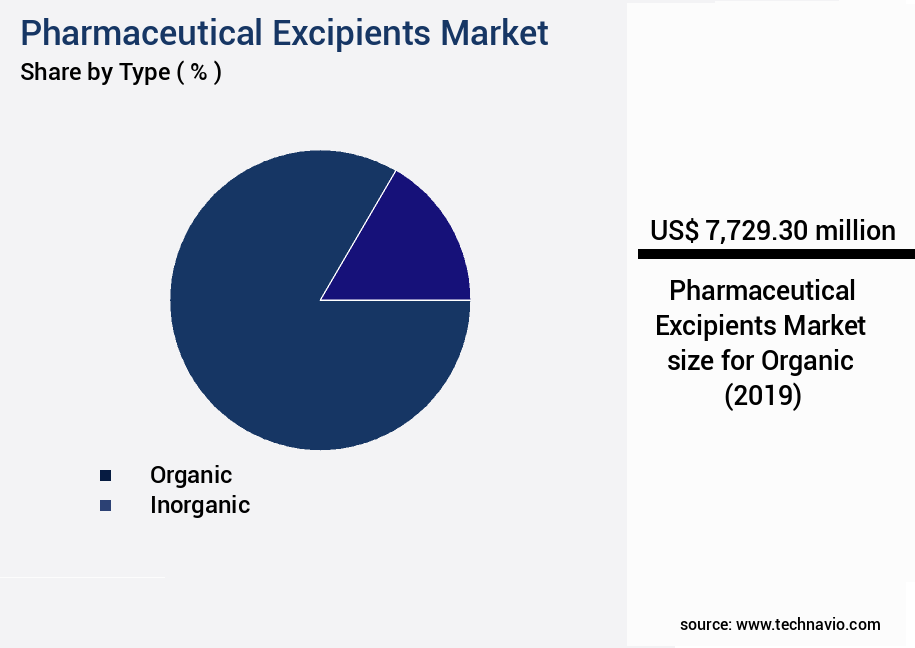
The Organic segment was valued at USD 7.73 billion in 2019 and showed a gradual increase during the forecast period.

Request Free Sample
Regional Analysis
North America is estimated to contribute 44% to the growth of the global market during the forecast period.Technavio's analysts have elaborately explained the regional trends and drivers that shape the market during the forecast period.

See How Pharmaceutical Excipients Market Demand is Rising in North America Request Free Sample
The market is experiencing continuous growth, driven by the expanding aging population, increasing healthcare expenditure, and the high prevalence of chronic diseases, such as diabetes and obesity. For example, in 2024, there were approximately 61.2 million Americans aged 65 and over, a significant increase compared to previous years. This demographic trend is expected to shape healthcare, housing, and social services in the coming decades. With aging comes an increased risk and complexity of chronic diseases. According to recent reports, chronic diseases accounted for approximately 7 out of 10 deaths in the United States in 2020. Furthermore, healthcare expenditures related to chronic diseases are projected to reach USD1.1 trillion by 2028.
These factors are fueling the demand for pharmaceutical excipients, which are essential components of medicines used to improve their stability, consistency, and effectiveness. Additionally, advancements in technology and research are leading to the development of new excipients and formulations, further expanding market opportunities.
Market Dynamics
Our researchers analyzed the data with 2024 as the base year, along with the key drivers, trends, and challenges. A holistic analysis of drivers will help companies refine their marketing strategies to gain a competitive advantage.
The market plays a crucial role in the development and production of pharmaceutical formulations. Excipients are inactive ingredients used in conjunction with active pharmaceutical ingredients (APIs) to create a finished dosage form. The compatibility of excipients with APIs and each other is essential, influencing drug release, stability, and bioavailability. Compatibility testing methods, such as in vitro dissolution testing of solid dosage forms and evaluating excipient compatibility during formulation development, are crucial in ensuring optimal formulation performance. Polymeric excipients, in particular, have gained significant attention due to their role in drug delivery systems. They can improve powder flow properties, enable taste masking, and impact the effect of excipient interactions on bioavailability.
The influence of excipients on stability is also noteworthy, with excipients affecting drug product stability through various mechanisms. Regulatory guidelines, such as the FDA's International Conference on Harmonization (ICH) guidelines, provide guidance on the selection criteria for pharmaceutical excipients. These guidelines consider factors like safety, compatibility, and impact on drug release and stability. Controlled-release excipients have gained popularity due to their applications in improving the efficacy and patient compliance of pharmaceutical formulations. The development of novel drug delivery systems using excipients continues to be a focus in the pharmaceutical industry. For instance, the impact of excipient particle size on drug release has been extensively studied, with smaller particle sizes often resulting in improved drug bioavailability.
Excipient characterization techniques, such as rheological property characterization, are essential in formulation development. Comparing different excipients, a study revealed that using hydroxypropyl methylcellulose (HPMC) instead of sodium carboxymethylcellulose (CMC) led to a 15% increase in compressibility, allowing for more efficient manufacturing processes (Source: Journal of Pharmaceutical Sciences, 2018). This comparison highlights the importance of considering excipient properties in formulation development for improved manufacturing efficiency and product quality.

What are the key market drivers leading to the rise in the adoption of Pharmaceutical Excipients Industry?
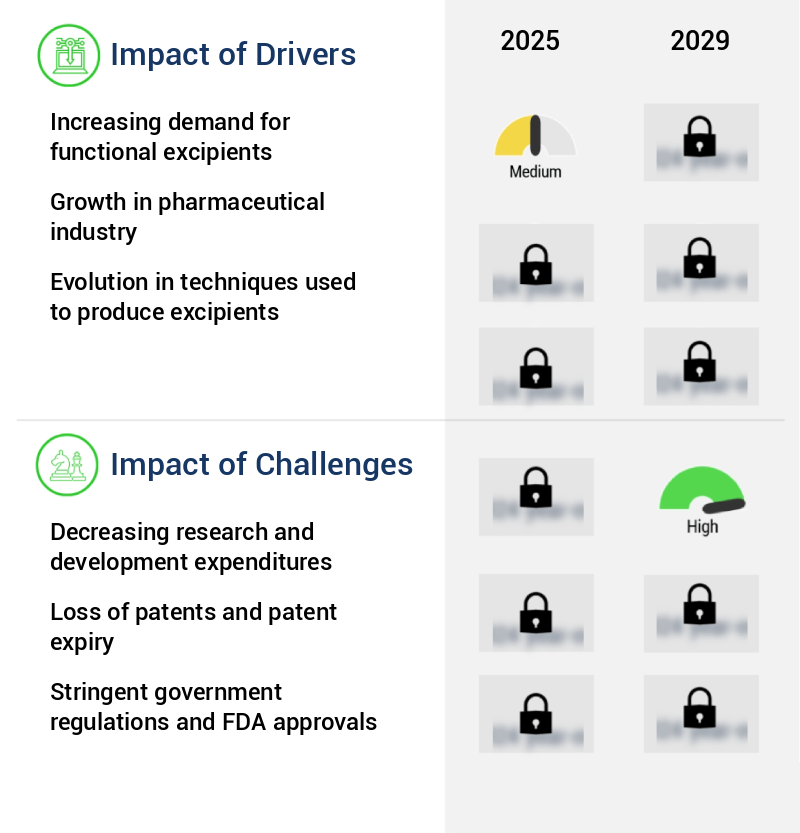
- The significant surge in demand for functional excipients serves as the primary catalyst for market growth.
- Functional excipients play a crucial role in the pharmaceutical industry, with their usage anticipated to expand significantly during the forecast period. These excipients are integral to advanced drug delivery systems, and companies are investing in innovative technologies to enhance their offerings while adhering to industry standards. The emergence of new compositions of ingredients in generic drugs is driving market growth, particularly in the development of oral dispersible tablets. These tablets facilitate controlled release and improved ease of consumption. Looking ahead, nanotechnology and biotechnology are poised to revolutionize the excipient landscape, offering potential for modified functionalities and applications.
- The industry's continuous growth is driven by the increasing demand for improved drug delivery systems and the development of innovative excipient compositions.
What are the market trends shaping the Pharmaceutical Excipients Industry?
- The demand for new excipients to create easily consumable drugs is an emerging market trend. This requirement reflects the growing need for pharmaceutical innovations that enhance patient compliance and convenience.
- The market experiences significant growth due to the escalating demand for orally administered drugs, prioritizing patient comfort, particularly for older adults and infants. This trend propels drug manufacturers to innovate and develop new excipients, including chemically modified grades, diverse administration routes, and co-processed excipients. These advancements broaden the scope for novel formulations and drug delivery systems. The market's expansion is further driven by the increasing preference for improved drug efficacy, patient safety, and enhanced drug stability.
- Numerous excipients, such as binders, fillers, disintegrants, and coating agents, contribute to the market's dynamism. The integration of advanced technologies, like nanotechnology and 3D printing, also influences the market's evolution, offering potential for customized dosage forms and targeted drug delivery.
What challenges does the Pharmaceutical Excipients Industry face during its growth?
- Reducing research and development investments poses a significant challenge to the industry's growth trajectory.
- The market is experiencing a shift in research and development investments, which will significantly influence its growth trajectory. For instance, Johnson and Johnson's research and development spending increased by 21% in 2023 but decreased by nearly 1% compared to 2022. This trend is not unique to Johnson and Johnson, as other industry players are also reducing their research and development expenditures. The decrease in research and development investments will make it challenging for new manufacturing facilities to get approved.
- Furthermore, pricing pressure from cost-cutting policies in the healthcare sector across various countries has contributed to the decline in research and development spending. This trend is expected to impact the growth of the market negatively over the next five years. Despite these challenges, the market continues to evolve, with ongoing advancements in technology and innovation driving progress.
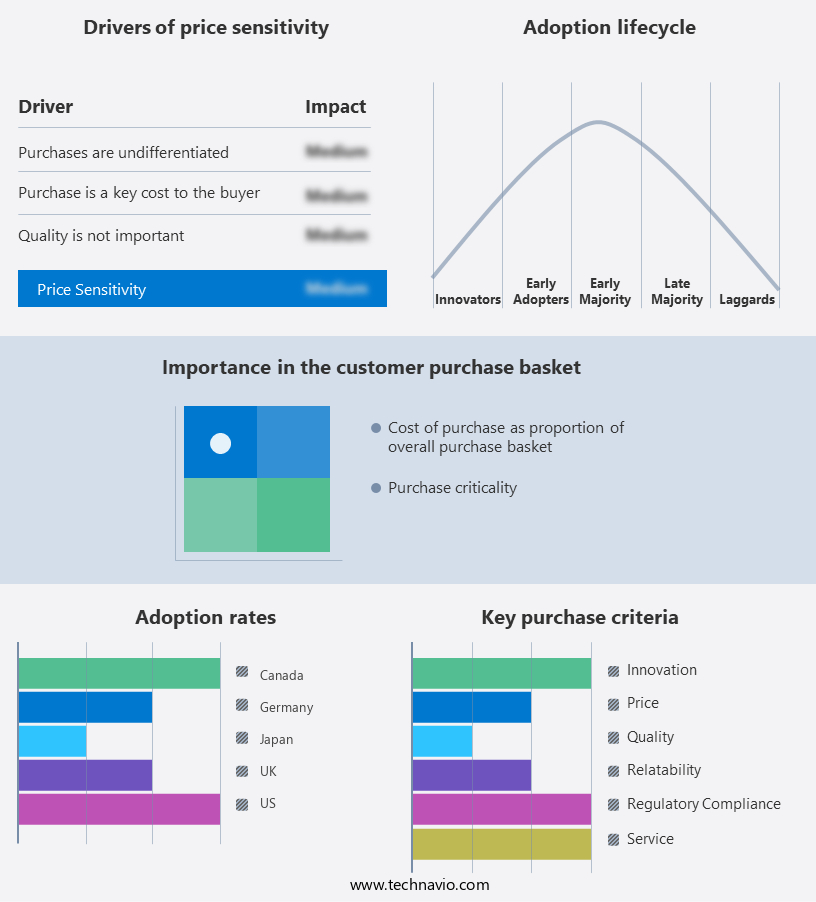
Exclusive Customer Landscape
The pharmaceutical excipients market forecasting report includes the adoption lifecycle of the market, covering from the innovator's stage to the laggard's stage. It focuses on adoption rates in different regions based on penetration. Furthermore, the pharmaceutical excipients market report also includes key purchase criteria and drivers of price sensitivity to help companies evaluate and develop their market growth analysis strategies.

Customer Landscape of Pharmaceutical Excipients Industry
Competitive Landscape & Market Insights
Companies are implementing various strategies, such as strategic alliances, pharmaceutical excipients market forecast, partnerships, mergers and acquisitions, geographical expansion, and product/service launches, to enhance their presence in the industry.
Ashland Global Holdings - This company specializes in providing pharmaceutical excipients, including Hydrogenated Oils and Refined Olive Oil IV, for effective drug formulation and delivery solutions. Their offerings ensure optimal patient outcomes through enhanced solubility, stability, and bioavailability.
The industry research and growth report includes detailed analyses of the competitive landscape of the market and information about key companies, including:
- Ashland Global Holdings
- BASF SE
- Colorcon
- Croda International
- DMV-Fonterra Excipients
- Dow Inc.
- DuPont
- Evonik Industries
- IMCD Group
- Innophos Holdings
- JRS Pharma
- Kerry Group
- Lonza Group
- Lubrizol Corporation
- MEGGLE Group
- Merck KGaA
- Roquette Frères
- Shin-Etsu Chemical
- SPI Pharma
Qualitative and quantitative analysis of companies has been conducted to help clients understand the wider business environment as well as the strengths and weaknesses of key industry players. Data is qualitatively analyzed to categorize companies as pure play, category-focused, industry-focused, and diversified; it is quantitatively analyzed to categorize companies as dominant, leading, strong, tentative, and weak.
Recent Development and News in Pharmaceutical Excipients Market
- In January 2024, leading pharmaceutical excipients manufacturer, DFE Pharma, announced the launch of its new product line, DFE Pure, which includes a range of high-purity excipients for use in advanced drug delivery systems. This expansion aimed to cater to the growing demand for specialized excipients in the pharmaceutical industry (Source: DFE Pharma Press Release).
- In March 2024, BASF Corporation and Ashland Global Holdings Inc. Joined forces to create a strategic partnership in the market. This collaboration aimed to leverage BASF's expertise in manufacturing and Ashland's knowledge in application development to offer innovative solutions to customers (Source: BASF Corporation Press Release).
- In May 2024, Croda International Plc, a significant player in the market, completed the acquisition of Sederma SAS, a leading supplier of specialty ingredients for the pharmaceutical and cosmetics industries. This acquisition expanded Croda's product portfolio and strengthened its position in the market (Source: Croda International Plc Press Release).
- In January 2025, the European Medicines Agency (EMA) approved the use of a new excipient, poloxamer 407, in certain pediatric vaccines. This approval marked a significant milestone in the development of safer and more effective vaccines for children (Source: EMA Press Release).
Dive into Technavio's robust research methodology, blending expert interviews, extensive data synthesis, and validated models for unparalleled Pharmaceutical Excipients Market insights. See full methodology.
|
Market Scope
|
|
Report Coverage
|
Details
|
|
Page number
|
246
|
|
Base year
|
2024
|
|
Historic period
|
2019-2023 |
|
Forecast period
|
2025-2029
|
|
Growth momentum & CAGR
|
Accelerate at a CAGR of 7.7%
|
|
Market growth 2025-2029
|
USD 5208.9 million
|
|
Market structure
|
Fragmented
|
|
YoY growth 2024-2025(%)
|
6.6
|
|
Key countries
|
US, Canada, Germany, UK, Italy, France, China, India, Japan, Brazil, Egypt, UAE, Oman, Argentina, KSA, UAE, Brazil, and Rest of World (ROW)
|
|
Competitive landscape
|
Leading Companies, Market Positioning of Companies, Competitive Strategies, and Industry Risks
|
Request Free Sample
Research Analyst Overview
- In the dynamic and intricate landscape of pharmaceutical manufacturing, excipients play a pivotal role in ensuring drug efficacy and patient safety. The market for excipients, encompassing diverse categories such as colorants and pigments, emulsifiers and stabilizers, capsule fillers, and lubricants, among others, continues to evolve. Biocompatibility testing is a critical aspect of excipient selection, ensuring the safety and suitability of these materials for pharmaceutical applications. Pharmacopeial standards provide a benchmark for quality, ensuring regulatory compliance and consistency in manufacturing processes. Excipients undergo various degradation pathways, necessitating rigorous stability studies. Tablet binders, for instance, contribute to tablet cohesion and disintegration, while lubricants and glidants facilitate smooth manufacturing processes.
- Sweeteners and flavor enhancers, essential for palatability, are subjected to in-vitro dissolution and in-vivo bioavailability testing. Quality control testing, including particle size distribution and rheological properties assessment, is integral to maintaining drug product stability. Excipient selection criteria extend beyond traditional parameters, considering factors like excipient characterization, powder flow properties, and compatibility with drug delivery systems. Polymers, for example, are increasingly utilized in drug delivery due to their versatile properties. Regulatory compliance is a constant concern, with regulatory bodies demanding stringent adherence to guidelines. Manufacturing processes, including granulation techniques and compression behavior, must be optimized for efficient production and high-quality output.
- In the realm of capsule fillers, wetting agents facilitate uniform filling, while taste masking agents enhance patient compliance. Disintegration agents and controlled release matrix systems ensure optimal drug release profiles. Preservatives and antimicrobial agents, antioxidants, and suspending agents are integral to maintaining drug stability and preventing degradation. Pharmaceutical coatings offer protective barriers, while suspension agents facilitate homogeneous mixtures. The excipient market's continuous evolution underscores the importance of ongoing research and development, as manufacturers strive to optimize production processes, improve product quality, and meet evolving regulatory requirements.
What are the Key Data Covered in this Pharmaceutical Excipients Market Research and Growth Report?
-
What is the expected growth of the Pharmaceutical Excipients Market between 2025 and 2029?
-
What segmentation does the market report cover?
-
The report segmented by Type (Organic and Inorganic), Product (Binders and fillers, Coating agents, Disintegrants, and Others), Route Of Administration (Oral excipients, Topical excipients, Parenteral excipients, and Others), Form Factor (Solid, Semi-solid, and Liquid), Geography (North America, Europe, APAC, South America, and Middle East and Africa), and End-User (Pharmaceutical Companies, Contract Manufacturing Organizations, and Research Institutes)
-
Which regions are analyzed in the report?
-
North America, Europe, APAC, South America, and Middle East and Africa
-
What are the key growth drivers and market challenges?
-
Who are the major players in the Pharmaceutical Excipients Market?
-
Key Companies Ashland Global Holdings, BASF SE, Colorcon, Croda International, DMV-Fonterra Excipients, Dow Inc., DuPont, Evonik Industries, IMCD Group, Innophos Holdings, JRS Pharma, Kerry Group, Lonza Group, Lubrizol Corporation, MEGGLE Group, Merck KGaA, Roquette Frères, Shin-Etsu Chemical, and SPI Pharma
Market Research Insights
- The market encompasses a diverse range of inactive ingredients used in the formulation of pharmaceutical products. These substances play a crucial role in enhancing drug efficacy, ensuring stability, and improving patient compliance. According to industry estimates, The market was valued at approximately USD25 billion in 2020, with a projected CAGR of 5% between 2021 and 2026. One significant trend driving market growth is the increasing focus on quality by design (QbD) approaches, which necessitate extensive material characterization, such as particle morphology and surface area analysis, during formulation development. For instance, bioavailability studies and dissolution testing are essential analytical methods used to optimize drug release kinetics and ensure compatibility between excipients and active pharmaceutical ingredients.
- Moreover, the scale-up manufacturing process, including granulation, film coating, and capsule filling, necessitates stringent process validation and stability-indicating assays to ensure consistent product quality. Compendial monographs and crystal structure analysis are also essential tools in ensuring excipient compatibility and drug release rate testing. Despite the challenges, the market presents numerous opportunities for innovation, with ongoing research in areas such as rheology measurement, excipient interactions, and process optimization. For example, advancements in compression force and tableting machine technology have led to improved product consistency and efficiency. Overall, the market continues to evolve, driven by a commitment to enhancing drug efficacy, patient safety, and regulatory compliance.
We can help! Our analysts can customize this pharmaceutical excipients market research report to meet your requirements.
Get in touch
1 Executive Summary
- 1.1 Market overview
- Executive Summary - Chart on Market Overview
- Executive Summary - Data Table on Market Overview
- Executive Summary - Chart on Global Market Characteristics
- Executive Summary - Chart on Market by Geography
- Executive Summary - Chart on Market Segmentation by Type
- Executive Summary - Chart on Market Segmentation by Product
- Executive Summary - Chart on Market Segmentation by Route of Administration
- Executive Summary - Chart on Market Segmentation by Form Factor
- Executive Summary - Chart on Incremental Growth
- Executive Summary - Data Table on Incremental Growth
- Executive Summary - Chart on Company Market Positioning
2 Technavio Analysis
- 2.1 Analysis of price sensitivity, lifecycle, customer purchase basket, adoption rates, and purchase criteria
- Analysis of price sensitivity, lifecycle, customer purchase basket, adoption rates, and purchase criteria
- 2.2 Criticality of inputs and Factors of differentiation
- Overview on criticality of inputs and factors of differentiation
- 2.3 Factors of disruption
- Overview on factors of disruption
- 2.4 Impact of drivers and challenges
- Impact of drivers and challenges in 2024 and 2029
3 Market Landscape
- 3.1 Market ecosystem
- Parent Market
- Data Table on - Parent Market
- 3.2 Market characteristics
- Market characteristics analysis
4 Market Sizing
- 4.1 Market definition
- Offerings of companies included in the market definition
- 4.2 Market segment analysis
- 4.4 Market outlook: Forecast for 2024-2029
- Chart on Global - Market size and forecast 2024-2029 ($ million)
- Data Table on Global - Market size and forecast 2024-2029 ($ million)
- Chart on Global Market: Year-over-year growth 2024-2029 (%)
- Data Table on Global Market: Year-over-year growth 2024-2029 (%)
5 Historic Market Size
- 5.1 Global Pharmaceutical Excipients Market 2019 - 2023
- Historic Market Size - Data Table on Global Pharmaceutical Excipients Market 2019 - 2023 ($ million)
- 5.2 Type segment analysis 2019 - 2023
- Historic Market Size - Type Segment 2019 - 2023 ($ million)
- 5.3 Product segment analysis 2019 - 2023
- Historic Market Size - Product Segment 2019 - 2023 ($ million)
- 5.4 Route of Administration segment analysis 2019 - 2023
- Historic Market Size - Route of Administration Segment 2019 - 2023 ($ million)
- 5.5 Form Factor segment analysis 2019 - 2023
- Historic Market Size - Form Factor Segment 2019 - 2023 ($ million)
- 5.6 Geography segment analysis 2019 - 2023
- Historic Market Size - Geography Segment 2019 - 2023 ($ million)
- 5.7 Country segment analysis 2019 - 2023
- Historic Market Size - Country Segment 2019 - 2023 ($ million)
6 Qualitative Analysis
- 6.1 Impact of AI in global pharmaceutical excipients market
7 Five Forces Analysis
- 7.1 Five forces summary
- Five forces analysis - Comparison between 2024 and 2029
- 7.2 Bargaining power of buyers
- Bargaining power of buyers - Impact of key factors 2024 and 2029
- 7.3 Bargaining power of suppliers
- Bargaining power of suppliers - Impact of key factors in 2024 and 2029
- 7.4 Threat of new entrants
- Threat of new entrants - Impact of key factors in 2024 and 2029
- 7.5 Threat of substitutes
- Threat of substitutes - Impact of key factors in 2024 and 2029
- 7.6 Threat of rivalry
- Threat of rivalry - Impact of key factors in 2024 and 2029
- 7.7 Market condition
- Chart on Market condition - Five forces 2024 and 2029
8 Market Segmentation by Type
- 8.1 Market segments
- Chart on Type - Market share (2024-2029) (%)
- Data Table on Type - Market share (2024-2029) (%)
- 8.2 Comparison by Type
- Chart on Comparison by Type
- Data Table on Comparison by Type
- 8.3 Organic - Market size and forecast (2024-2029)
- Chart on Organic - Market size and forecast (2024-2029) ($ million)
- Data Table on Organic - Market size and forecast (2024-2029) ($ million)
- Chart on Organic - Year-over-year growth (2024-2029) (%)
- Data Table on Organic - Year-over-year growth (2024-2029) (%)
- 8.4 Inorganic - Market size and forecast (2024-2029)
- Chart on Inorganic - Market size and forecast (2024-2029) ($ million)
- Data Table on Inorganic - Market size and forecast (2024-2029) ($ million)
- Chart on Inorganic - Year-over-year growth (2024-2029) (%)
- Data Table on Inorganic - Year-over-year growth (2024-2029) (%)
- 8.5 Market opportunity by Type
- Market opportunity by Type ($ million)
- Data Table on Market opportunity by Type ($ million)
9 Market Segmentation by Product
- 9.1 Market segments
- Chart on Product - Market share (2024-2029) (%)
- Data Table on Product - Market share (2024-2029) (%)
- 9.2 Comparison by Product
- Chart on Comparison by Product
- Data Table on Comparison by Product
- 9.3 Binders and fillers - Market size and forecast (2024-2029)
- Chart on Binders and fillers - Market size and forecast (2024-2029) ($ million)
- Data Table on Binders and fillers - Market size and forecast (2024-2029) ($ million)
- Chart on Binders and fillers - Year-over-year growth (2024-2029) (%)
- Data Table on Binders and fillers - Year-over-year growth (2024-2029) (%)
- 9.4 Coating agents - Market size and forecast (2024-2029)
- Chart on Coating agents - Market size and forecast (2024-2029) ($ million)
- Data Table on Coating agents - Market size and forecast (2024-2029) ($ million)
- Chart on Coating agents - Year-over-year growth (2024-2029) (%)
- Data Table on Coating agents - Year-over-year growth (2024-2029) (%)
- 9.5 Disintegrants - Market size and forecast (2024-2029)
- Chart on Disintegrants - Market size and forecast (2024-2029) ($ million)
- Data Table on Disintegrants - Market size and forecast (2024-2029) ($ million)
- Chart on Disintegrants - Year-over-year growth (2024-2029) (%)
- Data Table on Disintegrants - Year-over-year growth (2024-2029) (%)
- 9.6 Others - Market size and forecast (2024-2029)
- Chart on Others - Market size and forecast (2024-2029) ($ million)
- Data Table on Others - Market size and forecast (2024-2029) ($ million)
- Chart on Others - Year-over-year growth (2024-2029) (%)
- Data Table on Others - Year-over-year growth (2024-2029) (%)
- 9.7 Market opportunity by Product
- Market opportunity by Product ($ million)
- Data Table on Market opportunity by Product ($ million)
10 Market Segmentation by Route Of Administration
- 10.1 Market segments
- Chart on Route Of Administration - Market share (2024-2029) (%)
- Data Table on Route Of Administration - Market share (2024-2029) (%)
- 10.2 Comparison by Route Of Administration
- Chart on Comparison by Route Of Administration
- Data Table on Comparison by Route Of Administration
- 10.3 Oral excipients - Market size and forecast (2024-2029)
- Chart on Oral excipients - Market size and forecast (2024-2029) ($ million)
- Data Table on Oral excipients - Market size and forecast (2024-2029) ($ million)
- Chart on Oral excipients - Year-over-year growth (2024-2029) (%)
- Data Table on Oral excipients - Year-over-year growth (2024-2029) (%)
- 10.4 Topical excipients - Market size and forecast (2024-2029)
- Chart on Topical excipients - Market size and forecast (2024-2029) ($ million)
- Data Table on Topical excipients - Market size and forecast (2024-2029) ($ million)
- Chart on Topical excipients - Year-over-year growth (2024-2029) (%)
- Data Table on Topical excipients - Year-over-year growth (2024-2029) (%)
- 10.5 Parenteral excipients - Market size and forecast (2024-2029)
- Chart on Parenteral excipients - Market size and forecast (2024-2029) ($ million)
- Data Table on Parenteral excipients - Market size and forecast (2024-2029) ($ million)
- Chart on Parenteral excipients - Year-over-year growth (2024-2029) (%)
- Data Table on Parenteral excipients - Year-over-year growth (2024-2029) (%)
- 10.6 Others - Market size and forecast (2024-2029)
- Chart on Others - Market size and forecast (2024-2029) ($ million)
- Data Table on Others - Market size and forecast (2024-2029) ($ million)
- Chart on Others - Year-over-year growth (2024-2029) (%)
- Data Table on Others - Year-over-year growth (2024-2029) (%)
- 10.7 Market opportunity by Route Of Administration
- Market opportunity by Route Of Administration ($ million)
- Data Table on Market opportunity by Route Of Administration ($ million)
11 Market Segmentation by Form Factor
- 11.1 Market segments
- Chart on Form Factor - Market share (2024-2029) (%)
- Data Table on Form Factor - Market share (2024-2029) (%)
- 11.2 Comparison by Form Factor
- Chart on Comparison by Form Factor
- Data Table on Comparison by Form Factor
- 11.3 Solid - Market size and forecast (2024-2029)
- Chart on Solid - Market size and forecast (2024-2029) ($ million)
- Data Table on Solid - Market size and forecast (2024-2029) ($ million)
- Chart on Solid - Year-over-year growth (2024-2029) (%)
- Data Table on Solid - Year-over-year growth (2024-2029) (%)
- 11.4 Semi-solid - Market size and forecast (2024-2029)
- Chart on Semi-solid - Market size and forecast (2024-2029) ($ million)
- Data Table on Semi-solid - Market size and forecast (2024-2029) ($ million)
- Chart on Semi-solid - Year-over-year growth (2024-2029) (%)
- Data Table on Semi-solid - Year-over-year growth (2024-2029) (%)
- 11.5 Liquid - Market size and forecast (2024-2029)
- Chart on Liquid - Market size and forecast (2024-2029) ($ million)
- Data Table on Liquid - Market size and forecast (2024-2029) ($ million)
- Chart on Liquid - Year-over-year growth (2024-2029) (%)
- Data Table on Liquid - Year-over-year growth (2024-2029) (%)
- 11.6 Market opportunity by Form Factor
- Market opportunity by Form Factor ($ million)
- Data Table on Market opportunity by Form Factor ($ million)
12 Market Segmentation by End-User
- 12.1 Market segments
- Chart on End-User - Market share (2024-2029) (%)
- Data Table on End-User - Market share (2024-2029) (%)
- 12.2 Comparison by End-User
- Chart on Comparison by End-User
- Data Table on Comparison by End-User
- 12.3 Pharmaceutical Companies - Market size and forecast (2024-2029)
- Chart on Pharmaceutical Companies - Market size and forecast (2024-2029) ($ million)
- Data Table on Pharmaceutical Companies - Market size and forecast (2024-2029) ($ million)
- Chart on Pharmaceutical Companies - Year-over-year growth (2024-2029) (%)
- Data Table on Pharmaceutical Companies - Year-over-year growth (2024-2029) (%)
- 12.4 Contract Manufacturing Organizations - Market size and forecast (2024-2029)
- Chart on Contract Manufacturing Organizations - Market size and forecast (2024-2029) ($ million)
- Data Table on Contract Manufacturing Organizations - Market size and forecast (2024-2029) ($ million)
- Chart on Contract Manufacturing Organizations - Year-over-year growth (2024-2029) (%)
- Data Table on Contract Manufacturing Organizations - Year-over-year growth (2024-2029) (%)
- 12.5 Research Institutes - Market size and forecast (2024-2029)
- Chart on Research Institutes - Market size and forecast (2024-2029) ($ million)
- Data Table on Research Institutes - Market size and forecast (2024-2029) ($ million)
- Chart on Research Institutes - Year-over-year growth (2024-2029) (%)
- Data Table on Research Institutes - Year-over-year growth (2024-2029) (%)
- 12.6 Market opportunity by End-User
- Market opportunity by End-User ($ million)
- Data Table on Market opportunity by End-User ($ million)
13 Customer Landscape
- 13.1 Customer landscape overview
- Analysis of price sensitivity, lifecycle, customer purchase basket, adoption rates, and purchase criteria
14 Geographic Landscape
- 14.1 Geographic segmentation
- Chart on Market share by geography 2024-2029 (%)
- Data Table on Market share by geography 2024-2029 (%)
- 14.2 Geographic comparison
- Chart on Geographic comparison
- Data Table on Geographic comparison
- 14.3 North America - Market size and forecast 2024-2029
- Chart on North America - Market size and forecast 2024-2029 ($ million)
- Data Table on North America - Market size and forecast 2024-2029 ($ million)
- Chart on North America - Year-over-year growth 2024-2029 (%)
- Data Table on North America - Year-over-year growth 2024-2029 (%)
- 14.4 Europe - Market size and forecast 2024-2029
- Chart on Europe - Market size and forecast 2024-2029 ($ million)
- Data Table on Europe - Market size and forecast 2024-2029 ($ million)
- Chart on Europe - Year-over-year growth 2024-2029 (%)
- Data Table on Europe - Year-over-year growth 2024-2029 (%)
- 14.5 APAC - Market size and forecast 2024-2029
- Chart on APAC - Market size and forecast 2024-2029 ($ million)
- Data Table on APAC - Market size and forecast 2024-2029 ($ million)
- Chart on APAC - Year-over-year growth 2024-2029 (%)
- Data Table on APAC - Year-over-year growth 2024-2029 (%)
- 14.6 South America - Market size and forecast 2024-2029
- Chart on South America - Market size and forecast 2024-2029 ($ million)
- Data Table on South America - Market size and forecast 2024-2029 ($ million)
- Chart on South America - Year-over-year growth 2024-2029 (%)
- Data Table on South America - Year-over-year growth 2024-2029 (%)
- 14.7 Middle East and Africa - Market size and forecast 2024-2029
- Chart on Middle East and Africa - Market size and forecast 2024-2029 ($ million)
- Data Table on Middle East and Africa - Market size and forecast 2024-2029 ($ million)
- Chart on Middle East and Africa - Year-over-year growth 2024-2029 (%)
- Data Table on Middle East and Africa - Year-over-year growth 2024-2029 (%)
- 14.8 US - Market size and forecast 2024-2029
- Chart on US - Market size and forecast 2024-2029 ($ million)
- Data Table on US - Market size and forecast 2024-2029 ($ million)
- Chart on US - Year-over-year growth 2024-2029 (%)
- Data Table on US - Year-over-year growth 2024-2029 (%)
- 14.9 Germany - Market size and forecast 2024-2029
- Chart on Germany - Market size and forecast 2024-2029 ($ million)
- Data Table on Germany - Market size and forecast 2024-2029 ($ million)
- Chart on Germany - Year-over-year growth 2024-2029 (%)
- Data Table on Germany - Year-over-year growth 2024-2029 (%)
- 14.10 Canada - Market size and forecast 2024-2029
- Chart on Canada - Market size and forecast 2024-2029 ($ million)
- Data Table on Canada - Market size and forecast 2024-2029 ($ million)
- Chart on Canada - Year-over-year growth 2024-2029 (%)
- Data Table on Canada - Year-over-year growth 2024-2029 (%)
- 14.11 China - Market size and forecast 2024-2029
- Chart on China - Market size and forecast 2024-2029 ($ million)
- Data Table on China - Market size and forecast 2024-2029 ($ million)
- Chart on China - Year-over-year growth 2024-2029 (%)
- Data Table on China - Year-over-year growth 2024-2029 (%)
- 14.12 Japan - Market size and forecast 2024-2029
- Chart on Japan - Market size and forecast 2024-2029 ($ million)
- Data Table on Japan - Market size and forecast 2024-2029 ($ million)
- Chart on Japan - Year-over-year growth 2024-2029 (%)
- Data Table on Japan - Year-over-year growth 2024-2029 (%)
- 14.13 Brazil - Market size and forecast 2024-2029
- Chart on Brazil - Market size and forecast 2024-2029 ($ million)
- Data Table on Brazil - Market size and forecast 2024-2029 ($ million)
- Chart on Brazil - Year-over-year growth 2024-2029 (%)
- Data Table on Brazil - Year-over-year growth 2024-2029 (%)
- 14.14 Italy - Market size and forecast 2024-2029
- Chart on Italy - Market size and forecast 2024-2029 ($ million)
- Data Table on Italy - Market size and forecast 2024-2029 ($ million)
- Chart on Italy - Year-over-year growth 2024-2029 (%)
- Data Table on Italy - Year-over-year growth 2024-2029 (%)
- 14.15 France - Market size and forecast 2024-2029
- Chart on France - Market size and forecast 2024-2029 ($ million)
- Data Table on France - Market size and forecast 2024-2029 ($ million)
- Chart on France - Year-over-year growth 2024-2029 (%)
- Data Table on France - Year-over-year growth 2024-2029 (%)
- 14.16 UK - Market size and forecast 2024-2029
- Chart on UK - Market size and forecast 2024-2029 ($ million)
- Data Table on UK - Market size and forecast 2024-2029 ($ million)
- Chart on UK - Year-over-year growth 2024-2029 (%)
- Data Table on UK - Year-over-year growth 2024-2029 (%)
- 14.17 India - Market size and forecast 2024-2029
- Chart on India - Market size and forecast 2024-2029 ($ million)
- Data Table on India - Market size and forecast 2024-2029 ($ million)
- Chart on India - Year-over-year growth 2024-2029 (%)
- Data Table on India - Year-over-year growth 2024-2029 (%)
- 14.18 Market opportunity by geography
- Market opportunity by geography ($ million)
- Data Tables on Market opportunity by geography ($ million)
- 14.19 Egypt - Market size and forecast (2024-2029)
- Chart on Egypt - Market size and forecast (2024-2029) ($ million)
- Data Table on Egypt - Market size and forecast (2024-2029) ($ million)
- Chart on Egypt - Year-over-year growth (2024-2029) (%)
- Data Table on Egypt - Year-over-year growth (2024-2029) (%)
- 14.20 UAE - Market size and forecast (2024-2029)
- Chart on UAE - Market size and forecast (2024-2029) ($ million)
- Data Table on UAE - Market size and forecast (2024-2029) ($ million)
- Chart on UAE - Year-over-year growth (2024-2029) (%)
- Data Table on UAE - Year-over-year growth (2024-2029) (%)
- 14.21 Oman - Market size and forecast (2024-2029)
- Chart on Oman - Market size and forecast (2024-2029) ($ million)
- Data Table on Oman - Market size and forecast (2024-2029) ($ million)
- Chart on Oman - Year-over-year growth (2024-2029) (%)
- Data Table on Oman - Year-over-year growth (2024-2029) (%)
- 14.22 Argentina - Market size and forecast (2024-2029)
- Chart on Argentina - Market size and forecast (2024-2029) ($ million)
- Data Table on Argentina - Market size and forecast (2024-2029) ($ million)
- Chart on Argentina - Year-over-year growth (2024-2029) (%)
- Data Table on Argentina - Year-over-year growth (2024-2029) (%)
- 14.23 KSA - Market size and forecast (2024-2029)
- Chart on KSA - Market size and forecast (2024-2029) ($ million)
- Data Table on KSA - Market size and forecast (2024-2029) ($ million)
- Chart on KSA - Year-over-year growth (2024-2029) (%)
- Data Table on KSA - Year-over-year growth (2024-2029) (%)
- 14.24 UAE - Market size and forecast (2024-2029)
- Chart on UAE - Market size and forecast (2024-2029) ($ million)
- Data Table on UAE - Market size and forecast (2024-2029) ($ million)
- Chart on UAE - Year-over-year growth (2024-2029) (%)
- Data Table on UAE - Year-over-year growth (2024-2029) (%)
- 14.25 Rest of World (ROW) - Market size and forecast (2024-2029)
- Chart on Rest of World (ROW) - Market size and forecast (2024-2029) ($ million)
- Data Table on Rest of World (ROW) - Market size and forecast (2024-2029) ($ million)
- Chart on Rest of World (ROW) - Year-over-year growth (2024-2029) (%)
- Data Table on Rest of World (ROW) - Year-over-year growth (2024-2029) (%)
15 Drivers, Challenges, and Opportunity/Restraints
- 15.3 Impact of drivers and challenges
- Impact of drivers and challenges in 2024 and 2029
- 15.4 Market opportunities/restraints
16 Competitive Landscape
- 16.2 Competitive Landscape
- Overview on criticality of inputs and factors of differentiation
- 16.3 Landscape disruption
- Overview on factors of disruption
- 16.4 Industry risks
- Impact of key risks on business
17 Competitive Analysis
- 17.2 Market positioning of companies
- Matrix on companies position and classification
- 17.3 Ashland Global Holdings
- Ashland Global Holdings - Overview
- Ashland Global Holdings - Product / Service
- Ashland Global Holdings - Key offerings
- 17.4 BASF SE
- BASF SE - Overview
- BASF SE - Product / Service
- BASF SE - Key offerings
- 17.5 Colorcon
- Colorcon - Overview
- Colorcon - Product / Service
- Colorcon - Key offerings
- 17.6 Croda International
- Croda International - Overview
- Croda International - Product / Service
- Croda International - Key offerings
- 17.7 DMV-Fonterra Excipients
- DMV-Fonterra Excipients - Overview
- DMV-Fonterra Excipients - Product / Service
- DMV-Fonterra Excipients - Key offerings
- 17.8 Dow Inc.
- Dow Inc. - Overview
- Dow Inc. - Product / Service
- Dow Inc. - Key offerings
- 17.9 DuPont
- DuPont - Overview
- DuPont - Product / Service
- DuPont - Key offerings
- 17.10 Evonik Industries
- Evonik Industries - Overview
- Evonik Industries - Product / Service
- Evonik Industries - Key offerings
- 17.11 IMCD Group
- IMCD Group - Overview
- IMCD Group - Product / Service
- IMCD Group - Key offerings
- 17.12 Innophos Holdings
- Innophos Holdings - Overview
- Innophos Holdings - Product / Service
- Innophos Holdings - Key offerings
- 17.13 JRS Pharma
- JRS Pharma - Overview
- JRS Pharma - Product / Service
- JRS Pharma - Key offerings
- 17.14 Kerry Group
- Kerry Group - Overview
- Kerry Group - Product / Service
- Kerry Group - Key offerings
- 17.15 Lonza Group
- Lonza Group - Overview
- Lonza Group - Product / Service
- Lonza Group - Key offerings
- 17.16 Lubrizol Corporation
- Lubrizol Corporation - Overview
- Lubrizol Corporation - Product / Service
- Lubrizol Corporation - Key offerings
- 17.17 MEGGLE Group
- MEGGLE Group - Overview
- MEGGLE Group - Product / Service
- MEGGLE Group - Key offerings
- 17.18 Merck KGaA
- Merck KGaA - Overview
- Merck KGaA - Product / Service
- Merck KGaA - Key offerings
- 17.19 Roquette Frères
- Roquette Frères - Overview
- Roquette Frères - Product / Service
- Roquette Frères - Key offerings
- 17.20 Shin-Etsu Chemical
- Shin-Etsu Chemical - Overview
- Shin-Etsu Chemical - Product / Service
- Shin-Etsu Chemical - Key offerings
- 17.21 SPI Pharma
- SPI Pharma - Overview
- SPI Pharma - Product / Service
- SPI Pharma - Key offerings
- 17.22 Actylis
- Actylis - Overview
- Actylis - Product / Service
- Actylis - Key offerings
- 17.23 Air Liquide SA
- Air Liquide SA - Overview
- Air Liquide SA - Product / Service
- Air Liquide SA - Key offerings
- 17.24 Archer Daniels Midland Co.
- Archer Daniels Midland Co. - Overview
- Archer Daniels Midland Co. - Product / Service
- Archer Daniels Midland Co. - Key offerings
- 17.25 Ashland Inc.
- Ashland Inc. - Overview
- Ashland Inc. - Product / Service
- Ashland Inc. - Key offerings
- 17.26 Associated British Foods Plc
- Associated British Foods Plc - Overview
- Associated British Foods Plc - Product / Service
- Associated British Foods Plc - Key offerings
- 17.27 Avantor Inc.
- Avantor Inc. - Overview
- Avantor Inc. - Product / Service
- Avantor Inc. - Key offerings
- 17.28 BASF SE
- BASF SE - Overview
- BASF SE - Product / Service
- BASF SE - Key offerings
- 17.29 Colorcon Inc.
- Colorcon Inc. - Overview
- Colorcon Inc. - Product / Service
- Colorcon Inc. - Key offerings
- 17.30 Croda International Plc
- Croda International Plc - Overview
- Croda International Plc - Product / Service
- Croda International Plc - Key offerings
- 17.31 DFE Pharma GmbH and Co. KG
- DFE Pharma GmbH and Co. KG - Overview
- DFE Pharma GmbH and Co. KG - Product / Service
- DFE Pharma GmbH and Co. KG - Key offerings
- 17.32 Evonik Industries AG
- Evonik Industries AG - Overview
- Evonik Industries AG - Product / Service
- Evonik Industries AG - Key offerings
- 17.33 Innophos Holdings Inc.
- Innophos Holdings Inc. - Overview
- Innophos Holdings Inc. - Product / Service
- Innophos Holdings Inc. - Key offerings
- 17.34 J M Huber Corp.
- J M Huber Corp. - Overview
- J M Huber Corp. - Product / Service
- J M Huber Corp. - Key offerings
- 17.35 JRS PHARMA GmbH and Co. KG
- JRS PHARMA GmbH and Co. KG - Overview
- JRS PHARMA GmbH and Co. KG - Product / Service
- JRS PHARMA GmbH and Co. KG - Key offerings
- 17.36 Kerry Group Plc
- Kerry Group Plc - Overview
- Kerry Group Plc - Product / Service
- Kerry Group Plc - Key offerings
- 17.37 Merck and Co. Inc.
- Merck and Co. Inc. - Overview
- Merck and Co. Inc. - Product / Service
- Merck and Co. Inc. - Key offerings
- 17.38 Roquette Freres SA
- Roquette Freres SA - Overview
- Roquette Freres SA - Product / Service
- Roquette Freres SA - Key offerings
- 17.39 The Dow Chemical Co.
- The Dow Chemical Co. - Overview
- The Dow Chemical Co. - Product / Service
- The Dow Chemical Co. - Key offerings
- 17.40 The Lubrizol Corp.
- The Lubrizol Corp. - Overview
- The Lubrizol Corp. - Product / Service
- The Lubrizol Corp. - Key offerings
- 17.41 Wacker Chemie AG
- Wacker Chemie AG - Overview
- Wacker Chemie AG - Product / Service
- Wacker Chemie AG - Key offerings
18 Appendix
- 18.2 Inclusions and exclusions checklist
- Inclusions checklist
- Exclusions checklist
- 18.3 Currency conversion rates for US$
- Currency conversion rates for US$
- 18.4 Research methodology
- 18.7 Validation techniques employed for market sizing
- Validation techniques employed for market sizing
- 18.9 360 degree market analysis
- 360 degree market analysis
- 18.10 List of abbreviations