Textile Industry Waste Management Market Size 2025-2029
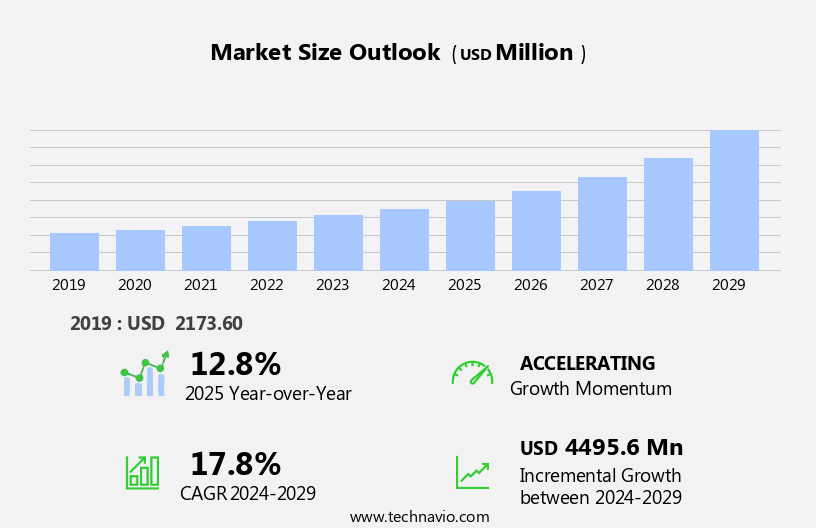
The textile industry waste management market size is forecast to increase by USD 4.5 billion at a CAGR of 17.8% between 2024 and 2029.
- The market is experiencing significant growth due to increasing global awareness toward sustainability and environmental protection. This trend is driving the demand for effective textile waste management solutions, as consumers and regulatory bodies push for reduced environmental impact from the textile industry. Moreover, the integration of Artificial Intelligence (AI) and Internet of Things (IoT) technologies in textile production and supply chains is enabling better monitoring and reduction of textile waste. However, the lack of proper disposal facilities management is a significant challenge to market growth. This issue, coupled with the complex nature of textile waste and the diverse range of sources, necessitates innovative and comprehensive solutions from market participants.
- Companies seeking to capitalize on this market opportunity must focus on developing integrated waste management systems, leveraging advanced technologies, and collaborating with stakeholders across the textile value chain. Effective waste management strategies will not only help reduce environmental impact but also enhance brand reputation and improve operational efficiency.
What will be the Size of the Textile Industry Waste Management Market during the forecast period?
- The textile industry generates substantial waste, with an estimated 92 million tons produced annually. This waste encompasses various forms, including fiber sorting residues, textile waste processing streams, and end-of-life textiles. To address this challenge, the textile waste management market is witnessing significant growth, driven by the adoption of advanced waste treatment technologies and the increasing focus on textile waste valorization. Biodegradable and compostable textiles are gaining traction as sustainable alternatives, contributing to the market's expansion. Moreover, the shift towards circular fashion, fast fashion, slow fashion, and responsible fashion practices is propelling the demand for innovative waste management solutions.
- Fashion transparency and economic viability are crucial factors influencing business models in this sector. Investment in waste management infrastructure and the establishment of innovation hubs are essential for the growth of the textile waste management market. Public-private partnerships are also playing a pivotal role in driving progress, as stakeholders collaborate to develop sustainable waste management systems and promote a more responsible approach to textile production and disposal.
How is the Textile Industry Waste Management Industry segmented?
The textile industry waste management industry research report provides comprehensive data (region-wise segment analysis), with forecasts and estimates in "USD million" for the period 2025-2029, as well as historical data from 2019-2023 for the following segments.
- Service Type
- Landfill
- Open dumping
- Incineration
- Recycling
- Composting and anaerobic digestion
- Material
- Natural fibers
- Synthetic fibers
- Blended fabrics
- Type
- Hazardous
- Plastic
- Polyester
- Others
- Geography
- APAC
- Australia
- China
- India
- Japan
- South Korea
- North America
- US
- Canada
- Europe
- France
- Germany
- UK
- Middle East and Africa
- South America
- APAC
By Service Type Insights
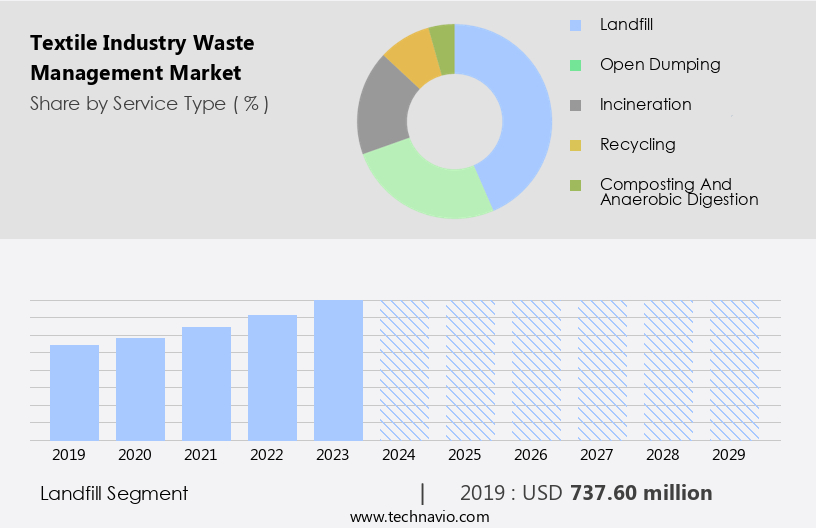
The landfill segment is estimated to witness significant growth during the forecast period. Textile waste management remains a significant challenge for the global industry, with much of it ending up in landfills due to the lack of cost-effective alternatives. This practice contributes to environmental pollution and resource depletion. Recycling and reusing textile waste can be expensive and time-consuming, necessitating substantial investments in infrastructure and technology. In contrast, landfill disposal is perceived as a quick and low-cost solution, requiring minimal sorting and processing. However, the circular economy is gaining traction in the textile sector, promoting waste reduction and recycling. Waste sorting, material recovery, and fiber recovery are essential components of textile waste management solutions.
Mechanical and chemical recycling methods are used to transform textile waste into recycled fibers and textiles, contributing to sustainable material production. Waste characterization, composition analysis, and waste stream optimization are crucial for effective waste management. Segregating textile waste streams into pre-consumer and post-consumer categories facilitates the application of appropriate recycling techniques. Textile upcycling, fiber-to-fiber recycling, textile-to-textile recycling, and textile-to-non-textile recycling are some of the methods employed in the industry. Bio-based textiles and recycled fibers are increasingly popular in sustainable textile production. Corporate social responsibility, ethical sourcing, and consumer awareness are driving the demand for eco-friendly textiles. Waste reduction strategies, such as zero waste and closed-loop systems, are being adopted to minimize textile waste.
Waste management technology and services, as well as waste management consultants, play a vital role in optimizing textile waste management processes. Policy and regulation, industry standards, and waste management technology continue to evolve, driving innovation in the textile industry. The apparel industry, a significant contributor to textile waste, is also embracing sustainable consumption and waste minimization practices.
Get a glance at the market report of share of various segments Request Free Sample
The Landfill segment was valued at USD 737.60 billion in 2019 and showed a gradual increase during the forecast period.
Regional Analysis
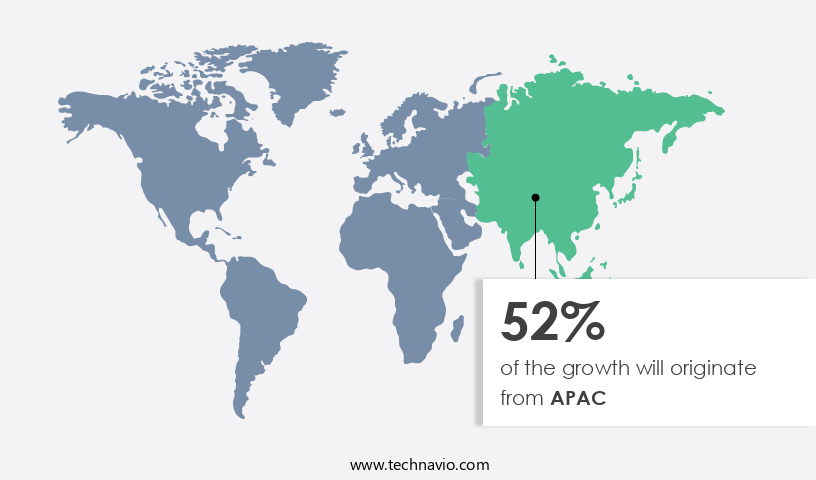
APAC is estimated to contribute 52% to the growth of the global market during the forecast period. Technavio's analysts have elaborately explained the regional trends and drivers that shape the market during the forecast period.
For more insights on the market size of various regions, Request Free Sample
The market in Asia Pacific (APAC) is gaining momentum due to the region's substantial textile production capacity and increasing focus on sustainable practices. Strict environmental regulations enforced by governments in countries like China, India, and Bangladesh are driving the adoption of waste management solutions in the textile sector. These regulations aim to ensure responsible disposal of textile waste, creating opportunities for waste management companies to offer innovative recycling and repurposing technologies. Waste reduction and recycling are key priorities in the textile industry, with fiber recovery, textile recycling, and upcycling being crucial components of the circular economy.
Waste sorting, material recovery, and waste collection are essential waste management practices in the textile supply chain. Waste treatment and disposal methods, including waste auditing, are also crucial to minimize environmental impact. The textile industry generates both pre-consumer and post-consumer waste streams, necessitating various waste characterization, composition analysis, optimization, and segregation techniques. Mechanical and chemical recycling, fiber-to-fiber and textile-to-textile recycling, textile-to-non-textile recycling, and bio-based textiles are some of the waste management strategies employed in the industry. Sustainable materials, such as recycled fibers and eco-friendly textiles, are increasingly popular in the fashion industry. Waste reduction strategies, waste minimization, zero waste, closed-loop systems, life cycle assessment, carbon footprint reduction, sustainable consumption, consumer awareness, ethical sourcing, and corporate social responsibility are essential for reducing the environmental impact of textile production.
Policy and regulation, industry standards, waste management technology, and waste management services are critical factors shaping the market. Waste management consultants play a vital role in helping textile manufacturing companies implement effective waste management strategies and meet regulatory requirements.
Market Dynamics
Our researchers analyzed the data with 2024 as the base year, along with the key drivers, trends, and challenges. A holistic analysis of drivers will help companies refine their marketing strategies to gain a competitive advantage.
What are the key market drivers leading to the rise in the adoption of Textile Industry Waste Management Industry?
- Increasing awareness about sustainability and environmental protection is the key driver of the market. The market is experiencing significant growth due to the increasing emphasis on sustainability and environmental protection. With mounting environmental concerns, textile manufacturers are taking proactive steps to minimize their ecological footprint. The use of sustainable materials, such as organic cotton, recycled polyester, and bamboo, is becoming increasingly popular.
- These materials not only have a reduced environmental impact but also consume fewer resources during production. For instance, Hennes and Mauritz AB (H&M), a leading clothing company, offers a clothing line made from recycled polyester and organic cotton, which significantly decreases the environmental impact compared to traditional textile production methods. This shift towards sustainability is a positive development for both the textile industry and the environment.
What are the market trends shaping the Textile Industry Waste Management Industry?
- Integration of AI and IoT, enabling better monitoring and reduction of textile waste is the upcoming market growth and trends. Textile industry waste management is undergoing a transformation through the adoption of advanced technologies such as artificial intelligence (AI) and the Internet of Things (IoT). These innovations enhance waste management practices by allowing textile manufacturers to monitor their supply chains more effectively, from raw material sourcing to product manufacturing. Notably, AI and IoT have significantly influenced textile waste recycling. Traditional methods of manually sorting textiles for recycling were labor-intensive and time-consuming.
- However, AI-powered sorting machines have revolutionized the process, streamlining it and contributing to more sustainable textile manufacturing. By utilizing these technologies, the textile industry can minimize waste, optimize resources, and promote eco-friendly practices. Such factors will ncrease the market trends and analysis during the forecast period.
What challenges does the Textile Industry Waste Management Industry face during its growth?
- Lack of proper disposal facilities is a key challenge affecting the industry's growth. The textile industry is a significant global sector, generating substantial waste during production. However, the management of this waste remains a pressing concern due to insufficient disposal facilities. For instance, the manufacturing of denim jeans necessitates a considerable amount of water, chemicals, and renewable energy, resulting in a substantial waste output.
- Regrettably, due to the absence of proper disposal methods, this waste often ends up in landfills, leading to environmental pollution and potential health hazards for nearby communities. This issue is not only detrimental to the environment but also negatively impacts the textile industry's reputation and sustainability. The need for effective textile waste management solutions is increasingly important to mitigate the environmental and health risks associated with textile waste.
Exclusive Customer Landscape
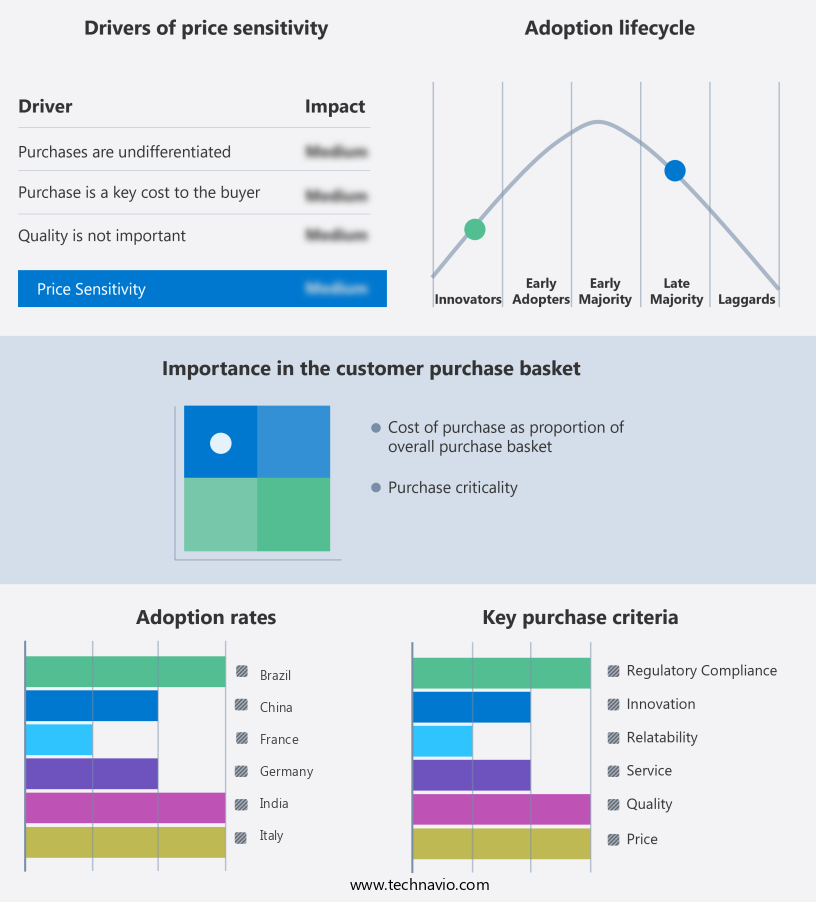
The textile industry waste management market forecasting report includes the adoption lifecycle of the market, covering from the innovator's stage to the laggard's stage. It focuses on adoption rates in different regions based on penetration. Furthermore, the textile industry waste management market report also includes key purchase criteria and drivers of price sensitivity to help companies evaluate and develop their market growth analysis strategies.
Customer Landscape
Key Companies & Market Insights
Companies are implementing various strategies, such as strategic alliances, textile industry waste management market forecast, partnerships, mergers and acquisitions, geographical expansion, and product/service launches, to enhance their presence in the industry.
Aditya Birla Management Corp. Pvt. Ltd. - The company offers textile industry waste management through SaXcell textile waste pulping technology combined with Birla advanced wet spinning expertise results in high-quality sustainable SaXcell recycled fibres. These fibres serve the circular textile needs of customers at commercial scale.
The industry research and growth report includes detailed analyses of the competitive landscape of the market and information about key companies, including:
- Aditya Birla Management Corp. Pvt. Ltd.
- BLS Ecotech Ltd.
- Boer Group
- Evrnu Inc.
- FABSCRAP
- Infinited Fiber Co.
- Lenzing AG
- PROCOTEX Belgium SA
- Pure Waste Textiles Oy
- Re NewCell AB
- Recover Textile Systems S.L
- Remondis SE and Co. KG
- SAAHAS WASTE MANAGEMENT Pvt. Ltd.
- TEXAID Textilverwertungs AG
- Unifi Inc.
- Veolia Environnement SA
- Worn Again Technologies
Qualitative and quantitative analysis of companies has been conducted to help clients understand the wider business environment as well as the strengths and weaknesses of key industry players. Data is qualitatively analyzed to categorize companies as pure play, category-focused, industry-focused, and diversified; it is quantitatively analyzed to categorize companies as dominant, leading, strong, tentative, and weak.
Research Analyst Overview
The textile industry is a significant contributor to global waste generation, with an estimated 92 million tons of textile waste produced annually. This waste arises from various sources, including pre-consumer and post-consumer streams. Pre-consumer waste originates from the manufacturing process, such as cutting room floor trims and fabric scraps. Post-consumer waste comes from discarded textiles, clothing, and shoes. Textile waste management has gained increasing attention due to the growing emphasis on sustainability and circular economy principles. Waste reduction and recycling are key strategies to minimize the environmental impact of textile production. Waste sorting and segregation are essential steps in the waste management process, enabling effective material recovery.
Fiber recovery is a critical aspect of textile waste management, with various recycling techniques available. Mechanical recycling involves the reprocessing of textile waste into new fibers, while chemical recycling converts waste into raw materials for the production of new textiles. Fiber-to-fiber recycling creates new textiles from the same fiber type, while textile-to-textile recycling involves the conversion of one textile type into another. Textile-to-non-textile recycling transforms textile waste into other products, such as insulation or automotive materials. Bio-based textiles and recycled fibers are gaining popularity as sustainable alternatives to virgin materials. These materials offer reduced carbon footprints and contribute to the circular economy.
Sustainable materials and eco-friendly textiles are essential components of closed-loop systems, which minimize waste and promote resource efficiency. The textile industry's waste management landscape is shaped by various factors, including consumer awareness, ethical sourcing, corporate social responsibility, and policy and regulation. Consumer awareness and demand for sustainable textiles are driving the adoption of waste reduction strategies and circular economy principles. Ethical sourcing and corporate social responsibility initiatives are also influencing the industry's approach to waste management. Industry standards and waste management technology play a crucial role in optimizing waste streams and minimizing environmental impact. Waste characterization and composition analysis are essential for comprehending the nature of textile waste and identifying opportunities for recovery.
Waste stream optimization and segregation are essential for effective waste management and resource recovery. Waste management solutions, services, and consultants offer expertise and support for textile businesses seeking to improve their waste management practices. These providers offer a range of services, from waste auditing and treatment to disposal and technology implementation. By partnering with waste management professionals, textile companies can reduce their environmental footprint and contribute to a more sustainable textile industry. The textile supply chain, including textile manufacturing and the fashion industry, plays a significant role in textile waste generation. Collaboration and innovation among stakeholders are essential for addressing the challenges of textile waste management and promoting a circular economy. By embracing circular economy principles and adopting sustainable waste management practices, the textile industry can reduce its environmental impact and contribute to a more sustainable future.
|
Market Scope |
|
|
Report Coverage |
Details |
|
Page number |
230 |
|
Base year |
2024 |
|
Historic period |
2019-2023 |
|
Forecast period |
2025-2029 |
|
Growth momentum & CAGR |
Accelerate at a CAGR of 17.8% |
|
Market growth 2025-2029 |
USD 4.49 billion |
|
Market structure |
Fragmented |
|
YoY growth 2024-2025(%) |
12.8 |
|
Key countries |
US, China, Japan, India, UK, Canada, South Korea, Germany, France, and Australia |
|
Competitive landscape |
Leading Companies, Market Positioning of Companies, Competitive Strategies, and Industry Risks |
What are the Key Data Covered in this Textile Industry Waste Management Market Research and Growth Report?
- CAGR of the Textile Industry Waste Management industry during the forecast period
- Detailed information on factors that will drive the growth and forecasting between 2025 and 2029
- Precise estimation of the size of the market and its contribution to the industry in focus to the parent market analysis and report
- Accurate predictions about upcoming growth and trends and changes in consumer behaviour
- Growth of the market across APAC, North America, Europe, Middle East and Africa, and South America
- Thorough analysis of the market's competitive landscape and detailed information about companies
- Comprehensive analysis of factors that will challenge the textile industry waste management market growth and forecasting
We can help! Our analysts can customize this textile industry waste management market research report to meet your requirements.
 RIA -
RIA - 
