Textile Machinery Market Analysis, Size, and Forecast 2025-2029: APAC (China, India, and Japan), Europe (Germany, Italy, and France), North America (US, Canada, and Mexico), Middle East and Africa (Turkey, South Africa, and UAE), South America (Brazil, Colombia, and Argentina), and Rest of World (ROW)

Textile Machinery Market Analysis, Size, and Forecast 2025-2029:
APAC (China, India, and Japan), Europe (Germany, Italy, and France), North America (US, Canada, and Mexico), Middle East and Africa (Turkey, South Africa, and UAE), South America (Brazil, Colombia, and Argentina), and Rest of World (ROW)

Published: Dec 2025 303 Pages SKU: IRTNTR45752

Market Overview at a Glance

$12.14 B
Market Opportunity
7.1%
CAGR 2024 - 2029
64.9%
APAC Growth
$6.40 B
Spinning machinery segment 2023

Textile Machinery Market Size 2025-2029

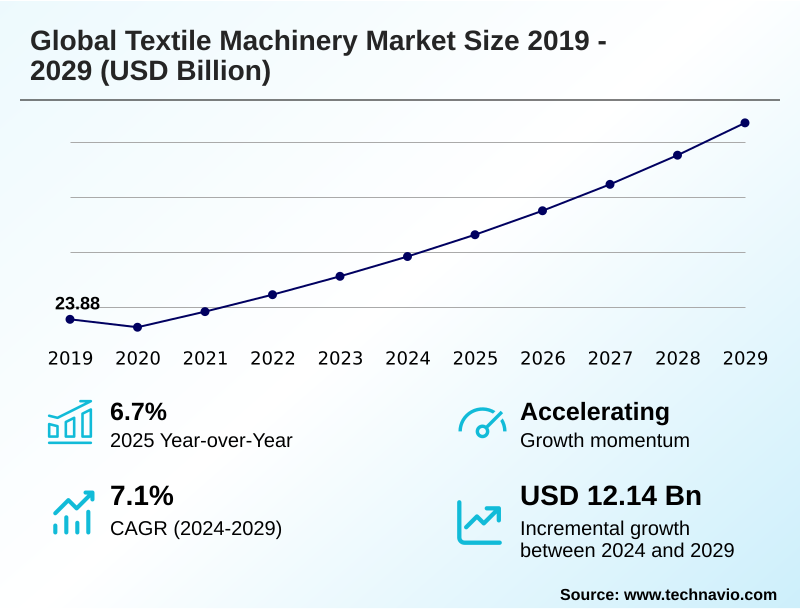
The textile machinery market size is valued to increase by USD 12.14 billion, at a CAGR of 7.1% from 2024 to 2029. Technological advancements will drive the textile machinery market.

Major Market Trends & Insights

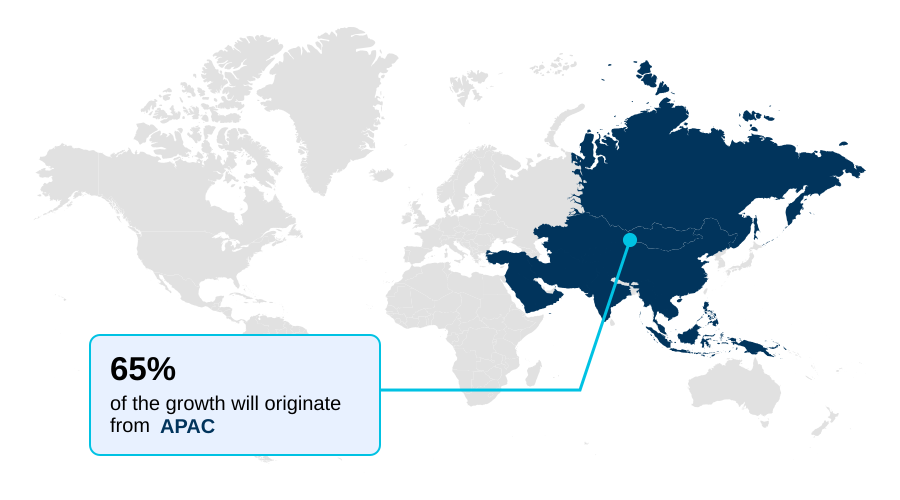
  • APAC dominated the market and accounted for a 64.9% growth during the forecast period.
  • By Product - Spinning machinery segment was valued at USD 6.40 billion in 2023
  • By End-user - Garment and apparel factory segment accounted for the largest market revenue share in 2023

Market Size & Forecast

  • Market Opportunities: USD 17.86 billion
  • Market Future Opportunities: USD 12.14 billion
  • CAGR from 2024 to 2029 : 7.1%

Market Summary

  • The textile machinery market is undergoing a significant transformation, driven by the dual imperatives of efficiency and sustainability. The integration of advanced technologies like automated textile production and Industry 4.0 in textiles is no longer optional but a core strategic necessity. Smart factory solutions, powered by IoT-enabled machinery and AI in textile manufacturing, are becoming standard.
  • These systems utilize predictive maintenance systems and advanced sensor technology to minimize downtime and ensure real-time quality monitoring. For example, a modern weaving mill can leverage robotic material handling and automated defect detection to reduce waste and accelerate production schedules, directly impacting profitability.
  • This shift is also evident in the push for greener manufacturing, with substantial investment in water-saving technologies and circular economy machinery designed for recycled fiber processing. Equipment such as energy-efficient motors and machinery for sustainable dyeing processes, including foam dyeing technology and supercritical CO2 dyeing, highlight the industry's commitment to reducing its environmental footprint.
  • Simultaneously, the demand for high-value products necessitates specialized equipment for technical textile manufacturing and smart textile integration, including computerized flat knitting and high-performance fiber processing capabilities. This complex landscape requires continuous innovation from manufacturers to meet evolving demands.

What will be the Size of the Textile Machinery Market during the forecast period?

Get Key Insights on Market Forecast (PDF) Request Free Sample

How is the Textile Machinery Market Segmented?

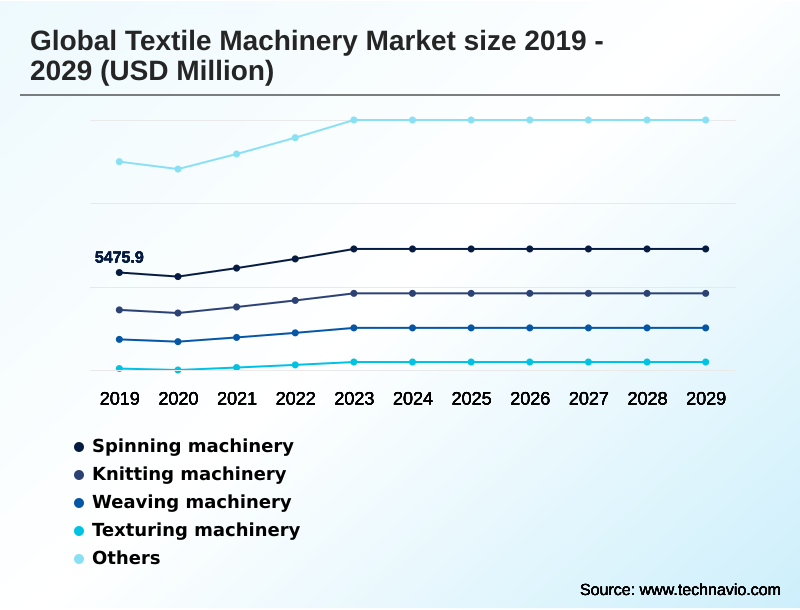
The textile machinery industry research report provides comprehensive data (region-wise segment analysis), with forecasts and estimates in "USD million" for the period 2025-2029, as well as historical data from 2019-2023 for the following segments.

  • Product
    • Spinning machinery
    • Knitting machinery
    • Weaving machinery
    • Texturing machinery
    • Others
  • End-user
    • Garment and apparel factory
    • Cotton and wool mills
    • Home textile
    • Technical textile
  • Type
    • Fully automatic
    • Semi-automatic
    • Manual
  • Geography
    • APAC
      • China
      • India
      • Japan
    • Europe
      • Germany
      • Italy
      • France
    • North America
      • US
      • Canada
      • Mexico
    • Middle East and Africa
      • Turkey
      • South Africa
      • UAE
    • South America
      • Brazil
      • Colombia
      • Argentina
    • Rest of World (ROW)

By Product Insights

The spinning machinery segment is estimated to witness significant growth during the forecast period.

The spinning machinery segment is foundational, converting raw fibers into yarn through systems like ring spinning systems and rotor spinning machines.

Modern equipment emphasizes yarn production efficiency and fabric quality control, driven by the integration of advanced sensor technology for real-time quality monitoring. AI in textile manufacturing enables predictive adjustments, optimizing the entire production workflow optimization.

This evolution is critical for operational cost reduction and labor cost mitigation, particularly as the industry shifts toward complex applications and recycled fiber processing.

For instance, the adoption of data-driven decision making has been shown to improve yarn consistency by over 15%, a crucial factor for downstream processes. The focus remains on enhancing machinery capabilities to handle diverse materials while ensuring consistent, high-quality output.

Request Free Sample

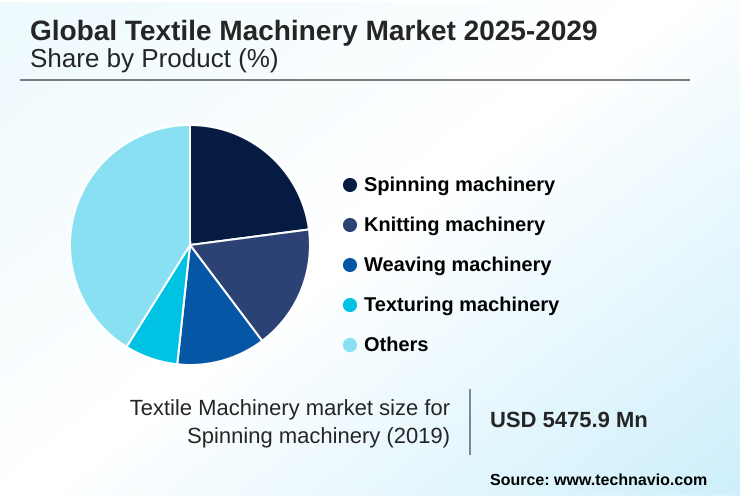
The Spinning machinery segment was valued at USD 6.40 billion in 2023 and showed a gradual increase during the forecast period.

Request Free Sample

Regional Analysis

APAC is estimated to contribute 64.9% to the growth of the global market during the forecast period.Technavio’s analysts have elaborately explained the regional trends and drivers that shape the market during the forecast period.

See How Textile Machinery Market Demand is Rising in APAC Request Free Sample

The geographic landscape of the textile machinery market is heavily concentrated in the APAC region, which accounts for over 64% of the incremental growth opportunity.

This dominance is fueled by large-scale manufacturing hubs investing in automated textile production and smart factory solutions to enhance yarn production efficiency.

In contrast, Europe, representing nearly 16% of the opportunity, focuses on high-value equipment for technical textile manufacturing and sustainable dyeing processes, emphasizing precision textile processing and fabric quality control.

North America's market is driven by labor cost mitigation through advanced automation, such as robotic material handling, and the adoption of flexible manufacturing systems for bespoke textile production.

This regional specialization reflects different economic pressures and strategic priorities, with APAC focusing on volume and efficiency, while Western markets prioritize innovation, mass customization enablement, and high-performance fiber processing.

Market Dynamics

Our researchers analyzed the data with 2024 as the base year, along with the key drivers, trends, and challenges. A holistic analysis of drivers will help companies refine their marketing strategies to gain a competitive advantage.

  • Strategic decisions in the textile machinery market increasingly involve a nuanced cost-benefit analysis of smart textile machinery, weighing upfront investment against long-term operational gains. The debate between fully automatic vs semi-automatic textile machinery is central to this, with choices often depending on regional labor costs and production scale.
  • A key driver for modernization is the industry's shift toward sustainability, which has spurred demand for machinery for recycling post-consumer textiles and technology for reducing microplastic shedding from textiles. Businesses are exploring sustainable options for denim finishing machinery and analyzing water usage in conventional vs digital printing to align with environmental goals.
  • From an operational perspective, companies are implementing best practices for predictive maintenance in spinning mills and optimizing blowroom lines for natural fibers to boost efficiency. The impact of automation on textile labor costs is significant, with some facilities reallocating resources after achieving more than double the output with the same headcount.
  • The ROI of IoT integration in knitting factories is another critical metric, as is the role of AI in reducing textile manufacturing defects. For specialized sectors, firms are upgrading weaving looms for technical textiles, investing in equipment for producing medical-grade nonwovens, and exploring machinery for integrating sensors into fabrics to capture high-value market segments.

What are the key market drivers leading to the rise in the adoption of Textile Machinery Industry?

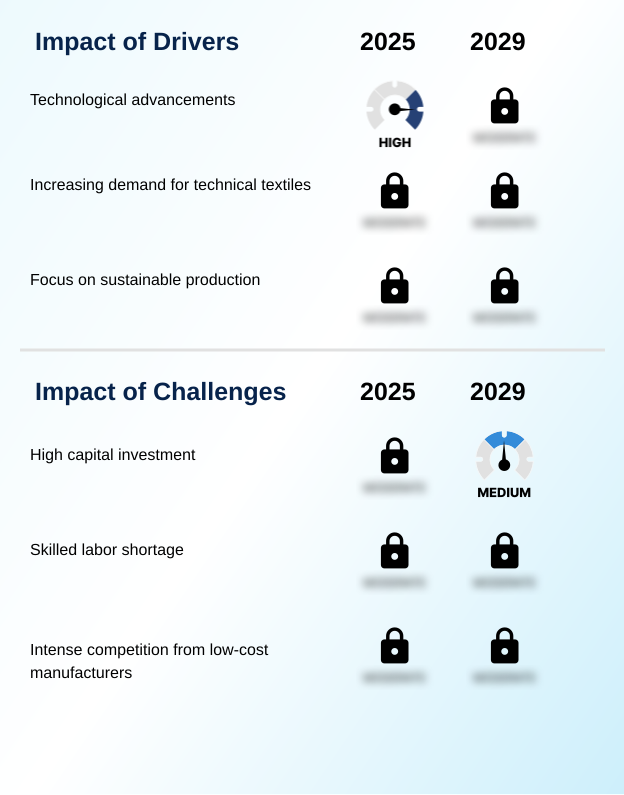
  • Technological advancements represent a paramount driver for the market, fundamentally reshaping manufacturing processes and product capabilities.

  • Technological advancements are the primary driver, directly impacting production efficiency and product capabilities. The deployment of IoT-enabled machinery facilitates textile supply chain optimization, with some manufacturers reporting a 20% increase in overall equipment effectiveness.
  • The increasing demand for technical textiles is fueling investment in specialized equipment, such as high-speed weaving of carbon fiber composites and advanced machinery for producing advanced filtration media and high-strength geotextiles. These systems offer superior precision textile processing.
  • Furthermore, the push for sustainable production drives the development of energy-efficient motors and yarn conditioning systems, which together can lower a plant's energy consumption by over 15%.
  • This innovation imperative is crucial for companies aiming to enhance asset lifecycle management and maintain a competitive edge in a rapidly evolving marketplace.

What are the market trends shaping the Textile Machinery Industry?

  • The pervasive trend of automation and digitalization is profoundly reshaping the manufacturing spectrum, driving innovation and enhancing efficiency across the entire production process.

  • Key market trends revolve around sustainability and digitalization, creating new operational paradigms. The adoption of circular economy machinery is accelerating, with new systems for recycled fiber processing demonstrating a 30% improvement in handling blended recycled fibers.
  • Concurrently, digital textile printing continues to disrupt conventional methods, offering on-demand textile manufacturing capabilities that reduce water usage by up to 90% and cut lead times in half. The rise of smart textile integration is also a significant trend, supported by innovations in computerized flat knitting and machinery capable of embedding sensors.
  • This shift toward intelligent and eco-conscious production is further enabled by advancements in foam dyeing technology and supercritical CO2 dyeing, which are central to achieving corporate sustainability goals and meeting stricter regulatory standards for resource utilization efficiency.

What challenges does the Textile Machinery Industry face during its growth?

  • The substantial capital investment required for modern textile equipment presents a significant challenge, influencing adoption rates across the industry.

  • The high capital required for state-of-the-art equipment remains a significant barrier, particularly for small and medium-sized enterprises. Investing in fully automated systems, such as air-jet looms and water-jet looms, requires substantial upfront expenditure, even though it promises long-term operational cost reduction.
  • A persistent skilled labor shortage further complicates the adoption of advanced machinery, as operating and maintaining complex systems with manufacturing execution systems (MES) demands specialized expertise. This skills gap can lead to suboptimal asset utilization, with some firms reporting that new equipment operates at only 70% of its potential capacity in the first year.
  • Intense competition from low-cost manufacturers also pressures margins, making it difficult to justify large investments in premium warp knitting technology or rotor spinning machines without clear and immediate ROI.

Exclusive Technavio Analysis on Customer Landscape

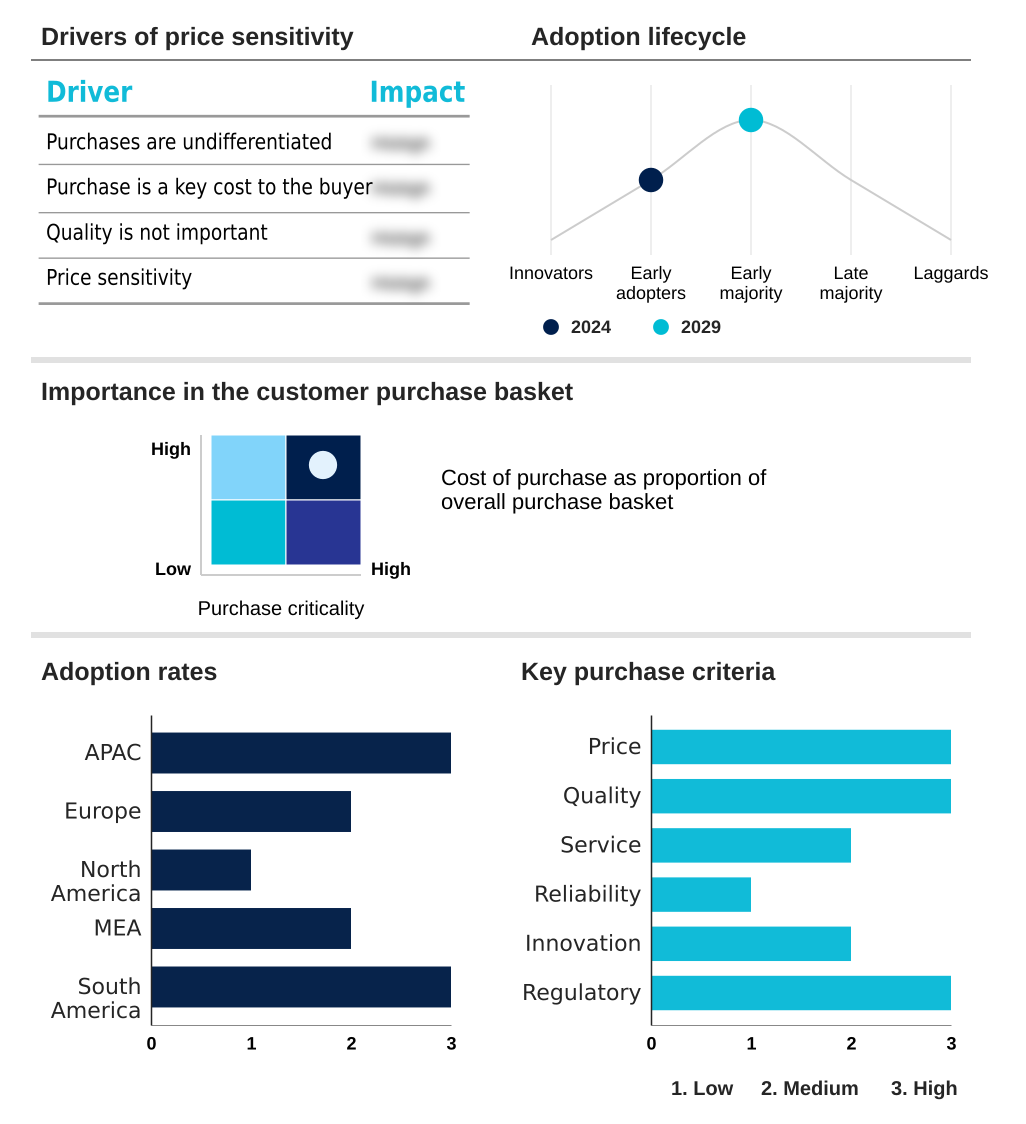
The textile machinery market forecasting report includes the adoption lifecycle of the market, covering from the innovator’s stage to the laggard’s stage. It focuses on adoption rates in different regions based on penetration. Furthermore, the textile machinery market report also includes key purchase criteria and drivers of price sensitivity to help companies evaluate and develop their market growth analysis strategies.

Customer Landscape of Textile Machinery Industry

Competitive Landscape

Companies are implementing various strategies, such as strategic alliances, textile machinery market forecast, partnerships, mergers and acquisitions, geographical expansion, and product/service launches, to enhance their presence in the industry.

ATE Pvt. Ltd. - Provides advanced pneumatic automation components and integrated control systems, enhancing the operational efficiency of spinning, weaving, and finishing machinery.

The industry research and growth report includes detailed analyses of the competitive landscape of the market and information about key companies, including:

  • ATE Pvt. Ltd.
  • Batliboi Ltd.
  • Camozzi Group SpA
  • karl mayer stoll textilmaschinenfabrik Gmbh
  • Lakshmi Machine Works Ltd.
  • Qingdao Jingtian Textile Machinery Co. Ltd.
  • Qingdao Lebon Industry Co. Ltd.
  • Radici Partecipazioni Spa
  • Rieter Holding AG
  • Santex Rimar Group
  • Saurer Intelligent Technology AG
  • SHIMA SEIKI MFG Ltd.
  • Toyota Industries Corp.
  • Trutzschler Group SE
  • TSUDAKOMA Corp.
  • VANDEWIELE NV
  • Yamuna Machine Works Ltd.

Qualitative and quantitative analysis of companies has been conducted to help clients understand the wider business environment as well as the strengths and weaknesses of key industry players. Data is qualitatively analyzed to categorize companies as pure play, category-focused, industry-focused, and diversified; it is quantitatively analyzed to categorize companies as dominant, leading, strong, tentative, and weak.

Recent Development and News in Textile machinery market

  • In September 2024, Santex Rimar Group launched a new generation of dyeing machines that reduce water consumption by up to 40% through an advanced closed-loop recycling system, addressing the industry's push for sustainable production.
  • In November 2024, Karl Mayer Stoll Textilmaschinenfabrik GmbH entered a strategic partnership with a leading electronics firm to co-develop knitting machinery capable of seamlessly integrating flexible sensors for the smart textiles market.
  • In February 2025, Lakshmi Machine Works Ltd. announced a USD 50 million investment to establish a new manufacturing facility in Vietnam, aiming to better serve the rapidly growing Southeast Asian textile industry.
  • In April 2025, Rieter Holding AG acquired a European software startup specializing in AI-powered manufacturing execution systems (MES) to enhance its digital offerings for smart factory integration and predictive maintenance.

Dive into Technavio’s robust research methodology, blending expert interviews, extensive data synthesis, and validated models for unparalleled Textile Machinery Market insights. See full methodology.

Market Scope
Page number 303
Base year 2024
Historic period 2019-2023
Forecast period 2025-2029
Growth momentum & CAGR Accelerate at a CAGR of 7.1%
Market growth 2025-2029 USD 12143.0 million
Market structure Fragmented
YoY growth 2024-2025(%) 6.7%
Key countries China, India, Japan, South Korea, Australia, Indonesia, Germany, Italy, France, UK, Spain, The Netherlands, US, Canada, Mexico, Turkey, South Africa, UAE, Saudi Arabia, Israel, Brazil, Colombia and Argentina
Competitive landscape Leading Companies, Market Positioning of Companies, Competitive Strategies, and Industry Risks

Request Free Sample

Research Analyst Overview

  • The textile machinery market is defined by a rapid technological evolution, compelling businesses to re-evaluate capital expenditure on next-generation assets. The integration of Industry 4.0 in textiles is a critical boardroom consideration, as smart factory solutions directly influence long-term competitiveness.
  • Modern equipment, including advanced spinning machinery, weaving machinery, and knitting machinery, now incorporates predictive maintenance systems and AI in textile manufacturing, with some operators achieving a 20% reduction in unplanned downtime. The push for sustainability is driving innovation in dyeing and finishing equipment, with water-saving technologies and circular economy machinery becoming key differentiators.
  • Furthermore, the diversification into technical textile manufacturing and smart textile integration requires investment in specialized nonwoven machinery and high-performance fiber processing capabilities. Success depends on leveraging automated textile production, including robotic material handling and automated defect detection, alongside digital tools like CAD/CAM for textiles to streamline operations from design to output.
  • The emphasis on real-time quality monitoring via advanced sensor technology ensures that output consistently meets stringent performance standards.

What are the Key Data Covered in this Textile Machinery Market Research and Growth Report?

  • What is the expected growth of the Textile Machinery Market between 2025 and 2029?

    • USD 12.14 billion, at a CAGR of 7.1%

  • What segmentation does the market report cover?

    • The report is segmented by Product (Spinning machinery, Knitting machinery, Weaving machinery, Texturing machinery, and Others), End-user (Garment and apparel factory, Cotton and wool mills, Home textile, and Technical textile), Type (Fully automatic, Semi-automatic, and Manual) and Geography (APAC, Europe, North America, Middle East and Africa, South America)

  • Which regions are analyzed in the report?

    • APAC, Europe, North America, Middle East and Africa and South America

  • What are the key growth drivers and market challenges?

    • Technological advancements, High capital investment

  • Who are the major players in the Textile Machinery Market?

    • ATE Pvt. Ltd., Batliboi Ltd., Camozzi Group SpA, karl mayer stoll textilmaschinenfabrik Gmbh, Lakshmi Machine Works Ltd., Qingdao Jingtian Textile Machinery Co. Ltd., Qingdao Lebon Industry Co. Ltd., Radici Partecipazioni Spa, Rieter Holding AG, Santex Rimar Group, Saurer Intelligent Technology AG, SHIMA SEIKI MFG Ltd., Toyota Industries Corp., Trutzschler Group SE, TSUDAKOMA Corp., VANDEWIELE NV and Yamuna Machine Works Ltd.

Market Research Insights

  • The market's dynamics are shaped by a relentless pursuit of operational excellence and supply chain resilience. The adoption of manufacturing execution systems (MES) and enterprise resource planning (ERP) platforms facilitates textile supply chain optimization, with leading firms achieving a 15% reduction in lead times through better production schedule optimization.
  • Innovations in automated sewing workstations are pivotal for labor cost mitigation, improving output per operator by over 25% in some factories. This drive for efficiency extends to waste reduction in cutting and shorter time-to-market cycles, which are critical for on-demand textile manufacturing.
  • Furthermore, the focus on high-value textile applications is pushing manufacturers toward flexible manufacturing systems that enable mass customization enablement. The integration of these technologies supports enhanced operator safety and data-driven decision making, ultimately leading to improved asset lifecycle management and overall resource utilization efficiency.

We can help! Our analysts can customize this textile machinery market research report to meet your requirements.

Get in touch

1. Executive Summary

1.1 Market overview

Executive Summary - Chart on Market Overview
Executive Summary - Data Table on Market Overview
Executive Summary - Chart on Global Market Characteristics
Executive Summary - Chart on Market by Geography
Executive Summary - Chart on Market Segmentation by Product
Executive Summary - Chart on Market Segmentation by End-user
Executive Summary - Chart on Market Segmentation by Type
Executive Summary - Chart on Incremental Growth
Executive Summary - Data Table on Incremental Growth
Executive Summary - Chart on Company Market Positioning

2. Technavio Analysis

2.1 Analysis of price sensitivity, lifecycle, customer purchase basket, adoption rates, and purchase criteria

2.2 Criticality of inputs and Factors of differentiation

Chart on Overview on criticality of inputs and factors of differentiation

2.3 Factors of disruption

Chart on Overview on factors of disruption

2.4 Impact of drivers and challenges

Chart on Impact of drivers and challenges in 2024 and 2029

3. Market Landscape

3.1 Market ecosystem

Chart on Parent Market
Data Table on - Parent Market

3.2 Market characteristics

Chart on Market characteristics analysis

3.3 Value chain analysis

Chart on Value chain analysis

4. Market Sizing

4.1 Market definition

Data Table on Offerings of companies included in the market definition

4.2 Market segment analysis

Market segments

4.3 Market size 2024

4.4 Market outlook: Forecast for 2024-2029

Chart on Global - Market size and forecast 2024-2029 ($ million)
Data Table on Global - Market size and forecast 2024-2029 ($ million)
Chart on Global Market: Year-over-year growth 2024-2029 (%)
Data Table on Global Market: Year-over-year growth 2024-2029 (%)

5. Historic Market Size

5.1 Global Textile Machinery Market 2019 - 2023

Historic Market Size - Data Table on Global Textile Machinery Market 2019 - 2023 ($ million)

5.2 Product segment analysis 2019 - 2023

Historic Market Size - Product Segment 2019 - 2023 ($ million)

5.3 End-user segment analysis 2019 - 2023

Historic Market Size - End-user Segment 2019 - 2023 ($ million)

5.4 Type segment analysis 2019 - 2023

Historic Market Size - Type Segment 2019 - 2023 ($ million)

5.5 Geography segment analysis 2019 - 2023

Historic Market Size - Geography Segment 2019 - 2023 ($ million)

5.6 Country segment analysis 2019 - 2023

Historic Market Size - Country Segment 2019 - 2023 ($ million)

6. Qualitative Analysis

6.1 Impact of AI on global textile machinery market

7. Five Forces Analysis

7.1 Five forces summary

Five forces analysis - Comparison between 2024 and 2029

7.2 Bargaining power of buyers

Bargaining power of buyers - Impact of key factors 2024 and 2029

7.3 Bargaining power of suppliers

Bargaining power of suppliers - Impact of key factors in 2024 and 2029

7.4 Threat of new entrants

Threat of new entrants - Impact of key factors in 2024 and 2029

7.5 Threat of substitutes

Threat of substitutes - Impact of key factors in 2024 and 2029

7.6 Threat of rivalry

Threat of rivalry - Impact of key factors in 2024 and 2029

7.7 Market condition

Chart on Market condition - Five forces 2024 and 2029

8. Market Segmentation by Product

8.1 Market segments

Chart on Product - Market share 2024-2029 (%)
Data Table on Product - Market share 2024-2029 (%)

8.2 Comparison by Product

Chart on Comparison by Product
Data Table on Comparison by Product

8.3 Spinning machinery - Market size and forecast 2024-2029

Chart on Spinning machinery - Market size and forecast 2024-2029 ($ million)
Data Table on Spinning machinery - Market size and forecast 2024-2029 ($ million)
Chart on Spinning machinery - Year-over-year growth 2024-2029 (%)
Data Table on Spinning machinery - Year-over-year growth 2024-2029 (%)

8.4 Knitting machinery - Market size and forecast 2024-2029

Chart on Knitting machinery - Market size and forecast 2024-2029 ($ million)
Data Table on Knitting machinery - Market size and forecast 2024-2029 ($ million)
Chart on Knitting machinery - Year-over-year growth 2024-2029 (%)
Data Table on Knitting machinery - Year-over-year growth 2024-2029 (%)

8.5 Weaving machinery - Market size and forecast 2024-2029

Chart on Weaving machinery - Market size and forecast 2024-2029 ($ million)
Data Table on Weaving machinery - Market size and forecast 2024-2029 ($ million)
Chart on Weaving machinery - Year-over-year growth 2024-2029 (%)
Data Table on Weaving machinery - Year-over-year growth 2024-2029 (%)

8.6 Texturing machinery - Market size and forecast 2024-2029

Chart on Texturing machinery - Market size and forecast 2024-2029 ($ million)
Data Table on Texturing machinery - Market size and forecast 2024-2029 ($ million)
Chart on Texturing machinery - Year-over-year growth 2024-2029 (%)
Data Table on Texturing machinery - Year-over-year growth 2024-2029 (%)

8.7 Others - Market size and forecast 2024-2029

Chart on Others - Market size and forecast 2024-2029 ($ million)
Data Table on Others - Market size and forecast 2024-2029 ($ million)
Chart on Others - Year-over-year growth 2024-2029 (%)
Data Table on Others - Year-over-year growth 2024-2029 (%)

8.8 Market opportunity by Product

Market opportunity by Product ($ million)
Data Table on Market opportunity by Product ($ million)

9. Market Segmentation by End-user

9.1 Market segments

Chart on End-user - Market share 2024-2029 (%)
Data Table on End-user - Market share 2024-2029 (%)

9.2 Comparison by End-user

Chart on Comparison by End-user
Data Table on Comparison by End-user

9.3 Garment and apparel factory - Market size and forecast 2024-2029

Chart on Garment and apparel factory - Market size and forecast 2024-2029 ($ million)
Data Table on Garment and apparel factory - Market size and forecast 2024-2029 ($ million)
Chart on Garment and apparel factory - Year-over-year growth 2024-2029 (%)
Data Table on Garment and apparel factory - Year-over-year growth 2024-2029 (%)

9.4 Cotton and wool mills - Market size and forecast 2024-2029

Chart on Cotton and wool mills - Market size and forecast 2024-2029 ($ million)
Data Table on Cotton and wool mills - Market size and forecast 2024-2029 ($ million)
Chart on Cotton and wool mills - Year-over-year growth 2024-2029 (%)
Data Table on Cotton and wool mills - Year-over-year growth 2024-2029 (%)

9.5 Home textile - Market size and forecast 2024-2029

Chart on Home textile - Market size and forecast 2024-2029 ($ million)
Data Table on Home textile - Market size and forecast 2024-2029 ($ million)
Chart on Home textile - Year-over-year growth 2024-2029 (%)
Data Table on Home textile - Year-over-year growth 2024-2029 (%)

9.6 Technical textile - Market size and forecast 2024-2029

Chart on Technical textile - Market size and forecast 2024-2029 ($ million)
Data Table on Technical textile - Market size and forecast 2024-2029 ($ million)
Chart on Technical textile - Year-over-year growth 2024-2029 (%)
Data Table on Technical textile - Year-over-year growth 2024-2029 (%)

9.7 Market opportunity by End-user

Market opportunity by End-user ($ million)
Data Table on Market opportunity by End-user ($ million)

10. Market Segmentation by Type

10.1 Market segments

Chart on Type - Market share 2024-2029 (%)
Data Table on Type - Market share 2024-2029 (%)

10.2 Comparison by Type

Chart on Comparison by Type
Data Table on Comparison by Type

10.3 Fully automatic - Market size and forecast 2024-2029

Chart on Fully automatic - Market size and forecast 2024-2029 ($ million)
Data Table on Fully automatic - Market size and forecast 2024-2029 ($ million)
Chart on Fully automatic - Year-over-year growth 2024-2029 (%)
Data Table on Fully automatic - Year-over-year growth 2024-2029 (%)

10.4 Semi-automatic - Market size and forecast 2024-2029

Chart on Semi-automatic - Market size and forecast 2024-2029 ($ million)
Data Table on Semi-automatic - Market size and forecast 2024-2029 ($ million)
Chart on Semi-automatic - Year-over-year growth 2024-2029 (%)
Data Table on Semi-automatic - Year-over-year growth 2024-2029 (%)

10.5 Manual - Market size and forecast 2024-2029

Chart on Manual - Market size and forecast 2024-2029 ($ million)
Data Table on Manual - Market size and forecast 2024-2029 ($ million)
Chart on Manual - Year-over-year growth 2024-2029 (%)
Data Table on Manual - Year-over-year growth 2024-2029 (%)

10.6 Market opportunity by Type

Market opportunity by Type ($ million)
Data Table on Market opportunity by Type ($ million)

11. Customer Landscape

11.1 Customer landscape overview

Analysis of price sensitivity, lifecycle, customer purchase basket, adoption rates, and purchase criteria

12. Geographic Landscape

12.1 Geographic segmentation

Chart on Market share by geography 2024-2029 (%)
Data Table on Market share by geography 2024-2029 (%)

12.2 Geographic comparison

Chart on Geographic comparison
Data Table on Geographic comparison

12.3 APAC - Market size and forecast 2024-2029

Chart on APAC - Market size and forecast 2024-2029 ($ million)
Data Table on APAC - Market size and forecast 2024-2029 ($ million)
Chart on APAC - Year-over-year growth 2024-2029 (%)
Data Table on APAC - Year-over-year growth 2024-2029 (%)
Chart on Regional Comparison - APAC
Data Table on Regional Comparison - APAC

12.3.1 China - Market size and forecast 2024-2029

Chart on China - Market size and forecast 2024-2029 ($ million)
Data Table on China - Market size and forecast 2024-2029 ($ million)
Chart on China - Year-over-year growth 2024-2029 (%)
Data Table on China - Year-over-year growth 2024-2029 (%)

12.3.2 India - Market size and forecast 2024-2029

Chart on India - Market size and forecast 2024-2029 ($ million)
Data Table on India - Market size and forecast 2024-2029 ($ million)
Chart on India - Year-over-year growth 2024-2029 (%)
Data Table on India - Year-over-year growth 2024-2029 (%)

12.3.3 Japan - Market size and forecast 2024-2029

Chart on Japan - Market size and forecast 2024-2029 ($ million)
Data Table on Japan - Market size and forecast 2024-2029 ($ million)
Chart on Japan - Year-over-year growth 2024-2029 (%)
Data Table on Japan - Year-over-year growth 2024-2029 (%)

12.3.4 South Korea - Market size and forecast 2024-2029

Chart on South Korea - Market size and forecast 2024-2029 ($ million)
Data Table on South Korea - Market size and forecast 2024-2029 ($ million)
Chart on South Korea - Year-over-year growth 2024-2029 (%)
Data Table on South Korea - Year-over-year growth 2024-2029 (%)

12.3.5 Australia - Market size and forecast 2024-2029

Chart on Australia - Market size and forecast 2024-2029 ($ million)
Data Table on Australia - Market size and forecast 2024-2029 ($ million)
Chart on Australia - Year-over-year growth 2024-2029 (%)
Data Table on Australia - Year-over-year growth 2024-2029 (%)

12.3.6 Indonesia - Market size and forecast 2024-2029

Chart on Indonesia - Market size and forecast 2024-2029 ($ million)
Data Table on Indonesia - Market size and forecast 2024-2029 ($ million)
Chart on Indonesia - Year-over-year growth 2024-2029 (%)
Data Table on Indonesia - Year-over-year growth 2024-2029 (%)

12.4 Europe - Market size and forecast 2024-2029

Chart on Europe - Market size and forecast 2024-2029 ($ million)
Data Table on Europe - Market size and forecast 2024-2029 ($ million)
Chart on Europe - Year-over-year growth 2024-2029 (%)
Data Table on Europe - Year-over-year growth 2024-2029 (%)
Chart on Regional Comparison - Europe
Data Table on Regional Comparison - Europe

12.4.1 Germany - Market size and forecast 2024-2029

Chart on Germany - Market size and forecast 2024-2029 ($ million)
Data Table on Germany - Market size and forecast 2024-2029 ($ million)
Chart on Germany - Year-over-year growth 2024-2029 (%)
Data Table on Germany - Year-over-year growth 2024-2029 (%)

12.4.2 Italy - Market size and forecast 2024-2029

Chart on Italy - Market size and forecast 2024-2029 ($ million)
Data Table on Italy - Market size and forecast 2024-2029 ($ million)
Chart on Italy - Year-over-year growth 2024-2029 (%)
Data Table on Italy - Year-over-year growth 2024-2029 (%)

12.4.3 France - Market size and forecast 2024-2029

Chart on France - Market size and forecast 2024-2029 ($ million)
Data Table on France - Market size and forecast 2024-2029 ($ million)
Chart on France - Year-over-year growth 2024-2029 (%)
Data Table on France - Year-over-year growth 2024-2029 (%)

12.4.4 UK - Market size and forecast 2024-2029

Chart on UK - Market size and forecast 2024-2029 ($ million)
Data Table on UK - Market size and forecast 2024-2029 ($ million)
Chart on UK - Year-over-year growth 2024-2029 (%)
Data Table on UK - Year-over-year growth 2024-2029 (%)

12.4.5 Spain - Market size and forecast 2024-2029

Chart on Spain - Market size and forecast 2024-2029 ($ million)
Data Table on Spain - Market size and forecast 2024-2029 ($ million)
Chart on Spain - Year-over-year growth 2024-2029 (%)
Data Table on Spain - Year-over-year growth 2024-2029 (%)

12.4.6 The Netherlands - Market size and forecast 2024-2029

Chart on The Netherlands - Market size and forecast 2024-2029 ($ million)
Data Table on The Netherlands - Market size and forecast 2024-2029 ($ million)
Chart on The Netherlands - Year-over-year growth 2024-2029 (%)
Data Table on The Netherlands - Year-over-year growth 2024-2029 (%)

12.5 North America - Market size and forecast 2024-2029

Chart on North America - Market size and forecast 2024-2029 ($ million)
Data Table on North America - Market size and forecast 2024-2029 ($ million)
Chart on North America - Year-over-year growth 2024-2029 (%)
Data Table on North America - Year-over-year growth 2024-2029 (%)
Chart on Regional Comparison - North America
Data Table on Regional Comparison - North America

12.5.1 US - Market size and forecast 2024-2029

Chart on US - Market size and forecast 2024-2029 ($ million)
Data Table on US - Market size and forecast 2024-2029 ($ million)
Chart on US - Year-over-year growth 2024-2029 (%)
Data Table on US - Year-over-year growth 2024-2029 (%)

12.5.2 Canada - Market size and forecast 2024-2029

Chart on Canada - Market size and forecast 2024-2029 ($ million)
Data Table on Canada - Market size and forecast 2024-2029 ($ million)
Chart on Canada - Year-over-year growth 2024-2029 (%)
Data Table on Canada - Year-over-year growth 2024-2029 (%)

12.5.3 Mexico - Market size and forecast 2024-2029

Chart on Mexico - Market size and forecast 2024-2029 ($ million)
Data Table on Mexico - Market size and forecast 2024-2029 ($ million)
Chart on Mexico - Year-over-year growth 2024-2029 (%)
Data Table on Mexico - Year-over-year growth 2024-2029 (%)

12.6 Middle East and Africa - Market size and forecast 2024-2029

Chart on Middle East and Africa - Market size and forecast 2024-2029 ($ million)
Data Table on Middle East and Africa - Market size and forecast 2024-2029 ($ million)
Chart on Middle East and Africa - Year-over-year growth 2024-2029 (%)
Data Table on Middle East and Africa - Year-over-year growth 2024-2029 (%)
Chart on Regional Comparison - Middle East and Africa
Data Table on Regional Comparison - Middle East and Africa

12.6.1 Turkey - Market size and forecast 2024-2029

Chart on Turkey - Market size and forecast 2024-2029 ($ million)
Data Table on Turkey - Market size and forecast 2024-2029 ($ million)
Chart on Turkey - Year-over-year growth 2024-2029 (%)
Data Table on Turkey - Year-over-year growth 2024-2029 (%)

12.6.2 South Africa - Market size and forecast 2024-2029

Chart on South Africa - Market size and forecast 2024-2029 ($ million)
Data Table on South Africa - Market size and forecast 2024-2029 ($ million)
Chart on South Africa - Year-over-year growth 2024-2029 (%)
Data Table on South Africa - Year-over-year growth 2024-2029 (%)

12.6.3 UAE - Market size and forecast 2024-2029

Chart on UAE - Market size and forecast 2024-2029 ($ million)
Data Table on UAE - Market size and forecast 2024-2029 ($ million)
Chart on UAE - Year-over-year growth 2024-2029 (%)
Data Table on UAE - Year-over-year growth 2024-2029 (%)

12.6.4 Saudi Arabia - Market size and forecast 2024-2029

Chart on Saudi Arabia - Market size and forecast 2024-2029 ($ million)
Data Table on Saudi Arabia - Market size and forecast 2024-2029 ($ million)
Chart on Saudi Arabia - Year-over-year growth 2024-2029 (%)
Data Table on Saudi Arabia - Year-over-year growth 2024-2029 (%)

12.6.5 Israel - Market size and forecast 2024-2029

Chart on Israel - Market size and forecast 2024-2029 ($ million)
Data Table on Israel - Market size and forecast 2024-2029 ($ million)
Chart on Israel - Year-over-year growth 2024-2029 (%)
Data Table on Israel - Year-over-year growth 2024-2029 (%)

12.7 South America - Market size and forecast 2024-2029

Chart on South America - Market size and forecast 2024-2029 ($ million)
Data Table on South America - Market size and forecast 2024-2029 ($ million)
Chart on South America - Year-over-year growth 2024-2029 (%)
Data Table on South America - Year-over-year growth 2024-2029 (%)
Chart on Regional Comparison - South America
Data Table on Regional Comparison - South America

12.7.1 Brazil - Market size and forecast 2024-2029

Chart on Brazil - Market size and forecast 2024-2029 ($ million)
Data Table on Brazil - Market size and forecast 2024-2029 ($ million)
Chart on Brazil - Year-over-year growth 2024-2029 (%)
Data Table on Brazil - Year-over-year growth 2024-2029 (%)

12.7.2 Colombia - Market size and forecast 2024-2029

Chart on Colombia - Market size and forecast 2024-2029 ($ million)
Data Table on Colombia - Market size and forecast 2024-2029 ($ million)
Chart on Colombia - Year-over-year growth 2024-2029 (%)
Data Table on Colombia - Year-over-year growth 2024-2029 (%)

12.7.3 Argentina - Market size and forecast 2024-2029

Chart on Argentina - Market size and forecast 2024-2029 ($ million)
Data Table on Argentina - Market size and forecast 2024-2029 ($ million)
Chart on Argentina - Year-over-year growth 2024-2029 (%)
Data Table on Argentina - Year-over-year growth 2024-2029 (%)

12.8 Market opportunity by geography

Market opportunity by geography ($ million)
Data Tables on Market opportunity by geography ($ million)

13. Drivers, Challenges, and Opportunity

13.1 Market drivers

Technological advancements
Increasing demand for technical textiles
Focus on sustainable production

13.2 Market challenges

High capital investment
Skilled labor shortage
Intense competition from low-cost manufacturers

13.3 Impact of drivers and challenges

Impact of drivers and challenges in 2024 and 2029

13.4 Market opportunities

Automation and digitalization
Sustainability and circular economy
Rise of technical textiles and smart textiles

14. Competitive Landscape

14.1 Overview

14.2

Overview on criticality of inputs and factors of differentiation

14.3 Landscape disruption

Overview on factors of disruption

14.4 Industry risks

Impact of key risks on business

15. Competitive Analysis

15.1 Companies profiled

Companies covered

15.2 Company ranking index

15.3 Market positioning of companies

Matrix on companies position and classification

15.4 ATE Pvt. Ltd.

ATE Pvt. Ltd. - Overview
ATE Pvt. Ltd. - Product / Service
ATE Pvt. Ltd. - Key offerings
SWOT

15.5 Batliboi Ltd.

Batliboi Ltd. - Overview
Batliboi Ltd. - Product / Service
Batliboi Ltd. - Key offerings
SWOT

15.6 Camozzi Group SpA

Camozzi Group SpA - Overview
Camozzi Group SpA - Product / Service
Camozzi Group SpA - Key offerings
SWOT

15.7 karl mayer stoll textilmaschinenfabrik Gmbh

karl mayer stoll textilmaschinenfabrik Gmbh - Overview
karl mayer stoll textilmaschinenfabrik Gmbh - Product / Service
karl mayer stoll textilmaschinenfabrik Gmbh - Key offerings
SWOT

15.8 Lakshmi Machine Works Ltd.

Lakshmi Machine Works Ltd. - Overview
Lakshmi Machine Works Ltd. - Business segments
Lakshmi Machine Works Ltd. - Key offerings
Lakshmi Machine Works Ltd. - Segment focus
SWOT

15.9 Qingdao Jingtian Textile Machinery Co. Ltd.

Qingdao Jingtian Textile Machinery Co. Ltd. - Overview
Qingdao Jingtian Textile Machinery Co. Ltd. - Product / Service
Qingdao Jingtian Textile Machinery Co. Ltd. - Key offerings
SWOT

15.10 Radici Partecipazioni Spa

Radici Partecipazioni Spa - Overview
Radici Partecipazioni Spa - Product / Service
Radici Partecipazioni Spa - Key offerings
SWOT

15.11 Rieter Holding AG

Rieter Holding AG - Overview
Rieter Holding AG - Business segments
Rieter Holding AG - Key offerings
Rieter Holding AG - Segment focus
SWOT

15.12 Santex Rimar Group

Santex Rimar Group - Overview
Santex Rimar Group - Product / Service
Santex Rimar Group - Key offerings
SWOT

15.13 Saurer Intelligent Technology AG

Saurer Intelligent Technology AG - Overview
Saurer Intelligent Technology AG - Business segments
Saurer Intelligent Technology AG - Key offerings
Saurer Intelligent Technology AG - Segment focus
SWOT

15.14 SHIMA SEIKI MFG Ltd.

SHIMA SEIKI MFG Ltd. - Overview
SHIMA SEIKI MFG Ltd. - Product / Service
SHIMA SEIKI MFG Ltd. - Key offerings
SWOT

15.15 Toyota Industries Corp.

Toyota Industries Corp. - Overview
Toyota Industries Corp. - Business segments
Toyota Industries Corp. - Key news
Toyota Industries Corp. - Key offerings
Toyota Industries Corp. - Segment focus
SWOT

15.16 Trutzschler Group SE

Trutzschler Group SE - Overview
Trutzschler Group SE - Product / Service
Trutzschler Group SE - Key offerings
SWOT

15.17 TSUDAKOMA Corp.

TSUDAKOMA Corp. - Overview
TSUDAKOMA Corp. - Product / Service
TSUDAKOMA Corp. - Key offerings
SWOT

15.18 VANDEWIELE NV

VANDEWIELE NV - Overview
VANDEWIELE NV - Product / Service
VANDEWIELE NV - Key offerings
SWOT

16. Appendix

16.1 Scope of the report

Market definition
Objectives
Notes and caveats

16.2 Inclusions and exclusions checklist

Inclusions checklist
Exclusions checklist

16.3 Currency conversion rates for US$

16.4 Research methodology

16.5 Data procurement

Information sources

16.6 Data validation

16.7 Validation techniques employed for market sizing

16.8 Data synthesis

16.9 360 degree market analysis

16.10 List of abbreviations

Research Methodology

Technavio presents a detailed picture of the market by way of study, synthesis, and summation of data from multiple sources. The analysts have presented the various facets of the market with a particular focus on identifying the key industry influencers. The data thus presented is comprehensive, reliable, and the result of extensive research, both primary and secondary.

INFORMATION SOURCES

Primary sources

  • Manufacturers and suppliers
  • Channel partners
  • Industry experts
  • Strategic decision makers

Secondary sources

  • Industry journals and periodicals
  • Government data
  • Financial reports of key industry players
  • Historical data
  • Press releases

DATA ANALYSIS

Data Synthesis

  • Collation of data
  • Estimation of key figures
  • Analysis of derived insights

Data Validation

  • Triangulation with data models
  • Reference against proprietary databases
  • Corroboration with industry experts

REPORT WRITING

Qualitative

  • Market drivers
  • Market challenges
  • Market trends
  • Five forces analysis

Quantitative

  • Market size and forecast
  • Market segmentation
  • Geographical insights
  • Competitive landscape

Interested in this report?

Get your sample now to see our research methodology and insights!

Download Now

Frequently Asked Questions

Textile Machinery market growth will increase by USD 12143.0 million during 2025-2029 .

The Textile Machinery market is expected to grow at a CAGR of 7.1% during 2025-2029 .

Textile Machinery market is segmented by Product (Spinning machinery, Knitting machinery, Weaving machinery, Texturing machinery, Others) End-user (Garment and apparel factory, Cotton and wool mills, Home textile, Technical textile) Type (Fully automatic, Semi-automatic, Manual)

ATE Pvt. Ltd., Batliboi Ltd., Camozzi Group SpA, karl mayer stoll textilmaschinenfabrik Gmbh, Lakshmi Machine Works Ltd., Qingdao Jingtian Textile Machinery Co. Ltd., Qingdao Lebon Industry Co. Ltd., Radici Partecipazioni Spa, Rieter Holding AG, Santex Rimar Group, Saurer Intelligent Technology AG, SHIMA SEIKI MFG Ltd., Toyota Industries Corp., Trutzschler Group SE, TSUDAKOMA Corp., VANDEWIELE NV, Yamuna Machine Works Ltd. are a few of the key vendors in the Textile Machinery market.

APAC will register the highest growth rate of 64.9% among the other regions. Therefore, the Textile Machinery market in APAC is expected to garner significant business opportunities for the vendors during the forecast period.

China, India, Japan, South Korea, Australia, Indonesia, Germany, Italy, France, UK, Spain, The Netherlands, US, Canada, Mexico, Turkey, South Africa, UAE, Saudi Arabia, Israel, Brazil, Colombia, Argentina

  • Technological advancements is the driving factor this market.

The Textile Machinery market vendors should focus on grabbing business opportunities from the Product segment as it accounted for the largest market share in the base year.