Manufacturing Execution Systems Market Size 2026-2030
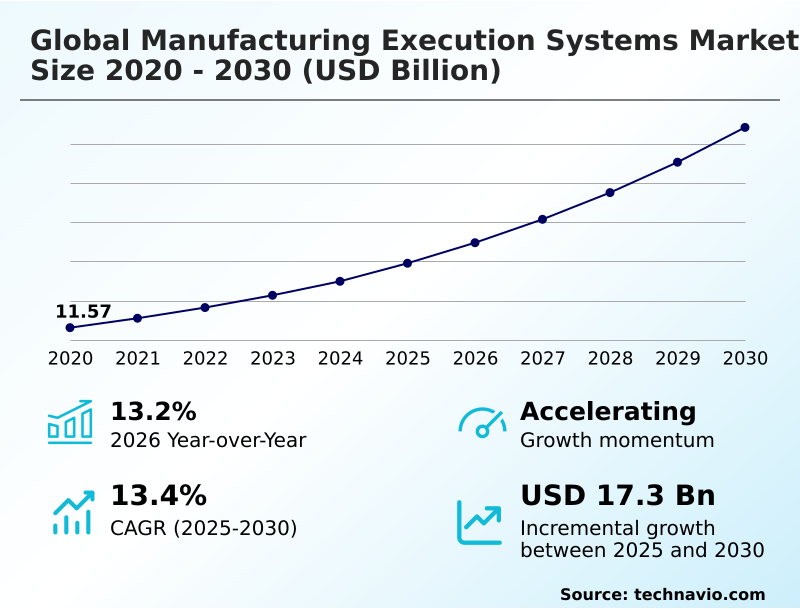
The manufacturing execution systems market size is valued to increase by USD 17.30 billion, at a CAGR of 13.4% from 2025 to 2030. Enduring pursuit of operational excellence and cost optimization will drive the manufacturing execution systems market.
Major Market Trends & Insights
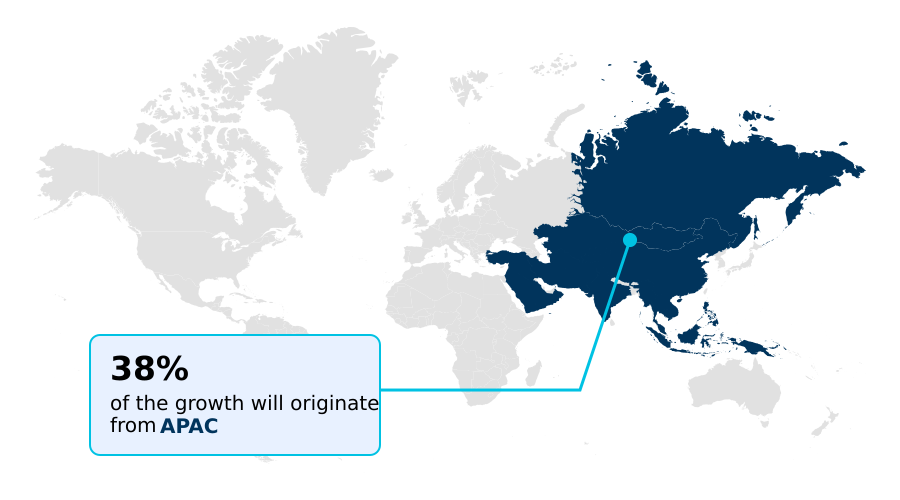
- APAC dominated the market and accounted for a 38.5% growth during the forecast period.
- By End-user - Discrete industries segment was valued at USD 10.01 billion in 2024
- By Deployment - Hybrid segment accounted for the largest market revenue share in 2024
Market Size & Forecast
- Market Opportunities: USD 25.49 billion
- Market Future Opportunities: USD 17.30 billion
- CAGR from 2025 to 2030 : 13.4%
Market Summary
- The manufacturing execution systems market functions as the critical link between enterprise-level planning and plant-floor process control. Its growth is propelled by the relentless need for operational excellence, as organizations leverage these platforms to achieve real-time visibility and data-driven decision-making.
- A key trend is the convergence of IT and OT, enabling smart factory initiatives where MES orchestrates industrial internet of things (IIoT) devices and powers predictive maintenance algorithms.
- For instance, a pharmaceutical firm can use an MES to manage electronic batch records and ensure complete product genealogy, which is vital for meeting strict regulatory compliance standards and can prevent costly product recalls. This digital transformation in manufacturing enhances efficiency by enabling supply chain optimization and improving overall equipment effectiveness (OEE).
- However, implementation challenges, such as the complexity of integrating with legacy systems and the high initial investment, can temper adoption rates, particularly for smaller enterprises. The move toward cloud-based mes for smes is helping to mitigate these barriers.
What will be the Size of the Manufacturing Execution Systems Market during the forecast period?
Get Key Insights on Market Forecast (PDF) Get Free Sample
How is the Manufacturing Execution Systems Market Segmented?
The manufacturing execution systems industry research report provides comprehensive data (region-wise segment analysis), with forecasts and estimates in "USD million" for the period 2026-2030, as well as historical data from 2020-2024 for the following segments.
- End-user
- Discrete industries
- Process industries
- Deployment
- Hybrid
- On-premises
- Cloud-based
- Component
- Software
- Services
- Geography
- APAC
- China
- Japan
- India
- North America
- US
- Canada
- Mexico
- Europe
- Germany
- France
- UK
- Middle East and Africa
- UAE
- Saudi Arabia
- South Africa
- South America
- Brazil
- Argentina
- Colombia
- Rest of World (ROW)
- APAC
By End-user Insights
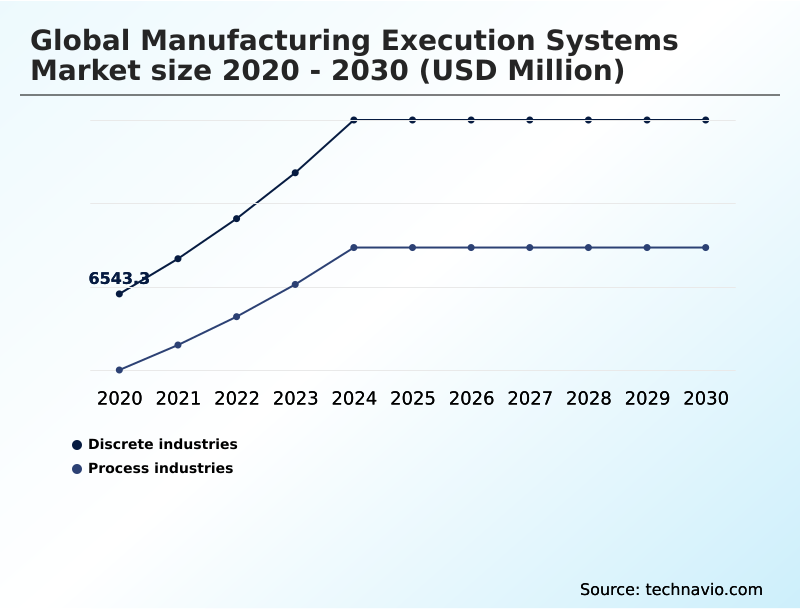
The discrete industries segment is estimated to witness significant growth during the forecast period.
The discrete industries segment is a cornerstone of the manufacturing execution systems market, driven by the complex assembly operations and stringent quality demands of sectors like automotive and aerospace.
These environments necessitate robust solutions for orchestrating intricate production processes and maintaining comprehensive product genealogy.
The adoption of MES provides real-time visibility into shop floor operations, enabling the management of digital work instructions and the continuous monitoring of key performance indicators like overall equipment effectiveness (OEE).
This drives significant improvements in process control, with some firms reporting a reduction in production defects by up to 15%.
For industries where safety and reliability are paramount, functionalities such as end-to-end traceability and quality assurance management are essential for regulatory compliance and risk mitigation, solidifying MES as a critical technology for operational excellence and supply chain optimization.
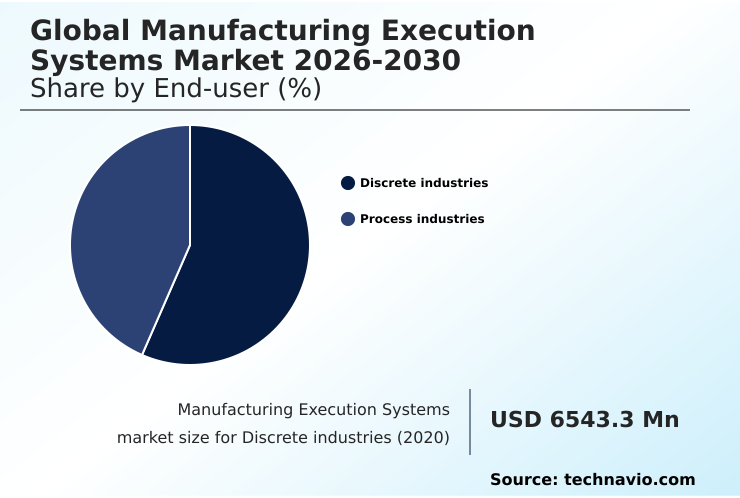
The Discrete industries segment was valued at USD 10.01 billion in 2024 and showed a gradual increase during the forecast period.
Regional Analysis
APAC is estimated to contribute 38.5% to the growth of the global market during the forecast period.Technavio’s analysts have elaborately explained the regional trends and drivers that shape the market during the forecast period.
See How Manufacturing Execution Systems Market Demand is Rising in APAC Get Free Sample
The geographic landscape of the manufacturing execution systems market is characterized by varied regional dynamics.
APAC is experiencing the fastest expansion, with growth rates approximately 12% higher than in South America, fueled by widespread industrialization and strong government-led smart factory initiatives.
In North America and Europe, the focus is on upgrading existing facilities with advanced technologies to boost productivity and meet stringent regulatory demands.
Implementations in North America have demonstrated significant performance gains, including up to a 20% reduction in production cycle times. This digital transformation is enabling manufacturers globally to enhance quality assurance management and achieve new levels of operational efficiency.
The adoption of manufacturing execution systems is pivotal for maintaining competitiveness across all regions, from managing complex assembly operations in mature markets to enabling rapid industrial growth in emerging economies.
Market Dynamics
Our researchers analyzed the data with 2025 as the base year, along with the key drivers, trends, and challenges. A holistic analysis of drivers will help companies refine their marketing strategies to gain a competitive advantage.
- Defining a successful digital transformation strategy begins with understanding key manufacturing execution system market trends and adhering to clear MES software selection criteria. A critical factor is the total cost of ownership MES, which extends beyond initial licensing to include long-term support and upgrade paths.
- For many, the decision between on-premise vs cloud MES for manufacturing is pivotal, with cloud based MES for smes offering a lower barrier to entry. Effective MES implementation best practices are crucial for success, demanding a focus on MES integration with ERP systems to ensure seamless data flow from the shop floor to the enterprise level.
- Different industries have unique needs; MES for discrete manufacturing traceability focuses on parts and assembly history, while MES for batch process manufacturing centers on recipe and formula management. A key goal for any project is OEE improvement with MES software, which provides real-time performance data. Furthermore, leveraging this data for predictive maintenance with MES data helps minimize unplanned downtime.
- The benefits of MES in regulated industries are particularly pronounced; firms utilizing pharmaceutical MES compliance 21 CFR Part 11 solutions report a 40% greater success rate in audits compared to those with manual systems.
- Ultimately, comparing MES vendors requires looking at their ability to support specific use cases, such as achieving MES for lean manufacturing or enabling comprehensive MES analytics for continuous improvement.
What are the key market drivers leading to the rise in the adoption of Manufacturing Execution Systems Industry?
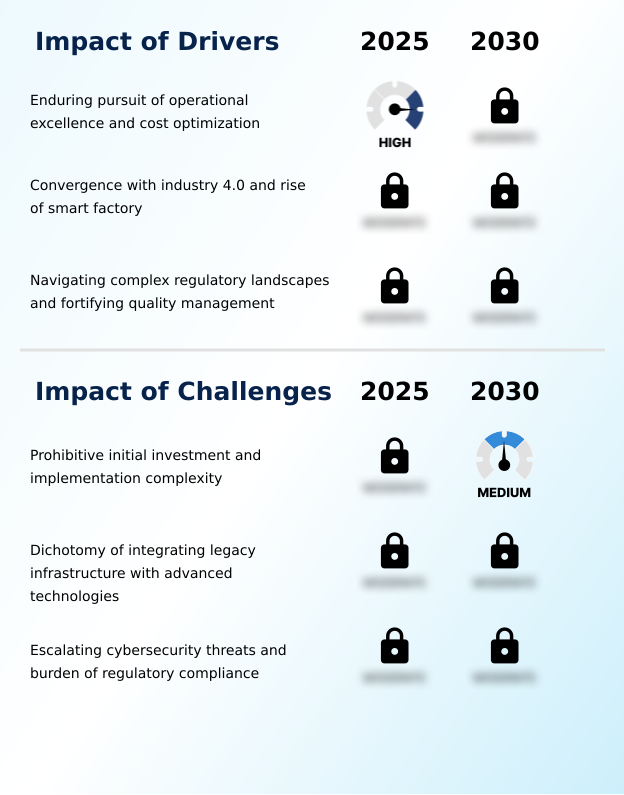
- The enduring pursuit of operational excellence and cost optimization by global manufacturing enterprises serves as a fundamental driver for market expansion.
- The primary driver for the manufacturing execution systems market is the universal pursuit of operational excellence.
- Manufacturers are implementing these platforms to gain real-time process control and visibility, leading to an average OEE improvement of 15% within the first two years.
- The push toward Industry 4.0 and digital transformation in manufacturing is another major catalyst, with MES serving as the backbone for integrating technologies like the industrial internet of things (IIoT) and digital twin technology.
- Furthermore, the escalating complexity of regulatory compliance, particularly in life sciences, makes functionalities such as electronic batch records and end-to-end traceability indispensable.
- Adherence to these systems has been shown to reduce compliance-related penalties by over 90% for some firms, solidifying the tangible return on investment.
What are the market trends shaping the Manufacturing Execution Systems Industry?
- A paramount trend is the deepening convergence of Information Technology (IT) and Operational Technology (OT) within the Industry 4.0 framework. This integration positions the Manufacturing Execution System as the critical orchestrating layer.
- Key trends are reshaping the manufacturing execution systems market, driven by the need for greater agility and data-driven decision-making. The deepening convergence of IT/OT is central, positioning MES as the bridge between enterprise planning and shop floor operations. This integration is enabling firms to reduce unplanned downtime by up to 30% through the use of predictive maintenance algorithms.
- Another transformative trend is the shift toward cloud-based and composable MES architectures, which dramatically shortens implementation timelines by over 40% compared to traditional monolithic systems. These models democratize access to advanced functionalities like statistical process control and digital work instructions, allowing manufacturers to adopt capabilities incrementally.
- This evolution supports smart factory initiatives and fosters a more resilient and adaptive production environment.
What challenges does the Manufacturing Execution Systems Industry face during its growth?
- A primary challenge constraining market growth is the prohibitive initial investment and significant complexity associated with system implementation.
- Key challenges temper the growth of the manufacturing execution systems market, primarily the high initial investment and implementation complexity. Projects frequently exceed budgets by 25% or more due to unforeseen costs related to system integration and data migration.
- Integrating modern MES platforms with legacy plant floor systems and proprietary machine protocols presents a significant technical hurdle, often requiring specialized and costly development work. Moreover, the increasing connectivity of shop floor operations creates a larger attack surface for cybersecurity threats, with attacks targeting OT systems rising by over 50% in the last year.
- This combination of financial barriers, technical difficulties in achieving MES integration with erp systems, and security risks constrains wider adoption, particularly among small and medium-sized enterprises.
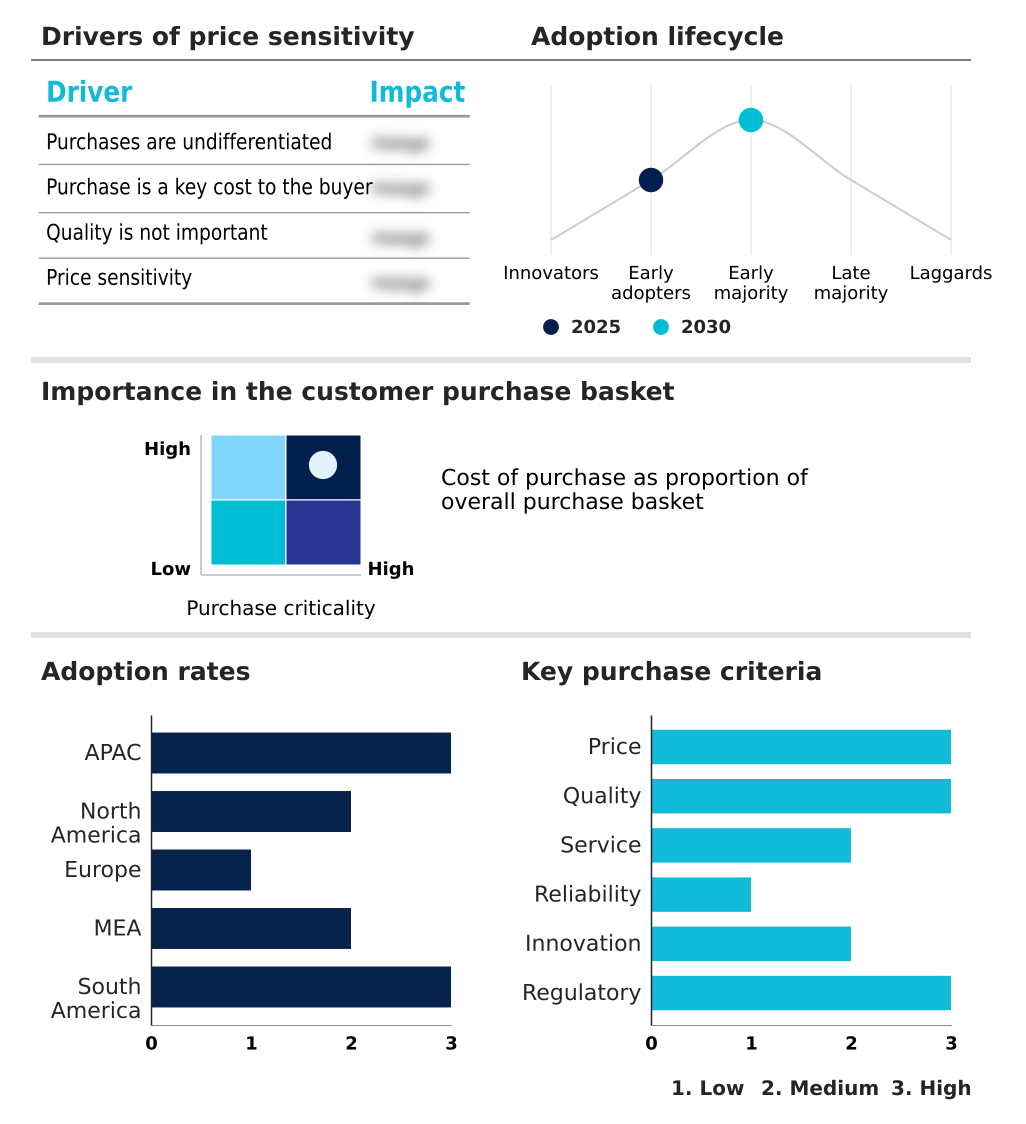
Exclusive Technavio Analysis on Customer Landscape
The manufacturing execution systems market forecasting report includes the adoption lifecycle of the market, covering from the innovator’s stage to the laggard’s stage. It focuses on adoption rates in different regions based on penetration. Furthermore, the manufacturing execution systems market report also includes key purchase criteria and drivers of price sensitivity to help companies evaluate and develop their market growth analysis strategies.
Customer Landscape of Manufacturing Execution Systems Industry
Competitive Landscape
Companies are implementing various strategies, such as strategic alliances, manufacturing execution systems market forecast, partnerships, mergers and acquisitions, geographical expansion, and product/service launches, to enhance their presence in the industry.
ABB Ltd. - Analysis indicates a focus on providing modular manufacturing execution systems that enhance end-to-end visibility and control for high-tech manufacturing processes, driving operational excellence.
The industry research and growth report includes detailed analyses of the competitive landscape of the market and information about key companies, including:
- ABB Ltd.
- Advantive LLC
- Aspen Technology Inc.
- AVEVA Group Ltd.
- Carl Zeiss AG
- Critical Manufacturing SA
- Dassault Systemes SE
- Emerson Electric Co.
- Epicor Software Corp.
- Fujitsu Ltd.
- GE Vernova Inc.
- Honeywell International Inc.
- Infor Inc.
- Infosys Ltd.
- Koerber AG
- Oracle Corp.
- Rockwell Automation Inc.
- Sanmina Corp.
- SAP SE
- Schneider Electric SE
- Siemens AG
- Yokogawa Electric Corp.
Qualitative and quantitative analysis of companies has been conducted to help clients understand the wider business environment as well as the strengths and weaknesses of key industry players. Data is qualitatively analyzed to categorize companies as pure play, category-focused, industry-focused, and diversified; it is quantitatively analyzed to categorize companies as dominant, leading, strong, tentative, and weak.
Recent Development and News in Manufacturing execution systems market
- In October 2024, Yokogawa Electric Corp. announced the global release of its OpreX Batch MES, a specialized software package designed to optimize production processes for batch plants within the specialty and fine chemicals industries.
- In January 2025, Honeywell International Inc. acquired a cloud-native MES startup, a strategic move to enhance the AI-driven predictive analytics capabilities integrated within its Honeywell Forge enterprise performance management platform.
- In March 2025, Siemens AG and Audi revealed a strategic partnership to implement a virtual shop floor automation solution at Audi's Neckarsulm facility, utilizing the Siemens Xcelerator platform to create a comprehensive digital twin of the production environment.
- In May 2025, Rockwell Automation Inc. launched FactoryTalk PharmaSuite 12.00, a new iteration of its MES platform specifically engineered to meet the stringent regulatory and operational requirements of pharmaceutical and biopharmaceutical manufacturing.
Dive into Technavio’s robust research methodology, blending expert interviews, extensive data synthesis, and validated models for unparalleled Manufacturing Execution Systems Market insights. See full methodology.
| Market Scope | |
|---|---|
| Page number | 333 |
| Base year | 2025 |
| Historic period | 2020-2024 |
| Forecast period | 2026-2030 |
| Growth momentum & CAGR | Accelerate at a CAGR of 13.4% |
| Market growth 2026-2030 | USD 17295.1 million |
| Market structure | Fragmented |
| YoY growth 2025-2026(%) | 13.2% |
| Key countries | China, Japan, India, South Korea, Australia, Taiwan, US, Canada, Mexico, Germany, France, UK, Italy, Spain, The Netherlands, UAE, Saudi Arabia, South Africa, Egypt, Turkey, Brazil, Argentina and Colombia |
| Competitive landscape | Leading Companies, Market Positioning of Companies, Competitive Strategies, and Industry Risks |
Research Analyst Overview
- The strategic importance of a manufacturing execution system is escalating as it becomes the central nervous system for digital manufacturing. These platforms facilitate the critical convergence of IT/OT, a trend compelling boardroom-level reviews of cybersecurity investments and infrastructure upgrades to protect newly connected shop floor operations.
- The core value lies in creating a cohesive ecosystem for real-time process control, enabling capabilities like electronic batch records and complete product genealogy, which are non-negotiable for regulatory compliance. Adopters of these systems for quality assurance management and statistical process control have documented a reduction in material waste by over 18%.
- By leveraging a manufacturing execution system for paperless manufacturing and to monitor overall equipment effectiveness (OEE), organizations are unlocking new efficiencies. The integration with digital work instructions and sophisticated predictive maintenance algorithms transforms raw data from plant floor systems into actionable intelligence, optimizing everything from work-in-progress tracking to resource scheduling and managing complex assembly operations.
- This shift is fundamental to enabling end-to-end traceability and operational excellence.
What are the Key Data Covered in this Manufacturing Execution Systems Market Research and Growth Report?
-
What is the expected growth of the Manufacturing Execution Systems Market between 2026 and 2030?
-
USD 17.30 billion, at a CAGR of 13.4%
-
-
What segmentation does the market report cover?
-
The report is segmented by End-user (Discrete industries, and Process industries), Deployment (Hybrid, On-premises, and Cloud-based), Component (Software, and Services) and Geography (APAC, North America, Europe, Middle East and Africa, South America)
-
-
Which regions are analyzed in the report?
-
APAC, North America, Europe, Middle East and Africa and South America
-
-
What are the key growth drivers and market challenges?
-
Enduring pursuit of operational excellence and cost optimization, Prohibitive initial investment and implementation complexity
-
-
Who are the major players in the Manufacturing Execution Systems Market?
-
ABB Ltd., Advantive LLC, Aspen Technology Inc., AVEVA Group Ltd., Carl Zeiss AG, Critical Manufacturing SA, Dassault Systemes SE, Emerson Electric Co., Epicor Software Corp., Fujitsu Ltd., GE Vernova Inc., Honeywell International Inc., Infor Inc., Infosys Ltd., Koerber AG, Oracle Corp., Rockwell Automation Inc., Sanmina Corp., SAP SE, Schneider Electric SE, Siemens AG and Yokogawa Electric Corp.
-
Market Research Insights
- The market's dynamics are shaped by a strategic push toward digital transformation in manufacturing, where MES platforms are central to achieving operational intelligence. Implementations are delivering tangible results, with some firms achieving a 15% improvement in overall equipment effectiveness (OEE) and others reducing compliance reporting times by up to 50% through the adoption of paperless manufacturing.
- The move toward a composable MES architecture enables greater agility, while the integration of AI and machine learning enhances predictive maintenance capabilities. As manufacturers pursue lean manufacturing principles and enhanced supply chain optimization, MES provides the necessary framework for data-driven decision-making, solidifying its role as a critical technology for modern industrial operations.
We can help! Our analysts can customize this manufacturing execution systems market research report to meet your requirements.
 RIA -
RIA - 
