Thin Film Transistor (TFT) Liquid Crystal Display (LCD) Market Analysis, Size, and Forecast 2026-2030: North America (US, Canada, and Mexico), APAC (China, Japan, and India), Europe (Germany, UK, and France), South America (Brazil and Argentina), Middle East and Africa (Saudi Arabia, UAE, and South Africa), and Rest of World (ROW)

Thin Film Transistor (TFT) Liquid Crystal Display (LCD) Market Analysis, Size, and Forecast 2026-2030:
North America (US, Canada, and Mexico), APAC (China, Japan, and India), Europe (Germany, UK, and France), South America (Brazil and Argentina), Middle East and Africa (Saudi Arabia, UAE, and South Africa), and Rest of World (ROW)

Published: Mar 2026 314 Pages SKU: IRTNTR75581

Market Overview at a Glance

$50.56 Mn
Market Opportunity
5.4%
CAGR 2025 - 2030
32.8%
APAC Growth
$94.75 Mn
Television segment 2024

Thin Film Transistor (TFT) Liquid Crystal Display (LCD) Market Size 2026-2030

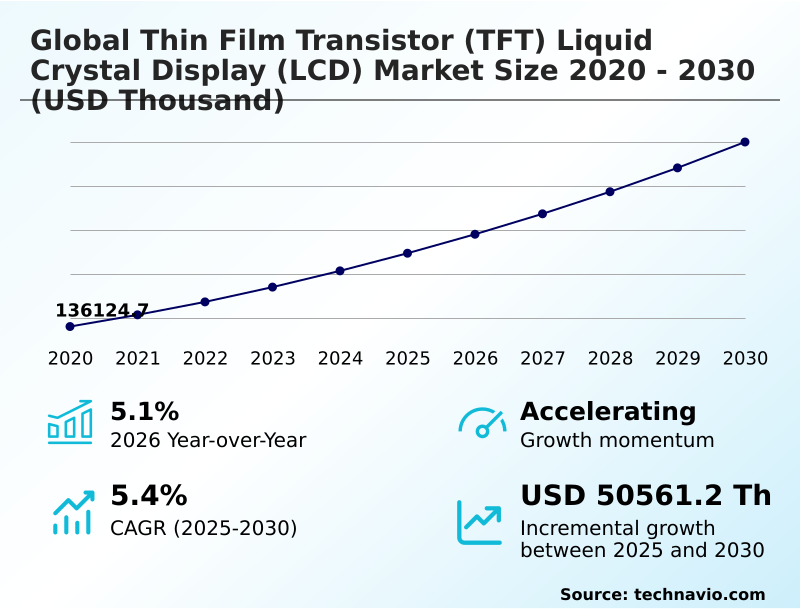
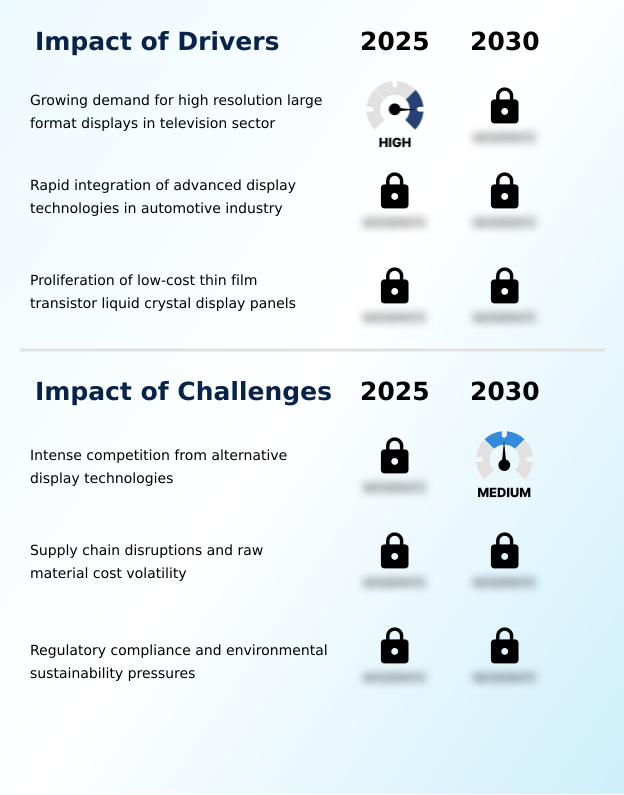
The thin film transistor (tft) liquid crystal display (lcd) market size is valued to increase by USD 50.56 million, at a CAGR of 5.4% from 2025 to 2030. Growing demand for high resolution large format displays in television sector will drive the thin film transistor (tft) liquid crystal display (lcd) market.

Major Market Trends & Insights

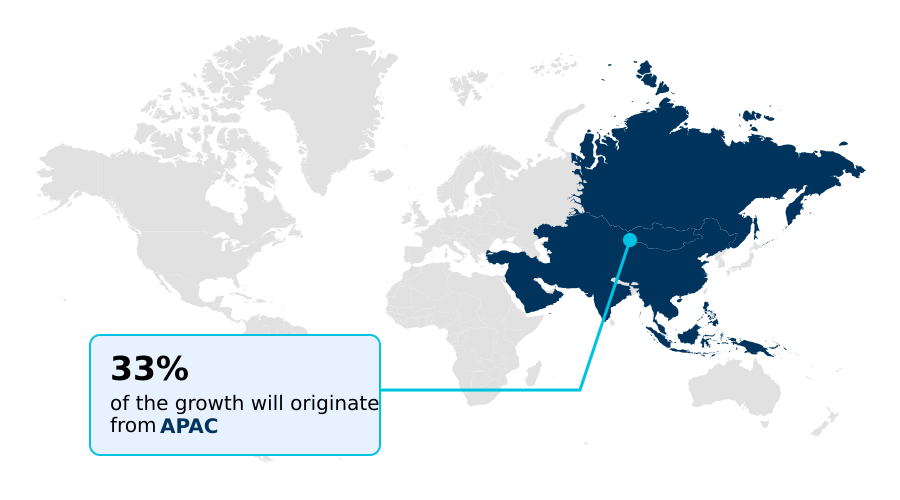
  • APAC dominated the market and accounted for a 32.8% growth during the forecast period.
  • By Application - Television segment was valued at USD 94.75 million in 2024
  • By Type - Large displays segment accounted for the largest market revenue share in 2024

Market Size & Forecast

  • Market Opportunities:
  • Market Future Opportunities: USD 50.56 million
  • CAGR from 2025 to 2030 : 5.4%

Market Summary

  • The Thin Film Transistor (TFT) Liquid Crystal Display (LCD) Market is sustained by its foundational role in consumer electronics, automotive systems, and industrial controls. Its mature manufacturing ecosystem allows for cost-effective production of reliable panels, a key driver for its continued prevalence.
  • A primary trend is the diversification into specialized applications, such as automotive grade displays and industrial strength LCDs, which demand high durability and performance under varied conditions. This necessitates advancements in core components like the transistor backplane and backlight unit to improve energy efficiency and thermal stability.
  • However, the industry faces significant challenges from the rise of self-emissive display technologies, which offer superior contrast and form factors. In response, manufacturers are enhancing TFT LCDs with features like mini-LED backlights and higher refresh rates.
  • A key business scenario involves optimizing the supply chain for critical materials such as glass substrates and polarizers; a disruption in a single component supplier can halt production lines, impacting delivery schedules for major electronics brands and highlighting the need for supply chain resilience. This dynamic environment compels continuous innovation in both product performance and manufacturing processes to maintain competitiveness.

What will be the Size of the Thin Film Transistor (TFT) Liquid Crystal Display (LCD) Market during the forecast period?

Get Key Insights on Market Forecast (PDF) Request Free Sample

How is the Thin Film Transistor (TFT) Liquid Crystal Display (LCD) Market Segmented?

The thin film transistor (tft) liquid crystal display (lcd) industry research report provides comprehensive data (region-wise segment analysis), with forecasts and estimates in "USD thousand" for the period 2026-2030, as well as historical data from 2020-2024 for the following segments.
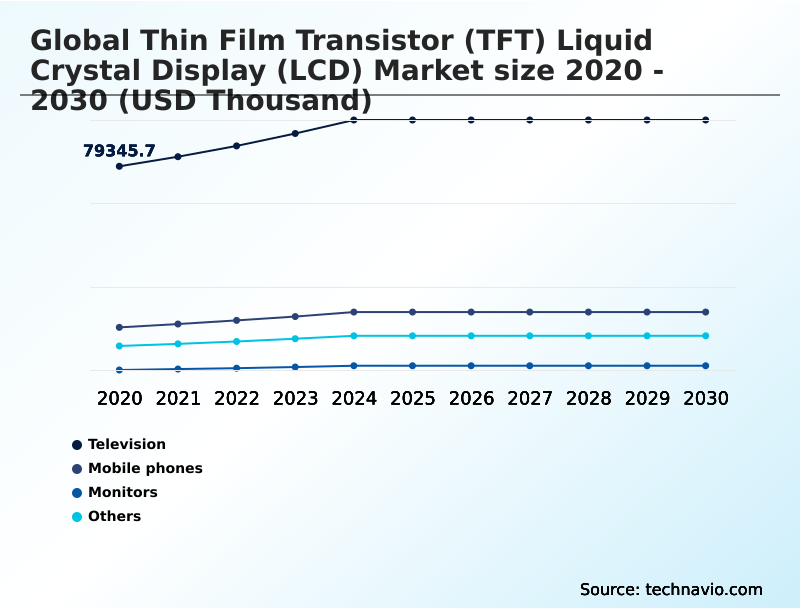
  • Application
    • Television
    • Mobile phones
    • Monitors
    • Others
  • Type
    • Large displays
    • Small and medium displays
  • End-user
    • Consumer electronics
    • Automotive
    • Retail and hospitality
    • Industrial
    • Others
  • Geography
    • North America
      • US
      • Canada
      • Mexico
    • APAC
      • China
      • Japan
      • India
    • Europe
      • Germany
      • UK
      • France
    • South America
      • Brazil
      • Argentina
    • Middle East and Africa
      • Saudi Arabia
      • UAE
      • South Africa
    • Rest of World (ROW)

By Application Insights

The television segment is estimated to witness significant growth during the forecast period.

The television segment is a cornerstone of the market, driven by consumer demand for high resolution imaging. This trend fuels advancements in large format screens with high refresh rates and faster response times.

The industry is optimizing the deposition process and investing in advanced backlighting technologies, including mini-LED backlights, to improve the contrast ratio. Manufacturers are focusing on the transistor backplane to support higher pixel density.

The implementation of automated inspection systems has improved production yield by over 10%, ensuring a stable supply of panels with consistent color accuracy.

This focus on operational efficiency helps manage costs while developing premium screens with superior viewing angles and a wider color gamut, alongside advancements in medical imaging displays.

Request Free Sample

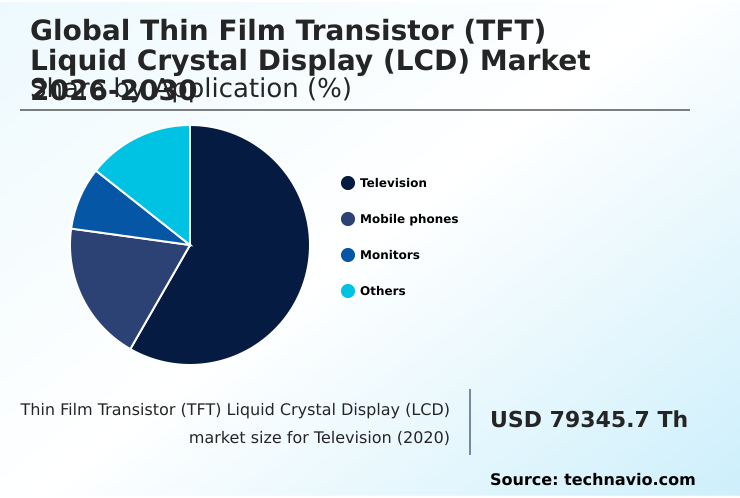
The Television segment was valued at USD 94.75 million in 2024 and showed a gradual increase during the forecast period.

Request Free Sample

Regional Analysis

APAC is estimated to contribute 32.8% to the growth of the global market during the forecast period.Technavio’s analysts have elaborately explained the regional trends and drivers that shape the market during the forecast period.

See How Thin Film Transistor (TFT) Liquid Crystal Display (LCD) Market Demand is Rising in APAC Request Free Sample

The geographic landscape is dominated by manufacturing hubs in APAC, which accounts for over 32% of the incremental growth opportunities, driven by economies of scale in producing everything from high brightness panels to flexible LCD displays.

This region's focus on smart manufacturing has led to significant operational gains, with some facilities reporting a 12% improvement in yield management systems through the use of machine learning quality control.

North America and Europe remain key consumption markets, demanding high-performance automotive grade displays and specialized medical imaging displays. The emphasis in these regions is on adherence to stringent environmental compliance and energy efficiency mandates.

This global dynamic creates a market where Asian production efficiency, centered on technologies like LTPS TFT panels and photolithography, serves the high-value, application-specific demands of Western economies.

Market Dynamics

Our researchers analyzed the data with 2025 as the base year, along with the key drivers, trends, and challenges. A holistic analysis of drivers will help companies refine their marketing strategies to gain a competitive advantage.

  • Strategic decision-making in the market is increasingly granular, focusing on specific applications and competitive positioning. For instance, the market for high refresh rate gaming monitors is pushing technical boundaries, while the demand for durable displays for industrial automation and industrial hmi with tft display technology prioritizes reliability over peak performance.
  • Similarly, the requirements for tft lcd for automotive dashboards and advanced driver assistance system displays differ significantly from those for tft lcd in consumer electronics. The debate over tft vs oled for smartphones continues in mid-range segments, where cost effective tft panel production remains a key advantage.
  • Companies are engineering specialized solutions like sunlight readable marine displays and medical grade diagnostic displays. The development of energy efficient backlight units and low power tft for wearables addresses battery life concerns. Meanwhile, the growth in large format digital signage solutions and high resolution professional monitors creates distinct supply chain demands.
  • The market for curved tft displays for cockpits and the versatile tft panel for portable devices shows further diversification. Operational planning must account for regional growth disparities; with some markets growing more than 1.5 times faster than others, this directly impacts logistics and inventory management, especially given the impact of raw material costs and potential tft display supply chain disruptions.
  • Furthermore, navigating regulatory compliance for display manufacturing and establishing processes for recycling tft lcd panel components are becoming critical to long-term viability.

What are the key market drivers leading to the rise in the adoption of Thin Film Transistor (TFT) Liquid Crystal Display (LCD) Industry?

  • The growing demand for high-resolution, large-format displays within the television sector is a key driver of market growth.

  • Market growth is primarily driven by expanding applications in the automotive and consumer electronics sectors. The increasing digitization of vehicle cockpits is fueling demand for automotive infotainment displays, with some luxury models now featuring screens as large as 31 inches.
  • This trend requires high-performance panels with excellent thermal stability and color accuracy, often in sunlight readable display formats. In consumer electronics, the proliferation of affordable smartphones with features like blue light filtering remains a significant driver.
  • The cost-effectiveness of thin film transistor technology allows manufacturers to deliver high resolution imaging at competitive price points. Demand for large-format televisions with high pixel density and superior viewing angles also continues to drive volume, supported by manufacturing advancements.

What are the market trends shaping the Thin Film Transistor (TFT) Liquid Crystal Display (LCD) Industry?

  • The integration of high refresh rate and ultra-high-definition technologies represents an important market trend. This evolution is driven by increasing demand for superior visual performance across consumer and professional applications.

  • Key market trends are centered on enhancing production efficiency and panel performance through smart manufacturing. The adoption of AI-driven automated inspection systems has significantly reduced pixel defects, while the implementation of advanced process control algorithms has improved production yields by up to 12%. This push for automation extends to robotic systems handling large glass substrates, optimizing the clean room environment.
  • On the product side, diversification into specialized applications like automotive grade displays and industrial strength LCDs is a primary focus.
  • These trends are supported by technological advancements in core components, such as the use of oxide transistors and LTPS TFT panels to achieve higher refresh rates and better energy efficiency, making them competitive for high-performance applications that demand high dynamic range.

What challenges does the Thin Film Transistor (TFT) Liquid Crystal Display (LCD) Industry face during its growth?

  • Intense competition from alternative display technologies presents a key challenge affecting the industry's growth trajectory.

  • The market faces significant headwinds from supply chain volatility and intense competition from electrophoretic display options. Price adjustments for essential raw materials, such as display glass substrates, are putting direct pressure on manufacturer margins. Geopolitical instability has also led to shipping delays for critical components like polarizers and driver integrated circuits, disrupting production schedules.
  • Furthermore, the industry is grappling with stringent environmental compliance, with new wastewater and air emission standards leading to increased operational costs. For instance, some companies have reported significant increases in environmental compliance expenditures.
  • These factors, combined with the technical difficulty of electronic waste recycling and the rise of alternative dual stack panels, create a challenging environment requiring robust supply chain resilience and strategic innovation.

Exclusive Technavio Analysis on Customer Landscape

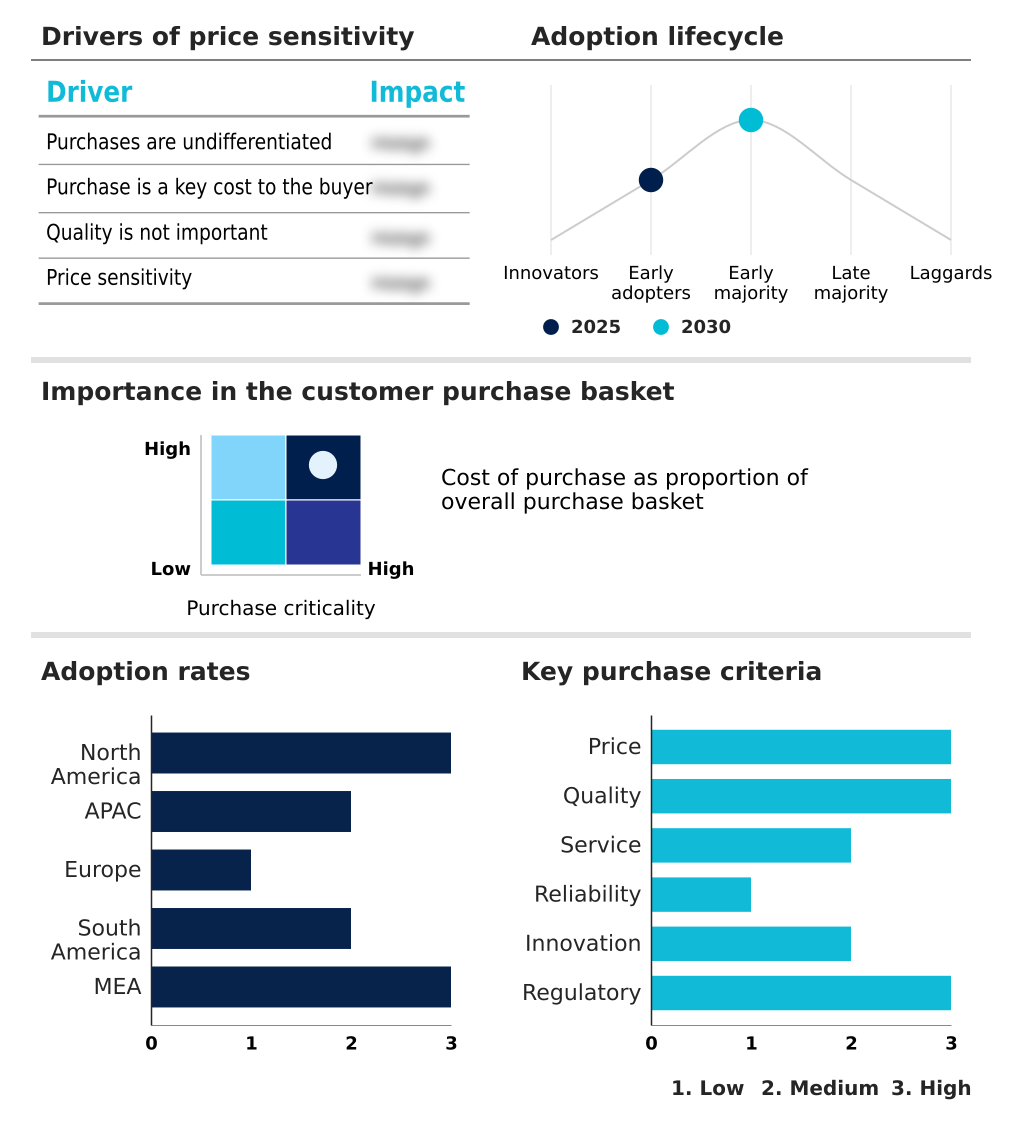
The thin film transistor (tft) liquid crystal display (lcd) market forecasting report includes the adoption lifecycle of the market, covering from the innovator’s stage to the laggard’s stage. It focuses on adoption rates in different regions based on penetration. Furthermore, the thin film transistor (tft) liquid crystal display (lcd) market report also includes key purchase criteria and drivers of price sensitivity to help companies evaluate and develop their market growth analysis strategies.

Customer Landscape of Thin Film Transistor (TFT) Liquid Crystal Display (LCD) Industry

Competitive Landscape

Companies are implementing various strategies, such as strategic alliances, thin film transistor (tft) liquid crystal display (lcd) market forecast, partnerships, mergers and acquisitions, geographical expansion, and product/service launches, to enhance their presence in the industry.

AUO Corp. - Specialized thin film transistor (TFT) liquid crystal display (LCD) modules are offered, focusing on robust panels engineered for demanding automotive and industrial applications.

The industry research and growth report includes detailed analyses of the competitive landscape of the market and information about key companies, including:

  • AUO Corp.
  • BOE Technology Group Co. Ltd.
  • E Ink Holdings Inc.
  • Fujitsu Ltd.
  • Hannstar Display Corp.
  • Hitachi Ltd.
  • Japan Display Inc.
  • LG Electronics Inc.
  • Panasonic Holdings Corp.
  • Samsung Electronics Co. Ltd.
  • Sharp Corp.
  • Shenzhen Wan Display Co. Ltd.
  • Sony Group Corp.
  • TCL Industries Holdings Ltd.
  • Tianma Microelectronics Co.
  • Toshiba Corp.
  • Truly International Holdings
  • Winstar Display Co. Ltd.

Qualitative and quantitative analysis of companies has been conducted to help clients understand the wider business environment as well as the strengths and weaknesses of key industry players. Data is qualitatively analyzed to categorize companies as pure play, category-focused, industry-focused, and diversified; it is quantitatively analyzed to categorize companies as dominant, leading, strong, tentative, and weak.

Recent Development and News in Thin film transistor (tft) liquid crystal display (lcd) market

  • In August, 2024, BMW Group unveiled a luxury sedan featuring a thirty-one-inch theater screen for rear-seat passengers, utilizing thin film transistor liquid crystal display technology to provide a premium entertainment experience.
  • In December, 2024, Continental AG entered a partnership with several display companies to develop curved thin film transistor liquid crystal display units for integrated dashboard systems, focusing on improving cockpit ergonomics.
  • In February, 2025, General Motors Company announced the inclusion of a pillar-to-pillar screen in its upcoming luxury electric SUV series, relying on the stability of thin film transistor liquid crystal display technology for critical information visibility.
  • In May, 2025, Hyundai Motor Company reported the successful implementation of a new head-up display system that projects navigation data onto the windshield using a compact thin film transistor liquid crystal display.

Dive into Technavio’s robust research methodology, blending expert interviews, extensive data synthesis, and validated models for unparalleled Thin Film Transistor (TFT) Liquid Crystal Display (LCD) Market insights. See full methodology.

Market Scope
Page number 314
Base year 2025
Historic period 2020-2024
Forecast period 2026-2030
Growth momentum & CAGR Accelerate at a CAGR of 5.4%
Market growth 2026-2030 USD 50561.2 thousand
Market structure Fragmented
YoY growth 2025-2026(%) 5.1%
Key countries US, Canada, Mexico, China, Japan, India, South Korea, Australia, Indonesia, Germany, UK, France, Italy, Spain, The Netherlands, Brazil, Argentina, Chile, Saudi Arabia, UAE, South Africa, Israel and Turkey
Competitive landscape Leading Companies, Market Positioning of Companies, Competitive Strategies, and Industry Risks

Request Free Sample

Research Analyst Overview

  • The Thin Film Transistor (TFT) Liquid Crystal Display (LCD) Market remains relevant through continuous innovation in its core architecture, from the thin film transistor itself to the liquid crystal cells it controls. As an active switching device technology, its performance is being enhanced with advanced components like IGZO TFT panels and LTPS TFT panels, moving beyond traditional amorphous silicon.
  • This evolution is critical as the market competes with self-emissive display technologies such as OLED and micro-LED. Boardroom decisions are increasingly influenced by the sustainability of the manufacturing process, which includes photolithography and the deposition process. The adoption of AI-driven inspection systems has proven effective, reducing panel defects significantly and directly impacting profitability.
  • Innovations in the backlight unit, including mini-LED backlights and advanced color filters and polarizers, are improving performance metrics like contrast ratio, color gamut, and peak brightness. These enhancements, combined with higher refresh rates and faster response times, make modern TFT-LCDs suitable for demanding applications.
  • The technology is adapting with developments like in-cell touch LCDs, curved display modules, and flexible LCD displays, ensuring its place in next-generation products from pillar to pillar screens in vehicles to high-resolution imaging devices.

What are the Key Data Covered in this Thin Film Transistor (TFT) Liquid Crystal Display (LCD) Market Research and Growth Report?

  • What is the expected growth of the Thin Film Transistor (TFT) Liquid Crystal Display (LCD) Market between 2026 and 2030?

    • USD 50.56 million, at a CAGR of 5.4%

  • What segmentation does the market report cover?

    • The report is segmented by Application (Television, Mobile phones, Monitors, and Others), Type (Large displays, and Small and medium displays), End-user (Consumer electronics, Automotive, Retail and hospitality, Industrial, and Others) and Geography (North America, APAC, Europe, South America, Middle East and Africa)

  • Which regions are analyzed in the report?

    • North America, APAC, Europe, South America and Middle East and Africa

  • What are the key growth drivers and market challenges?

    • Growing demand for high resolution large format displays in television sector, Intense competition from alternative display technologies

  • Who are the major players in the Thin Film Transistor (TFT) Liquid Crystal Display (LCD) Market?

    • AUO Corp., BOE Technology Group Co. Ltd., E Ink Holdings Inc., Fujitsu Ltd., Hannstar Display Corp., Hitachi Ltd., Japan Display Inc., LG Electronics Inc., Panasonic Holdings Corp., Samsung Electronics Co. Ltd., Sharp Corp., Shenzhen Wan Display Co. Ltd., Sony Group Corp., TCL Industries Holdings Ltd., Tianma Microelectronics Co., Toshiba Corp., Truly International Holdings and Winstar Display Co. Ltd.

Market Research Insights

  • The market's dynamics are shaped by a strategic push toward smart manufacturing and application-specific product development. The integration of automated inspection systems has led to a significant reduction in pixel defects, while the use of advanced process control algorithms has improved production yields by as much as 12%.
  • These efficiencies are critical for producing cost-effective consumer electronics and high-performance industrial TFT monitors. Demand is growing for ruggedized displays in industrial settings and advanced automotive infotainment displays featuring superior thermal stability and color accuracy.
  • As companies focus on supply chain resilience, they are also navigating strict environmental compliance standards, driving innovation in energy efficiency and electronic waste recycling to meet global sustainability goals.

We can help! Our analysts can customize this thin film transistor (tft) liquid crystal display (lcd) market research report to meet your requirements.

Get in touch

1. Executive Summary

1.1 Market overview

Executive Summary - Chart on Market Overview
Executive Summary - Data Table on Market Overview
Executive Summary - Chart on Global Market Characteristics
Executive Summary - Chart on Market by Geography
Executive Summary - Chart on Market Segmentation by Application
Executive Summary - Chart on Market Segmentation by Type
Executive Summary - Chart on Market Segmentation by End-user
Executive Summary - Chart on Incremental Growth
Executive Summary - Data Table on Incremental Growth
Executive Summary - Chart on Company Market Positioning

2. Technavio Analysis

2.1 Analysis of price sensitivity, lifecycle, customer purchase basket, adoption rates, and purchase criteria

2.2 Criticality of inputs and Factors of differentiation

Chart on Overview on criticality of inputs and factors of differentiation

2.3 Factors of disruption

Chart on Overview on factors of disruption

2.4 Impact of drivers and challenges

Chart on Impact of drivers and challenges in 2025 and 2030

3. Market Landscape

3.1 Market ecosystem

Chart on Parent Market
Data Table on - Parent Market

3.2 Market characteristics

Chart on Market characteristics analysis

3.3 Value chain analysis

Chart on Value chain analysis

4. Market Sizing

4.1 Market definition

Data Table on Offerings of companies included in the market definition

4.2 Market segment analysis

Market segments

4.3 Market size 2025

4.4 Market outlook: Forecast for 2025-2030

Chart on Global - Market size and forecast 2025-2030 ($ thousand)
Data Table on Global - Market size and forecast 2025-2030 ($ thousand)
Chart on Global Market: Year-over-year growth 2025-2030 (%)
Data Table on Global Market: Year-over-year growth 2025-2030 (%)

5. Historic Market Size

5.1 Global Thin Film Transistor (TFT) Liquid Crystal Display (LCD) Market 2020 - 2024

Historic Market Size - Data Table on Global Thin Film Transistor (TFT) Liquid Crystal Display (LCD) Market 2020 - 2024 ($ thousand)

5.2 Application segment analysis 2020 - 2024

Historic Market Size - Application Segment 2020 - 2024 ($ thousand)

5.3 Type segment analysis 2020 - 2024

Historic Market Size - Type Segment 2020 - 2024 ($ thousand)

5.4 End-user segment analysis 2020 - 2024

Historic Market Size - End-user Segment 2020 - 2024 ($ thousand)

5.5 Geography segment analysis 2020 - 2024

Historic Market Size - Geography Segment 2020 - 2024 ($ thousand)

5.6 Country segment analysis 2020 - 2024

Historic Market Size - Country Segment 2020 - 2024 ($ thousand)

6. Qualitative Analysis

6.1 Impact of AI on Global Thin Film Transistor (TFT) Liquid Crystal Display (LCD) Market

7. Five Forces Analysis

7.1 Five forces summary

Five forces analysis - Comparison between 2025 and 2030

7.2 Bargaining power of buyers

Bargaining power of buyers - Impact of key factors 2025 and 2030

7.3 Bargaining power of suppliers

Bargaining power of suppliers - Impact of key factors in 2025 and 2030

7.4 Threat of new entrants

Threat of new entrants - Impact of key factors in 2025 and 2030

7.5 Threat of substitutes

Threat of substitutes - Impact of key factors in 2025 and 2030

7.6 Threat of rivalry

Threat of rivalry - Impact of key factors in 2025 and 2030

7.7 Market condition

Chart on Market condition - Five forces 2025 and 2030

8. Market Segmentation by Application

8.1 Market segments

Chart on Application - Market share 2025-2030 (%)
Data Table on Application - Market share 2025-2030 (%)

8.2 Comparison by Application

Chart on Comparison by Application
Data Table on Comparison by Application

8.3 Television - Market size and forecast 2025-2030

Chart on Television - Market size and forecast 2025-2030 ($ thousand)
Data Table on Television - Market size and forecast 2025-2030 ($ thousand)
Chart on Television - Year-over-year growth 2025-2030 (%)
Data Table on Television - Year-over-year growth 2025-2030 (%)

8.4 Mobile phones - Market size and forecast 2025-2030

Chart on Mobile phones - Market size and forecast 2025-2030 ($ thousand)
Data Table on Mobile phones - Market size and forecast 2025-2030 ($ thousand)
Chart on Mobile phones - Year-over-year growth 2025-2030 (%)
Data Table on Mobile phones - Year-over-year growth 2025-2030 (%)

8.5 Monitors - Market size and forecast 2025-2030

Chart on Monitors - Market size and forecast 2025-2030 ($ thousand)
Data Table on Monitors - Market size and forecast 2025-2030 ($ thousand)
Chart on Monitors - Year-over-year growth 2025-2030 (%)
Data Table on Monitors - Year-over-year growth 2025-2030 (%)

8.6 Others - Market size and forecast 2025-2030

Chart on Others - Market size and forecast 2025-2030 ($ thousand)
Data Table on Others - Market size and forecast 2025-2030 ($ thousand)
Chart on Others - Year-over-year growth 2025-2030 (%)
Data Table on Others - Year-over-year growth 2025-2030 (%)

8.7 Market opportunity by Application

Market opportunity by Application ($ thousand)
Data Table on Market opportunity by Application ($ thousand)

9. Market Segmentation by Type

9.1 Market segments

Chart on Type - Market share 2025-2030 (%)
Data Table on Type - Market share 2025-2030 (%)

9.2 Comparison by Type

Chart on Comparison by Type
Data Table on Comparison by Type

9.3 Large displays - Market size and forecast 2025-2030

Chart on Large displays - Market size and forecast 2025-2030 ($ thousand)
Data Table on Large displays - Market size and forecast 2025-2030 ($ thousand)
Chart on Large displays - Year-over-year growth 2025-2030 (%)
Data Table on Large displays - Year-over-year growth 2025-2030 (%)

9.4 Small and medium displays - Market size and forecast 2025-2030

Chart on Small and medium displays - Market size and forecast 2025-2030 ($ thousand)
Data Table on Small and medium displays - Market size and forecast 2025-2030 ($ thousand)
Chart on Small and medium displays - Year-over-year growth 2025-2030 (%)
Data Table on Small and medium displays - Year-over-year growth 2025-2030 (%)

9.5 Market opportunity by Type

Market opportunity by Type ($ thousand)
Data Table on Market opportunity by Type ($ thousand)

10. Market Segmentation by End-user

10.1 Market segments

Chart on End-user - Market share 2025-2030 (%)
Data Table on End-user - Market share 2025-2030 (%)

10.2 Comparison by End-user

Chart on Comparison by End-user
Data Table on Comparison by End-user

10.3 Consumer electronics - Market size and forecast 2025-2030

Chart on Consumer electronics - Market size and forecast 2025-2030 ($ thousand)
Data Table on Consumer electronics - Market size and forecast 2025-2030 ($ thousand)
Chart on Consumer electronics - Year-over-year growth 2025-2030 (%)
Data Table on Consumer electronics - Year-over-year growth 2025-2030 (%)

10.4 Automotive - Market size and forecast 2025-2030

Chart on Automotive - Market size and forecast 2025-2030 ($ thousand)
Data Table on Automotive - Market size and forecast 2025-2030 ($ thousand)
Chart on Automotive - Year-over-year growth 2025-2030 (%)
Data Table on Automotive - Year-over-year growth 2025-2030 (%)

10.5 Retail and hospitality - Market size and forecast 2025-2030

Chart on Retail and hospitality - Market size and forecast 2025-2030 ($ thousand)
Data Table on Retail and hospitality - Market size and forecast 2025-2030 ($ thousand)
Chart on Retail and hospitality - Year-over-year growth 2025-2030 (%)
Data Table on Retail and hospitality - Year-over-year growth 2025-2030 (%)

10.6 Industrial - Market size and forecast 2025-2030

Chart on Industrial - Market size and forecast 2025-2030 ($ thousand)
Data Table on Industrial - Market size and forecast 2025-2030 ($ thousand)
Chart on Industrial - Year-over-year growth 2025-2030 (%)
Data Table on Industrial - Year-over-year growth 2025-2030 (%)

10.7 Others - Market size and forecast 2025-2030

Chart on Others - Market size and forecast 2025-2030 ($ thousand)
Data Table on Others - Market size and forecast 2025-2030 ($ thousand)
Chart on Others - Year-over-year growth 2025-2030 (%)
Data Table on Others - Year-over-year growth 2025-2030 (%)

10.8 Market opportunity by End-user

Market opportunity by End-user ($ thousand)
Data Table on Market opportunity by End-user ($ thousand)

11. Customer Landscape

11.1 Customer landscape overview

Analysis of price sensitivity, lifecycle, customer purchase basket, adoption rates, and purchase criteria

12. Geographic Landscape

12.1 Geographic segmentation

Chart on Market share by geography 2025-2030 (%)
Data Table on Market share by geography 2025-2030 (%)

12.2 Geographic comparison

Chart on Geographic comparison
Data Table on Geographic comparison

12.3 North America - Market size and forecast 2025-2030

Chart on North America - Market size and forecast 2025-2030 ($ thousand)
Data Table on North America - Market size and forecast 2025-2030 ($ thousand)
Chart on North America - Year-over-year growth 2025-2030 (%)
Data Table on North America - Year-over-year growth 2025-2030 (%)
Chart on Regional Comparison - North America
Data Table on Regional Comparison - North America

12.3.1 US - Market size and forecast 2025-2030

Chart on US - Market size and forecast 2025-2030 ($ thousand)
Data Table on US - Market size and forecast 2025-2030 ($ thousand)
Chart on US - Year-over-year growth 2025-2030 (%)
Data Table on US - Year-over-year growth 2025-2030 (%)

12.3.2 Canada - Market size and forecast 2025-2030

Chart on Canada - Market size and forecast 2025-2030 ($ thousand)
Data Table on Canada - Market size and forecast 2025-2030 ($ thousand)
Chart on Canada - Year-over-year growth 2025-2030 (%)
Data Table on Canada - Year-over-year growth 2025-2030 (%)

12.3.3 Mexico - Market size and forecast 2025-2030

Chart on Mexico - Market size and forecast 2025-2030 ($ thousand)
Data Table on Mexico - Market size and forecast 2025-2030 ($ thousand)
Chart on Mexico - Year-over-year growth 2025-2030 (%)
Data Table on Mexico - Year-over-year growth 2025-2030 (%)

12.4 APAC - Market size and forecast 2025-2030

Chart on APAC - Market size and forecast 2025-2030 ($ thousand)
Data Table on APAC - Market size and forecast 2025-2030 ($ thousand)
Chart on APAC - Year-over-year growth 2025-2030 (%)
Data Table on APAC - Year-over-year growth 2025-2030 (%)
Chart on Regional Comparison - APAC
Data Table on Regional Comparison - APAC

12.4.1 China - Market size and forecast 2025-2030

Chart on China - Market size and forecast 2025-2030 ($ thousand)
Data Table on China - Market size and forecast 2025-2030 ($ thousand)
Chart on China - Year-over-year growth 2025-2030 (%)
Data Table on China - Year-over-year growth 2025-2030 (%)

12.4.2 Japan - Market size and forecast 2025-2030

Chart on Japan - Market size and forecast 2025-2030 ($ thousand)
Data Table on Japan - Market size and forecast 2025-2030 ($ thousand)
Chart on Japan - Year-over-year growth 2025-2030 (%)
Data Table on Japan - Year-over-year growth 2025-2030 (%)

12.4.3 India - Market size and forecast 2025-2030

Chart on India - Market size and forecast 2025-2030 ($ thousand)
Data Table on India - Market size and forecast 2025-2030 ($ thousand)
Chart on India - Year-over-year growth 2025-2030 (%)
Data Table on India - Year-over-year growth 2025-2030 (%)

12.4.4 South Korea - Market size and forecast 2025-2030

Chart on South Korea - Market size and forecast 2025-2030 ($ thousand)
Data Table on South Korea - Market size and forecast 2025-2030 ($ thousand)
Chart on South Korea - Year-over-year growth 2025-2030 (%)
Data Table on South Korea - Year-over-year growth 2025-2030 (%)

12.4.5 Australia - Market size and forecast 2025-2030

Chart on Australia - Market size and forecast 2025-2030 ($ thousand)
Data Table on Australia - Market size and forecast 2025-2030 ($ thousand)
Chart on Australia - Year-over-year growth 2025-2030 (%)
Data Table on Australia - Year-over-year growth 2025-2030 (%)

12.4.6 Indonesia - Market size and forecast 2025-2030

Chart on Indonesia - Market size and forecast 2025-2030 ($ thousand)
Data Table on Indonesia - Market size and forecast 2025-2030 ($ thousand)
Chart on Indonesia - Year-over-year growth 2025-2030 (%)
Data Table on Indonesia - Year-over-year growth 2025-2030 (%)

12.5 Europe - Market size and forecast 2025-2030

Chart on Europe - Market size and forecast 2025-2030 ($ thousand)
Data Table on Europe - Market size and forecast 2025-2030 ($ thousand)
Chart on Europe - Year-over-year growth 2025-2030 (%)
Data Table on Europe - Year-over-year growth 2025-2030 (%)
Chart on Regional Comparison - Europe
Data Table on Regional Comparison - Europe

12.5.1 Germany - Market size and forecast 2025-2030

Chart on Germany - Market size and forecast 2025-2030 ($ thousand)
Data Table on Germany - Market size and forecast 2025-2030 ($ thousand)
Chart on Germany - Year-over-year growth 2025-2030 (%)
Data Table on Germany - Year-over-year growth 2025-2030 (%)

12.5.2 UK - Market size and forecast 2025-2030

Chart on UK - Market size and forecast 2025-2030 ($ thousand)
Data Table on UK - Market size and forecast 2025-2030 ($ thousand)
Chart on UK - Year-over-year growth 2025-2030 (%)
Data Table on UK - Year-over-year growth 2025-2030 (%)

12.5.3 France - Market size and forecast 2025-2030

Chart on France - Market size and forecast 2025-2030 ($ thousand)
Data Table on France - Market size and forecast 2025-2030 ($ thousand)
Chart on France - Year-over-year growth 2025-2030 (%)
Data Table on France - Year-over-year growth 2025-2030 (%)

12.5.4 Italy - Market size and forecast 2025-2030

Chart on Italy - Market size and forecast 2025-2030 ($ thousand)
Data Table on Italy - Market size and forecast 2025-2030 ($ thousand)
Chart on Italy - Year-over-year growth 2025-2030 (%)
Data Table on Italy - Year-over-year growth 2025-2030 (%)

12.5.5 Spain - Market size and forecast 2025-2030

Chart on Spain - Market size and forecast 2025-2030 ($ thousand)
Data Table on Spain - Market size and forecast 2025-2030 ($ thousand)
Chart on Spain - Year-over-year growth 2025-2030 (%)
Data Table on Spain - Year-over-year growth 2025-2030 (%)

12.5.6 The Netherlands - Market size and forecast 2025-2030

Chart on The Netherlands - Market size and forecast 2025-2030 ($ thousand)
Data Table on The Netherlands - Market size and forecast 2025-2030 ($ thousand)
Chart on The Netherlands - Year-over-year growth 2025-2030 (%)
Data Table on The Netherlands - Year-over-year growth 2025-2030 (%)

12.6 South America - Market size and forecast 2025-2030

Chart on South America - Market size and forecast 2025-2030 ($ thousand)
Data Table on South America - Market size and forecast 2025-2030 ($ thousand)
Chart on South America - Year-over-year growth 2025-2030 (%)
Data Table on South America - Year-over-year growth 2025-2030 (%)
Chart on Regional Comparison - South America
Data Table on Regional Comparison - South America

12.6.1 Brazil - Market size and forecast 2025-2030

Chart on Brazil - Market size and forecast 2025-2030 ($ thousand)
Data Table on Brazil - Market size and forecast 2025-2030 ($ thousand)
Chart on Brazil - Year-over-year growth 2025-2030 (%)
Data Table on Brazil - Year-over-year growth 2025-2030 (%)

12.6.2 Argentina - Market size and forecast 2025-2030

Chart on Argentina - Market size and forecast 2025-2030 ($ thousand)
Data Table on Argentina - Market size and forecast 2025-2030 ($ thousand)
Chart on Argentina - Year-over-year growth 2025-2030 (%)
Data Table on Argentina - Year-over-year growth 2025-2030 (%)

12.6.3 Chile - Market size and forecast 2025-2030

Chart on Chile - Market size and forecast 2025-2030 ($ thousand)
Data Table on Chile - Market size and forecast 2025-2030 ($ thousand)
Chart on Chile - Year-over-year growth 2025-2030 (%)
Data Table on Chile - Year-over-year growth 2025-2030 (%)

12.7 Middle East and Africa - Market size and forecast 2025-2030

Chart on Middle East and Africa - Market size and forecast 2025-2030 ($ thousand)
Data Table on Middle East and Africa - Market size and forecast 2025-2030 ($ thousand)
Chart on Middle East and Africa - Year-over-year growth 2025-2030 (%)
Data Table on Middle East and Africa - Year-over-year growth 2025-2030 (%)
Chart on Regional Comparison - Middle East and Africa
Data Table on Regional Comparison - Middle East and Africa

12.7.1 Saudi Arabia - Market size and forecast 2025-2030

Chart on Saudi Arabia - Market size and forecast 2025-2030 ($ thousand)
Data Table on Saudi Arabia - Market size and forecast 2025-2030 ($ thousand)
Chart on Saudi Arabia - Year-over-year growth 2025-2030 (%)
Data Table on Saudi Arabia - Year-over-year growth 2025-2030 (%)

12.7.2 UAE - Market size and forecast 2025-2030

Chart on UAE - Market size and forecast 2025-2030 ($ thousand)
Data Table on UAE - Market size and forecast 2025-2030 ($ thousand)
Chart on UAE - Year-over-year growth 2025-2030 (%)
Data Table on UAE - Year-over-year growth 2025-2030 (%)

12.7.3 South Africa - Market size and forecast 2025-2030

Chart on South Africa - Market size and forecast 2025-2030 ($ thousand)
Data Table on South Africa - Market size and forecast 2025-2030 ($ thousand)
Chart on South Africa - Year-over-year growth 2025-2030 (%)
Data Table on South Africa - Year-over-year growth 2025-2030 (%)

12.7.4 Israel - Market size and forecast 2025-2030

Chart on Israel - Market size and forecast 2025-2030 ($ thousand)
Data Table on Israel - Market size and forecast 2025-2030 ($ thousand)
Chart on Israel - Year-over-year growth 2025-2030 (%)
Data Table on Israel - Year-over-year growth 2025-2030 (%)

12.7.5 Turkey - Market size and forecast 2025-2030

Chart on Turkey - Market size and forecast 2025-2030 ($ thousand)
Data Table on Turkey - Market size and forecast 2025-2030 ($ thousand)
Chart on Turkey - Year-over-year growth 2025-2030 (%)
Data Table on Turkey - Year-over-year growth 2025-2030 (%)

12.8 Market opportunity by geography

Market opportunity by geography ($ thousand)
Data Tables on Market opportunity by geography ($ thousand)

13. Drivers, Challenges, and Opportunity

13.1 Market drivers

Growing demand for high resolution large format displays in television sector
Rapid integration of advanced display technologies in automotive industry
Proliferation of low-cost thin film transistor liquid crystal display panels

13.2 Market challenges

Intense competition from alternative display technologies
Supply chain disruptions and raw material cost volatility
Regulatory compliance and environmental sustainability pressures

13.3 Impact of drivers and challenges

Impact of drivers and challenges in 2025 and 2030

13.4 Market opportunities

Integration of high refresh rate and ultra-high-definition technologies
Adoption of AI and automated inspection systems in display fabrication
Proliferation of automotive grade and industrial strength thin film transistor LCDs

14. Competitive Landscape

14.1 Overview

14.2

Overview on criticality of inputs and factors of differentiation

14.3 Landscape disruption

Overview on factors of disruption

14.4 Industry risks

Impact of key risks on business

15. Competitive Analysis

15.1 Companies profiled

Companies covered

15.2 Company ranking index

15.3 Market positioning of companies

Matrix on companies position and classification

15.4 AUO Corp.

AUO Corp. - Overview
AUO Corp. - Business segments
AUO Corp. - Key news
AUO Corp. - Key offerings
AUO Corp. - Segment focus
SWOT

15.5 BOE Technology Group Co. Ltd.

BOE Technology Group Co. Ltd. - Overview
BOE Technology Group Co. Ltd. - Business segments
BOE Technology Group Co. Ltd. - Key offerings
BOE Technology Group Co. Ltd. - Segment focus
SWOT

15.6 E Ink Holdings Inc.

E Ink Holdings Inc. - Overview
E Ink Holdings Inc. - Product / Service
E Ink Holdings Inc. - Key news
E Ink Holdings Inc. - Key offerings
SWOT

15.7 Fujitsu Ltd.

Fujitsu Ltd. - Overview
Fujitsu Ltd. - Business segments
Fujitsu Ltd. - Key news
Fujitsu Ltd. - Key offerings
Fujitsu Ltd. - Segment focus
SWOT

15.8 Hannstar Display Corp.

Hannstar Display Corp. - Overview
Hannstar Display Corp. - Product / Service
Hannstar Display Corp. - Key offerings
SWOT

15.9 Hitachi Ltd.

Hitachi Ltd. - Overview
Hitachi Ltd. - Business segments
Hitachi Ltd. - Key news
Hitachi Ltd. - Key offerings
Hitachi Ltd. - Segment focus
SWOT

15.10 Japan Display Inc.

Japan Display Inc. - Overview
Japan Display Inc. - Product / Service
Japan Display Inc. - Key news
Japan Display Inc. - Key offerings
SWOT

15.11 LG Electronics Inc.

LG Electronics Inc. - Overview
LG Electronics Inc. - Business segments
LG Electronics Inc. - Key offerings
LG Electronics Inc. - Segment focus
SWOT

15.12 Panasonic Holdings Corp.

Panasonic Holdings Corp. - Overview
Panasonic Holdings Corp. - Business segments
Panasonic Holdings Corp. - Key news
Panasonic Holdings Corp. - Key offerings
Panasonic Holdings Corp. - Segment focus
SWOT

15.13 Samsung Electronics Co. Ltd.

Samsung Electronics Co. Ltd. - Overview
Samsung Electronics Co. Ltd. - Business segments
Samsung Electronics Co. Ltd. - Key news
Samsung Electronics Co. Ltd. - Key offerings
Samsung Electronics Co. Ltd. - Segment focus
SWOT

15.14 Sharp Corp.

Sharp Corp. - Overview
Sharp Corp. - Business segments
Sharp Corp. - Key news
Sharp Corp. - Key offerings
Sharp Corp. - Segment focus
SWOT

15.15 Shenzhen Wan Display Co. Ltd.

Shenzhen Wan Display Co. Ltd. - Overview
Shenzhen Wan Display Co. Ltd. - Product / Service
Shenzhen Wan Display Co. Ltd. - Key offerings
SWOT

15.16 Sony Group Corp.

Sony Group Corp. - Overview
Sony Group Corp. - Business segments
Sony Group Corp. - Key offerings
Sony Group Corp. - Segment focus
SWOT

15.17 TCL Industries Holdings Ltd.

TCL Industries Holdings Ltd. - Overview
TCL Industries Holdings Ltd. - Business segments
TCL Industries Holdings Ltd. - Key offerings
TCL Industries Holdings Ltd. - Segment focus
SWOT

15.18 Tianma Microelectronics Co.

Tianma Microelectronics Co. - Overview
Tianma Microelectronics Co. - Product / Service
Tianma Microelectronics Co. - Key offerings
SWOT

16. Appendix

16.1 Scope of the report

Market definition
Objectives
Notes and caveats

16.2 Inclusions and exclusions checklist

Inclusions checklist
Exclusions checklist

16.3 Currency conversion rates for US$

16.4 Research methodology

16.5 Data procurement

Information sources

16.6 Data validation

16.7 Validation techniques employed for market sizing

16.8 Data synthesis

16.9 360 degree market analysis

16.10 List of abbreviations

Research Methodology

Technavio presents a detailed picture of the market by way of study, synthesis, and summation of data from multiple sources. The analysts have presented the various facets of the market with a particular focus on identifying the key industry influencers. The data thus presented is comprehensive, reliable, and the result of extensive research, both primary and secondary.

INFORMATION SOURCES

Primary sources

  • Manufacturers and suppliers
  • Channel partners
  • Industry experts
  • Strategic decision makers

Secondary sources

  • Industry journals and periodicals
  • Government data
  • Financial reports of key industry players
  • Historical data
  • Press releases

DATA ANALYSIS

Data Synthesis

  • Collation of data
  • Estimation of key figures
  • Analysis of derived insights

Data Validation

  • Triangulation with data models
  • Reference against proprietary databases
  • Corroboration with industry experts

REPORT WRITING

Qualitative

  • Market drivers
  • Market challenges
  • Market trends
  • Five forces analysis

Quantitative

  • Market size and forecast
  • Market segmentation
  • Geographical insights
  • Competitive landscape

Interested in this report?

Get your sample now to see our research methodology and insights!

Download Now

Frequently Asked Questions

Thin Film Transistor (TFT) Liquid Crystal Display (LCD) market growth will increase by USD 50561.2 thousand thousand during 2026-2030.

The Thin Film Transistor (TFT) Liquid Crystal Display (LCD) market is expected to grow at a CAGR of 5.4% during 2026-2030.

Thin Film Transistor (TFT) Liquid Crystal Display (LCD) market is segmented by Application (Television, Mobile phones, Monitors, Others) Type (Large displays, Small and medium displays) End-user (Consumer electronics, Automotive, Retail and hospitality, Industrial, Others)

AUO Corp., BOE Technology Group Co. Ltd., E Ink Holdings Inc., Fujitsu Ltd., Hannstar Display Corp., Hitachi Ltd., Japan Display Inc., LG Electronics Inc., Panasonic Holdings Corp., Samsung Electronics Co. Ltd., Sharp Corp., Shenzhen Wan Display Co. Ltd., Sony Group Corp., TCL Industries Holdings Ltd., Tianma Microelectronics Co., Toshiba Corp., Truly International Holdings, Winstar Display Co. Ltd. are a few of the key vendors in the Thin Film Transistor (TFT) Liquid Crystal Display (LCD) market.

APAC will register the highest growth rate of 32.8% among the other regions. Therefore, the Thin Film Transistor (TFT) Liquid Crystal Display (LCD) market in APAC is expected to garner significant business opportunities for the vendors during the forecast period.

US, Canada, Mexico, China, Japan, India, South Korea, Australia, Indonesia, Germany, UK, France, Italy, Spain, The Netherlands, Brazil, Argentina, Chile, Saudi Arabia, UAE, South Africa, Israel, Turkey

  • Growing demand for high resolution large format displays in television sector is the driving factor this market.

The Thin Film Transistor (TFT) Liquid Crystal Display (LCD) market vendors should focus on grabbing business opportunities from the Application segment as it accounted for the largest market share in the base year.
RIA - Research AI Assistant
Ask RIA