Third Party Logistics Software Market Analysis North America, Europe, APAC, South America, Middle East and Africa - US, UK, China, Germany, Japan - Size and Forecast 2024-2028

Third Party Logistics Software Market Analysis North America, Europe, APAC, South America, Middle East and Africa - US, UK, China, Germany, Japan - Size and Forecast 2024-2028

Published: Jul 2024 136 Pages SKU: IRTNTR74576

Market Overview at a Glance

$482.3 Mn
Market Opportunity
8.12%
CAGR
7.51
YoY growth 2023-2024(%)

Third Party Logistics Software Market Size 2024-2028 

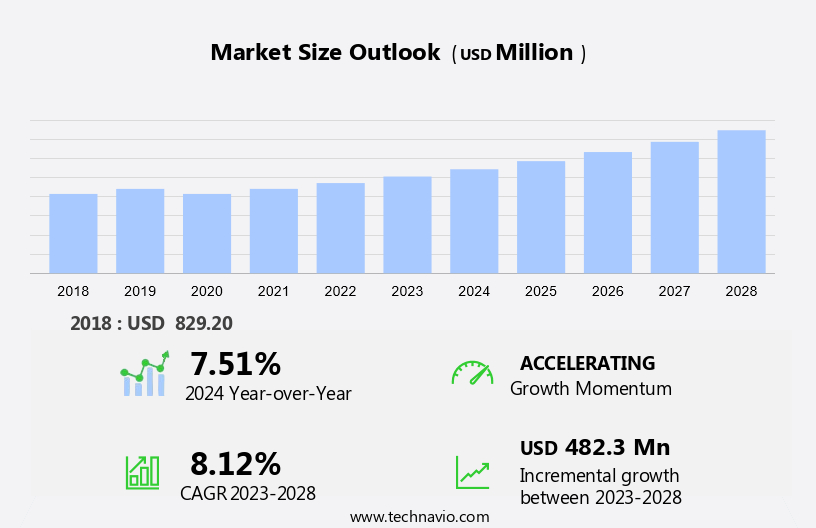
The third party logistics software market size is forecast to increase by USD 482.3 million at a CAGR of 8.12% between 2023 and 2028. The logistics industry is experiencing a surge in private equity (PE) investments, driven by the sector's attractive growth prospects. PE firms are recognizing the potential of logistics in supporting various industries, particularly e-commerce, which is witnessing unprecedented growth. Three-party logistics (3PL) providers are increasingly being adopted by merchants to streamline their supply chain operations and improve efficiency. The growing importance of timely and reliable delivery in today's marketplace further bolsters the demand for professional logistics services. As a result, the logistics industry is poised for significant growth, offering PE firms attractive investment opportunities. Additionally, the rise of e-commerce has accelerated the need for efficient and cost-effective logistics solutions, creating a favorable environment for industry players and investors alike.

What will be the Size of the Market During the Forecast Period?

Third Party Logistics Software Market Size

For More Highlights About this Report, Request Free Sample

Market Dynamic and Customer Landscape

The market is witnessing significant growth due to the increasing demand from ecommerce companies for efficient supply chain operations. This software assists in managing various aspects of logistics, including inventory management, warehouse storage, order fulfillment, returns processing, transportation services, kitting, and reverse logistics. Manufacturers and distributors also benefit from 3PL software by streamlining their product line and reducing overhead costs. Ecommerce fulfillment services, freight transportation companies, and fulfillment companies are major contributors to the market. Service agreements between these companies and online stores provide logistical support, ensuring communication and visibility throughout the global supply chain. Performance monitoring and technology integration are crucial factors driving the market's growth. Warehousing companies are also investing in advanced 3PL software to enhance their capabilities and offer same-day shipping services. Overall, the market is expected to continue its expansion, providing valuable solutions for businesses seeking to optimize their supply chain operations.

Key Market Driver

Rising private equity (PE) investments in logistics industry is notably driving market growth. The global third-party logistics (3PL) software market is experiencing significant growth due to increasing private equity (PE) investments in the logistics industry. PE investments provide crucial capital for asset acquisition, which strengthens asset-based business models. With substantial capital requirements in logistics operations, PE investments enable companies to expand their business, generate synergies from joint ventures (JVs) and strategic partnerships.

For example, PE firms like Morgan Stanley, Warburg Pincus, and LOGOS India have pledged to invest approximately USD 200 million in cities such as Bengaluru, Chennai, and Pune in India. Expenditures on transportation, inventory carrying, and other delivery-related activities have reached unprecedented levels. Order receipt and international shipping processes are streamlined through freight forwarding and 3PL software solutions, enhancing overall logistics efficiency. Thus, such factors are driving the growth of the market during the forecast period.

Significant Market Trends

Integration of technologically advanced solutions is the key trend in the market. Logistics operations face operational inefficiencies that persistently challenge logistics companies worldwide. To address these issues, end-users are increasingly adopting logistics software solutions for transportation management, inventory management, and warehouse management. Vendors are responding to this trend by introducing advanced software solutions, incorporating Artificial Intelligence (AI) technology. AI significantly enhances supply chain management by optimizing warehousing operations, including data collection, analysis, and inventory processing.

Besides, in the realm of international shipping and freight forwarding, AI is employed to predict demand, plan supply, and demand forecasts, optimize warehouse management stock, and ensure shipping accuracy. By reducing lead times and transportation expenses, AI-driven logistics software solutions contribute to streamlined and cost-effective logistics operations. Thus, such trends will shape the growth of the market during the forecast period.

Major Market Challenge

Growing number of cargo thefts is the major challenge that affects the growth of the market. The global logistics landscape is facing a significant challenge in the form of cargo theft, which poses a threat to both businesses and consumers. As businesses expand their operations internationally, the risk of cargo being stolen during shipping increases. The economic downturn has fueled the demand for black-market goods, leading to a surge in cargo theft incidents. In the United States alone, an estimated USD 22.5 billion worth of cargo is stolen annually. Effective logistics operations are crucial for ensuring timely delivery and maintaining the integrity of goods.

Further, to mitigate the risk of cargo theft, third-party logistics software solutions have gained popularity. These software solutions facilitate order receipt, inventory management, freight forwarding, and international shipping, thereby enhancing the security and transparency of logistics operations. Hence, the above factors will impede the growth of the market during the forecast period

Exclusive Customer Landscape

The market forecasting report includes the adoption lifecycle of the market, covering from the innovator’s stage to the laggard’s stage. It focuses on adoption rates in different regions based on penetration. Furthermore, the market forecast report also includes key purchase criteria and drivers of price sensitivity to help companies evaluate and develop their market growth analysis strategies.
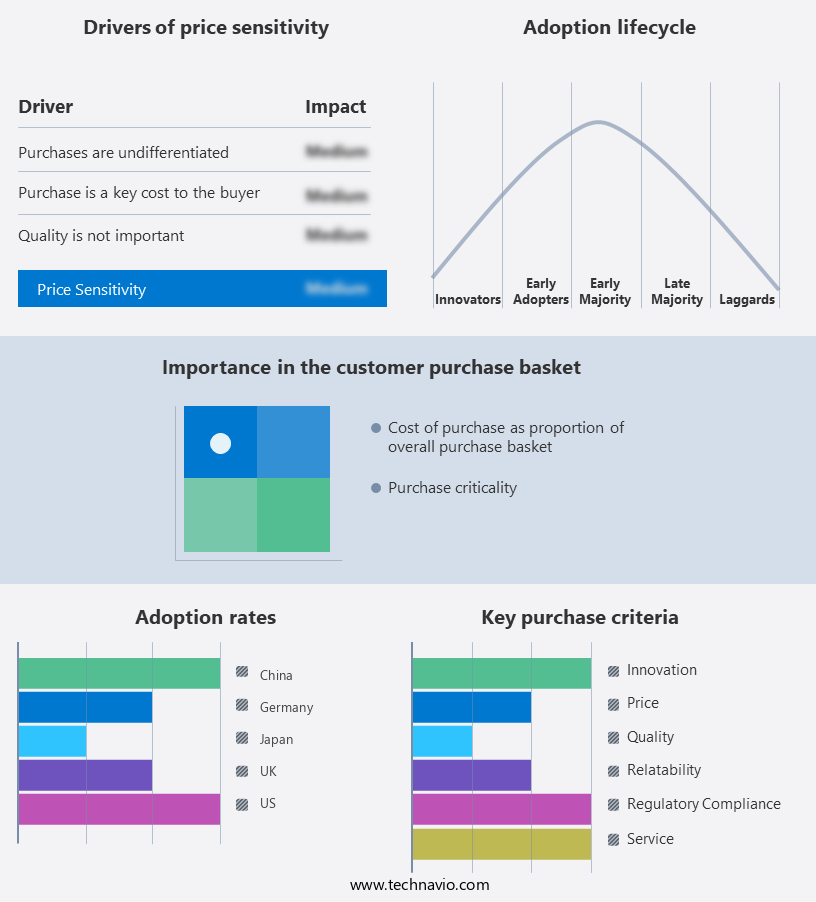
Third Party Logistics Software Market Share by Geography

 Customer Landscape

Key Companies & Market Insights

Companies are implementing various strategies, such as strategic alliances, partnerships, mergers and acquisitions, geographical expansion, and product/service launches, to enhance their presence in the market.

Blue Yonder Inc.: The company offers third party logistics software to optimize network design, execute unified logistics, digitize intra DC operations and attain real time end to end visibility.

The market research and growth report also includes detailed analyses of the competitive landscape of the market and information about key companies, including:

  • Agiliron
  • Cadre Technologies Inc.
  • Camelot 3PL Software
  • CartonCloud
  • Dassault Systemes SE
  • Descartes Systems Group Inc.
  • E2open Parent Holdings Inc.
  • Epicor Software Corp.
  • Fishbowl
  • HighJump Software Inc.
  • Infor Inc.
  • International Business Machines Corp.
  • Logiwa Inc.
  • Logixgrid Technologies Pvt. Ltd.
  • Manhattan Associates Inc.
  • Oracle Corp.
  • SAP SE
  • Softeon
  • The Access Group

Qualitative and quantitative analysis of companies has been conducted to help clients understand the wider business environment as well as the strengths and weaknesses of key market players. Data is qualitatively analyzed to categorize companies as pure play, category-focused, industry-focused, and diversified; it is quantitatively analyzed to categorize companies as dominant, leading, strong, tentative, and weak.

Market Segmentation

By Deployment 

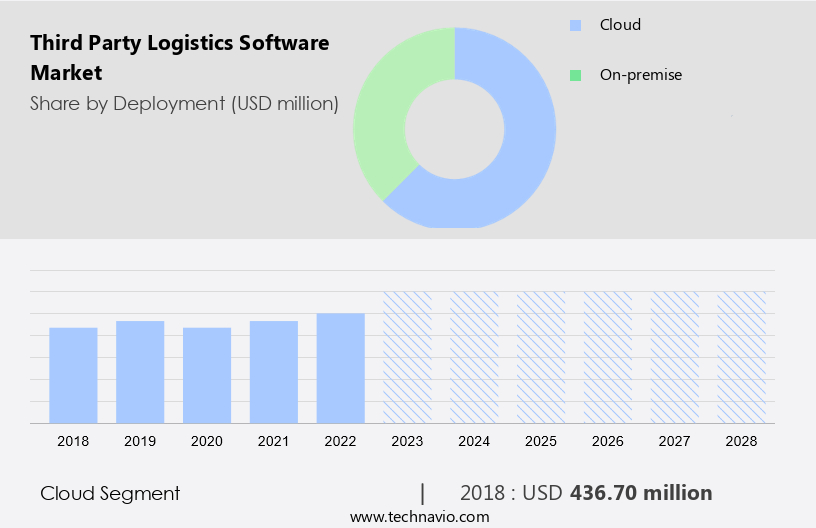
The cloud segment is estimated to witness significant growth during the forecast period. Ecommerce companies rely on Third Party Logistics (3PL) providers to manage their supply chain operations, from inventory management and warehouse storage to order fulfillment and returns processing. These services enable online stores to streamline their logistical support and focus on their core product line. 3PLs offer various solutions, including transportation services for global supply chains, import/export, and customs procedures. They also provide specialized services like cold chains for perishable goods and handling of hazardous materials.

Third Party Logistics Software Market Size

Get a glance at the market share of various regions Download the PDF Sample

The cloud segment accounted for USD 436.70 million in 2018. Manufacturers and distributors benefit from 3PLs' expertise in logistical support and technology to optimize their operations. Freight forwarders and fulfillment companies offer service agreements with communication and visibility features, ensuring efficient performance monitoring. Warehousing companies specializing in 3PL services provide customized solutions, adhering to industry standards and regulations. Supply chain management solutions from 3PLs enable real-time tracking and optimization of overhead costs, capital investment, and order processing. In summary, 3PLs play a pivotal role in the ecommerce industry by offering comprehensive logistical support, from warehousing to freight transportation companies.

Regional Analysis

Third Party Logistics Software Market Share by Geography

For more insights on the market share of various regions Download PDF Sample now!

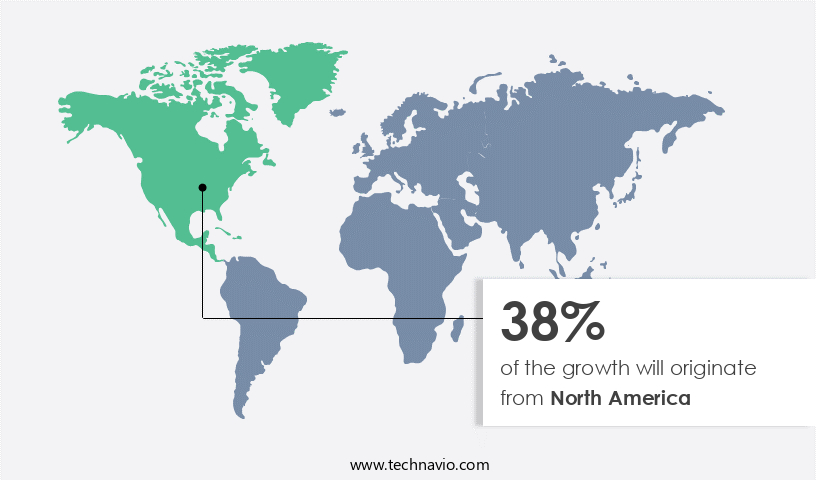
North America is estimated to contribute 38% to the growth of the global market during the forecast period. Technavio’s analysts have elaborately explained the regional trends and drivers that shape the market during the forecast period. Ecommerce companies rely on Third Party Logistics (3PL) providers to manage their supply chain operations, including fulfillment center functions such as inventory management, warehouse storage, order fulfillment, and returns processing. These services enable online stores to streamline their logistical support and focus on their core product line. 3PLs offer transportation services, handling global supply chain complexities like import/export and customs procedures.

Further, capital investment in technology and infrastructure is crucial for 3PLs to maintain efficient operations and meet the evolving needs of their clients. Service agreements between ecommerce companies and 3PLs outline communication and visibility expectations, performance monitoring, and warehousing company responsibilities. The collaboration between ecommerce businesses and 3PLs results in a well-oiled supply chain, enabling seamless order processing and reducing overhead costs. Freight transportation companies and fulfillment companies are integral parts of the 3PL ecosystem, providing logistical support and ensuring timely delivery of products to customers.

Segment Overview

The market research report provides comprehensive data (region-wise segment analysis), with forecasts and estimates in "USD million " for the period 2024-2028, as well as historical data from 2018-2022 for the following segments.

  • Deployment Outlook
    • On-premise
    • Cloud-based
  • Region Outlook
    • North America
      • The U.S.
      • Canada
    • Europe
      • U.K.
      • Germany
      • France
      • Rest of Europe
    • APAC
      • China
      • India
    • South America
      • Chile
      • Brazil
      • Argentina
    • Middle East & Africa
      • Saudi Arabia
      • South Africa
      • Rest of the Middle East & Africa

You may also interested in below market reports:

Market Analyst Overview:

The Third Party Logistics (3PL) software market caters to the needs of ecommerce companies looking to streamline their supply chain operations. This software enables effective management of fulfillment centers, inventory, warehouse storage, order fulfillment, returns processing, transportation services, and more. Ecommerce businesses can benefit from the integration of IT infrastructure with their product line, reducing overhead costs and improving logistical support. 3PL software is crucial for managing global supply chains, including import/export and customs procedures.

Also, they offers solutions for handling special commodities such as cold chains and hazardous materials. Warehouse management software is a significant component of 3PL, ensuring efficient kitting, same-day shipping, and reverse logistics. Manufacturers, distributors, and online stores rely on 3PL for their order processing and logistical needs. Capital investment in 3PL software can lead to improved performance monitoring, communication and visibility, and service agreements with freight transportation companies and fulfillment and logistics partner.

Further, the market for 3PL software is vast and diverse, catering to various industries and business sizes. Warehousing companies and supply chain management firms are key players in this market, providing comprehensive logistical solutions to their clients. The Third Party Logistics Software Market is rapidly expanding to accommodate manufacturer, distributor, and online store managing large or bulky products, offering integrated solutions for fulfillment, logistics, shipping and receiving services, and inventory shelf management across residential LTL freight and warehouse 3PL operations.

Market Scope

Report Coverage

Details

Page number

136

Base year

2023

Historic period

2018-2022

Forecast period

2024-2028

Growth momentum & CAGR

Accelerate at a CAGR of 8.12%

Market growth 2024-2028

USD 482.3 million

Market structure

Fragmented

YoY growth 2023-2024(%)

7.51

Regional analysis

North America, Europe, APAC, South America, and Middle East and Africa

Performing market contribution

North America at 38%

Key countries

US, UK, China, Germany, and Japan

Competitive landscape

Leading Companies, Market Positioning of Companies, Competitive Strategies, and Industry Risks

Key companies profiled

Agiliron, Blue Yonder Inc., Cadre Technologies Inc., Camelot 3PL Software, CartonCloud, Dassault Systemes SE, Descartes Systems Group Inc., E2open Parent Holdings Inc., Epicor Software Corp., Fishbowl, HighJump Software Inc., Infor Inc., International Business Machines Corp., Logiwa Inc., Logixgrid Technologies Pvt. Ltd., Manhattan Associates Inc., Oracle Corp., SAP SE, Softeon, and The Access Group

Market dynamics

Parent market analysis, Market growth inducers and obstacles, Fast-growing and slow-growing segment analysis, COVID-19 impact and recovery analysis and future consumer dynamics, Market condition analysis for forecast period

Customization purview

If our report has not included the data that you are looking for, you can reach out to our analysts and get segments customized.

Download PDF Sample

What are the Key Data Covered in this Market Research Report?

  • CAGR of the market during the forecast period
  • Detailed information on factors that will drive the market growth and forecasting between 2024 and 2028
  • Precise estimation of the size of the market  and its contribution of the market in focus to the parent market
  • Accurate predictions about upcoming market growth and trends and changes in consumer behavior
  • Growth of the market across North America, Europe, APAC, South America, and Middle East and Africa
  • Thorough analysis of the market’s competitive landscape and detailed information about companies
  • Comprehensive analysis of factors that will challenge the growth of market companies

1 Executive Summary

  • 1.1 Market overview
    • Executive Summary - Chart on Market Overview
    • Executive Summary - Data Table on Market Overview
    • Executive Summary - Chart on Global Market Characteristics
    • Executive Summary - Chart on Market by Geography
    • Executive Summary - Chart on Market Segmentation by Deployment
    • Executive Summary - Chart on Incremental Growth
    • Executive Summary - Data Table on Incremental Growth
    • Executive Summary - Chart on Company Market Positioning

2 Market Landscape

  • 2.1 Market ecosystem
    • Parent Market
    • Data Table on - Parent Market
  • 2.2 Market characteristics
    • Market characteristics analysis
  • 2.3 Value chain analysis
    • Value Chain Analysis

3 Market Sizing

  • 3.1 Market definition
    • Offerings of companies included in the market definition
  • 3.2 Market segment analysis
    • Market segments
  • 3.3 Market size 2023
    • 3.4 Market outlook: Forecast for 2023-2028
      • Chart on Global - Market size and forecast 2023-2028 ($ million)
      • Data Table on Global - Market size and forecast 2023-2028 ($ million)
      • Chart on Global Market: Year-over-year growth 2023-2028 (%)
      • Data Table on Global Market: Year-over-year growth 2023-2028 (%)

    4 Historic Market Size

    • 4.1 Global Third Party Logistics Software Market 2018 - 2022
      • Historic Market Size - Data Table on Global Third Party Logistics Software Market 2018 - 2022 ($ million)
    • 4.2 Deployment segment analysis 2018 - 2022
      • Historic Market Size - Deployment Segment 2018 - 2022 ($ million)
    • 4.3 Geography segment analysis 2018 - 2022
      • Historic Market Size - Geography Segment 2018 - 2022 ($ million)
    • 4.4 Country segment analysis 2018 - 2022
      • Historic Market Size - Country Segment 2018 - 2022 ($ million)

    5 Five Forces Analysis

    • 5.1 Five forces summary
      • Five forces analysis - Comparison between 2023 and 2028
    • 5.2 Bargaining power of buyers
      • Bargaining power of buyers - Impact of key factors 2023 and 2028
    • 5.3 Bargaining power of suppliers
      • Bargaining power of suppliers - Impact of key factors in 2023 and 2028
    • 5.4 Threat of new entrants
      • Threat of new entrants - Impact of key factors in 2023 and 2028
    • 5.5 Threat of substitutes
      • Threat of substitutes - Impact of key factors in 2023 and 2028
    • 5.6 Threat of rivalry
      • Threat of rivalry - Impact of key factors in 2023 and 2028
    • 5.7 Market condition
      • Chart on Market condition - Five forces 2023 and 2028

    6 Market Segmentation by Deployment

    • 6.1 Market segments
      • Chart on Deployment - Market share 2023-2028 (%)
      • Data Table on Deployment - Market share 2023-2028 (%)
    • 6.2 Comparison by Deployment
      • Chart on Comparison by Deployment
      • Data Table on Comparison by Deployment
    • 6.3 Cloud - Market size and forecast 2023-2028
      • Chart on Cloud - Market size and forecast 2023-2028 ($ million)
      • Data Table on Cloud - Market size and forecast 2023-2028 ($ million)
      • Chart on Cloud - Year-over-year growth 2023-2028 (%)
      • Data Table on Cloud - Year-over-year growth 2023-2028 (%)
    • 6.4 On-premise - Market size and forecast 2023-2028
      • Chart on On-premise - Market size and forecast 2023-2028 ($ million)
      • Data Table on On-premise - Market size and forecast 2023-2028 ($ million)
      • Chart on On-premise - Year-over-year growth 2023-2028 (%)
      • Data Table on On-premise - Year-over-year growth 2023-2028 (%)
    • 6.5 Market opportunity by Deployment
      • Market opportunity by Deployment ($ million)
      • Data Table on Market opportunity by Deployment ($ million)

    7 Customer Landscape

    • 7.1 Customer landscape overview
      • Analysis of price sensitivity, lifecycle, customer purchase basket, adoption rates, and purchase criteria

    8 Geographic Landscape

    • 8.1 Geographic segmentation
      • Chart on Market share by geography 2023-2028 (%)
      • Data Table on Market share by geography 2023-2028 (%)
    • 8.2 Geographic comparison
      • Chart on Geographic comparison
      • Data Table on Geographic comparison
    • 8.3 North America - Market size and forecast 2023-2028
      • Chart on North America - Market size and forecast 2023-2028 ($ million)
      • Data Table on North America - Market size and forecast 2023-2028 ($ million)
      • Chart on North America - Year-over-year growth 2023-2028 (%)
      • Data Table on North America - Year-over-year growth 2023-2028 (%)
    • 8.4 Europe - Market size and forecast 2023-2028
      • Chart on Europe - Market size and forecast 2023-2028 ($ million)
      • Data Table on Europe - Market size and forecast 2023-2028 ($ million)
      • Chart on Europe - Year-over-year growth 2023-2028 (%)
      • Data Table on Europe - Year-over-year growth 2023-2028 (%)
    • 8.5 APAC - Market size and forecast 2023-2028
      • Chart on APAC - Market size and forecast 2023-2028 ($ million)
      • Data Table on APAC - Market size and forecast 2023-2028 ($ million)
      • Chart on APAC - Year-over-year growth 2023-2028 (%)
      • Data Table on APAC - Year-over-year growth 2023-2028 (%)
    • 8.6 South America - Market size and forecast 2023-2028
      • Chart on South America - Market size and forecast 2023-2028 ($ million)
      • Data Table on South America - Market size and forecast 2023-2028 ($ million)
      • Chart on South America - Year-over-year growth 2023-2028 (%)
      • Data Table on South America - Year-over-year growth 2023-2028 (%)
    • 8.7 Middle East and Africa - Market size and forecast 2023-2028
      • Chart on Middle East and Africa - Market size and forecast 2023-2028 ($ million)
      • Data Table on Middle East and Africa - Market size and forecast 2023-2028 ($ million)
      • Chart on Middle East and Africa - Year-over-year growth 2023-2028 (%)
      • Data Table on Middle East and Africa - Year-over-year growth 2023-2028 (%)
    • 8.8 US - Market size and forecast 2023-2028
      • Chart on US - Market size and forecast 2023-2028 ($ million)
      • Data Table on US - Market size and forecast 2023-2028 ($ million)
      • Chart on US - Year-over-year growth 2023-2028 (%)
      • Data Table on US - Year-over-year growth 2023-2028 (%)
    • 8.9 UK - Market size and forecast 2023-2028
      • Chart on UK - Market size and forecast 2023-2028 ($ million)
      • Data Table on UK - Market size and forecast 2023-2028 ($ million)
      • Chart on UK - Year-over-year growth 2023-2028 (%)
      • Data Table on UK - Year-over-year growth 2023-2028 (%)
    • 8.10 China - Market size and forecast 2023-2028
      • Chart on China - Market size and forecast 2023-2028 ($ million)
      • Data Table on China - Market size and forecast 2023-2028 ($ million)
      • Chart on China - Year-over-year growth 2023-2028 (%)
      • Data Table on China - Year-over-year growth 2023-2028 (%)
    • 8.11 Germany - Market size and forecast 2023-2028
      • Chart on Germany - Market size and forecast 2023-2028 ($ million)
      • Data Table on Germany - Market size and forecast 2023-2028 ($ million)
      • Chart on Germany - Year-over-year growth 2023-2028 (%)
      • Data Table on Germany - Year-over-year growth 2023-2028 (%)
    • 8.12 Japan - Market size and forecast 2023-2028
      • Chart on Japan - Market size and forecast 2023-2028 ($ million)
      • Data Table on Japan - Market size and forecast 2023-2028 ($ million)
      • Chart on Japan - Year-over-year growth 2023-2028 (%)
      • Data Table on Japan - Year-over-year growth 2023-2028 (%)
    • 8.13 Market opportunity by geography
      • Market opportunity by geography ($ million)
      • Data Tables on Market opportunity by geography ($ million)

    9 Drivers, Challenges, and Opportunity/Restraints

    • 9.1 Market drivers
      • 9.2 Market challenges
        • 9.3 Impact of drivers and challenges
          • Impact of drivers and challenges in 2023 and 2028
        • 9.4 Market opportunities/restraints

          10 Competitive Landscape

          • 10.1 Overview
            • 10.2 Competitive Landscape
              • Overview on criticality of inputs and factors of differentiation
            • 10.3 Landscape disruption
              • Overview on factors of disruption
            • 10.4 Industry risks
              • Impact of key risks on business

            11 Competitive Analysis

            • 11.1 Companies profiled
              • Companies covered
            • 11.2 Market positioning of companies
              • Matrix on companies position and classification
            • 11.3 Blue Yonder Inc.
              • Blue Yonder Inc. - Overview
              • Blue Yonder Inc. - Product / Service
              • Blue Yonder Inc. - Key offerings
            • 11.4 Camelot 3PL Software
              • Camelot 3PL Software - Overview
              • Camelot 3PL Software - Product / Service
              • Camelot 3PL Software - Key offerings
            • 11.5 Dassault Systemes SE
              • Dassault Systemes SE - Overview
              • Dassault Systemes SE - Product / Service
              • Dassault Systemes SE - Key news
              • Dassault Systemes SE - Key offerings
            • 11.6 Descartes Systems Group Inc.
              • Descartes Systems Group Inc. - Overview
              • Descartes Systems Group Inc. - Product / Service
              • Descartes Systems Group Inc. - Key offerings
            • 11.7 Epicor Software Corp.
              • Epicor Software Corp. - Overview
              • Epicor Software Corp. - Product / Service
              • Epicor Software Corp. - Key news
              • Epicor Software Corp. - Key offerings
            • 11.8 HighJump Software Inc.
              • HighJump Software Inc. - Overview
              • HighJump Software Inc. - Product / Service
              • HighJump Software Inc. - Key offerings
            • 11.9 Infor Inc.
              • Infor Inc. - Overview
              • Infor Inc. - Product / Service
              • Infor Inc. - Key news
              • Infor Inc. - Key offerings
            • 11.10 Manhattan Associates Inc.
              • Manhattan Associates Inc. - Overview
              • Manhattan Associates Inc. - Business segments
              • Manhattan Associates Inc. - Key news
              • Manhattan Associates Inc. - Key offerings
              • Manhattan Associates Inc. - Segment focus
            • 11.11 Oracle Corp.
              • Oracle Corp. - Overview
              • Oracle Corp. - Business segments
              • Oracle Corp. - Key news
              • Oracle Corp. - Key offerings
              • Oracle Corp. - Segment focus
            • 11.12 SAP SE
              • SAP SE - Overview
              • SAP SE - Business segments
              • SAP SE - Key news
              • SAP SE - Key offerings
              • SAP SE - Segment focus

            12 Appendix

            • 12.1 Scope of the report
              • 12.2 Inclusions and exclusions checklist
                • Inclusions checklist
                • Exclusions checklist
              • 12.3 Currency conversion rates for US$
                • Currency conversion rates for US$
              • 12.4 Research methodology
                • Research methodology
              • 12.5 Data procurement
                • Information sources
              • 12.6 Data validation
                • Data validation
              • 12.7 Validation techniques employed for market sizing
                • Validation techniques employed for market sizing
              • 12.8 Data synthesis
                • Data synthesis
              • 12.9 360 degree market analysis
                • 360 degree market analysis
              • 12.10 List of abbreviations
                • List of abbreviations

              Research Methodology

              Technavio presents a detailed picture of the market by way of study, synthesis, and summation of data from multiple sources. The analysts have presented the various facets of the market with a particular focus on identifying the key industry influencers. The data thus presented is comprehensive, reliable, and the result of extensive research, both primary and secondary.

              INFORMATION SOURCES

              Primary sources

              • Manufacturers and suppliers
              • Channel partners
              • Industry experts
              • Strategic decision makers

              Secondary sources

              • Industry journals and periodicals
              • Government data
              • Financial reports of key industry players
              • Historical data
              • Press releases

              DATA ANALYSIS

              Data Synthesis

              • Collation of data
              • Estimation of key figures
              • Analysis of derived insights

              Data Validation

              • Triangulation with data models
              • Reference against proprietary databases
              • Corroboration with industry experts

              REPORT WRITING

              Qualitative

              • Market drivers
              • Market challenges
              • Market trends
              • Five forces analysis

              Quantitative

              • Market size and forecast
              • Market segmentation
              • Geographical insights
              • Competitive landscape

              Interested in this report?

              Get your sample now to see our research methodology and insights!

              Download Now

              Frequently Asked Questions

              Third Party Logistics Software market growth will increase by $ 482.3 mn during 2024-2028 .

              The Third Party Logistics Software market is expected to grow at a CAGR of 8.12% during 2024-2028 .

              Third Party Logistics Software market is segmented by Deployment( Cloud, On-premise)

              Agiliron, Blue Yonder Inc., Cadre Technologies Inc., Camelot 3PL Software, CartonCloud, Dassault Systemes SE, Descartes Systems Group Inc., E2open Parent Holdings Inc., Epicor Software Corp., Fishbowl, HighJump Software Inc., Infor Inc., International Business Machines Corp., Logiwa Inc., Logixgrid Technologies Pvt. Ltd., Manhattan Associates Inc., Oracle Corp., SAP SE, Softeon, The Access Group are a few of the key vendors in the Third Party Logistics Software market.

              North America will register the highest growth rate of 38% among the other regions. Therefore, the Third Party Logistics Software market in North America is expected to garner significant business opportunities for the vendors during the forecast period.

              US, UK, China, Germany, Japan

              • Rising private equity (PE) investments in logistics industryThe rising levels of PE investments in the logistics industry are driving the growth of the global 3PL software market. In the logistics industry is the driving factor this market.
              • PE investments help with asset acquisition is the driving factor this market.
              • which is ideal for a strong asset-based business model. As significant capital investments are required in the logistics industry is the driving factor this market.
              • PE investments help companies expand their business operations and produce synergies from joint ventures (JVs) and strategic partnerships. For instance is the driving factor this market.
              • PE companies is the driving factor this market.
              • such as Morgan Stanley is the driving factor this market.
              • Warburg Pincus is the driving factor this market.
              • and LOGOS India is the driving factor this market.
              • announced their plan to invest nearly $200 million in cities such as Bengaluru is the driving factor this market.
              • Chennai is the driving factor this market.
              • and Pune in India. Spending on transportation is the driving factor this market.
              • inventory carrying is the driving factor this market.
              • and other shipping-related activities has reached its highest level. About two-fifths of the overall cost of logistics is associated with last-mile delivery. Hence is the driving factor this market.
              • logistics service providers are coming up with innovative solutions to deliver packages within cities. Logistics software combines next-generation IT solutions is the driving factor this market.
              • such as analytics is the driving factor this market.
              • cloud computing is the driving factor this market.
              • and blockchain technology. Logistics service providers are investing in advanced IT solutions to enable real-time tracking of warehouse and transportation operations. Growing PE investments in logistics across the world and the rising adoption of digitalization will increase the demand for 3PL software solutions during the forecast period.   is the driving factor this market.

              The Third Party Logistics Software market vendors should focus on grabbing business opportunities from the Cloud segment as it accounted for the largest market share in the base year.