
US Third-party Logistics (3PL) Market Size 2026-2030
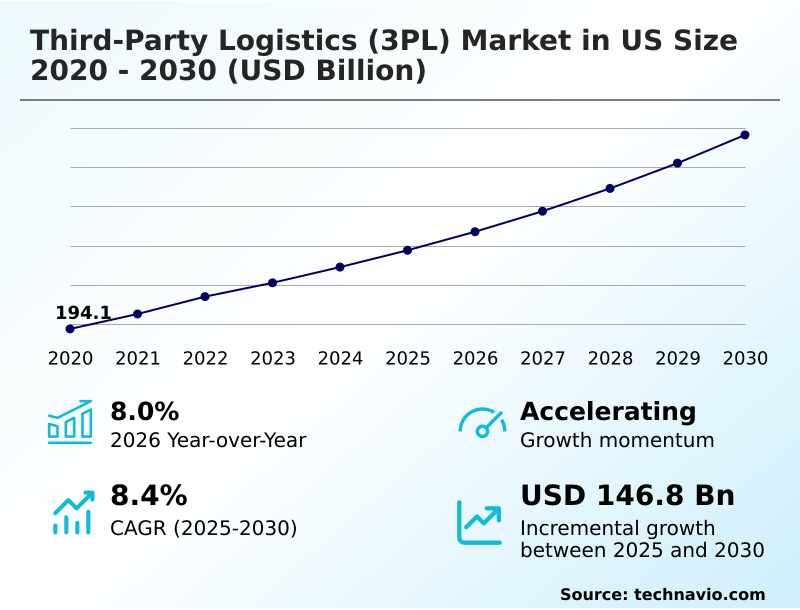
The us third-party logistics (3pl) market size is valued to increase by USD 146.8 billion, at a CAGR of 8.4% from 2025 to 2030. E-commerce fulfillment volume growth will drive the us third-party logistics (3pl) market.
Major Market Trends & Insights
- By End-user - Retail segment was valued at USD 77.3 billion in 2024
- By Service - Transportation segment accounted for the largest market revenue share in 2024
Market Size & Forecast
- Market Opportunities: USD 246.9 billion
- Market Future Opportunities: USD 146.8 billion
- CAGR from 2025 to 2030 : 8.4%
Market Summary
- The third-party logistics (3PL) market in US serves as a critical enabler of commerce, providing outsourced solutions for transport, warehousing, and supply chain management. Growth is fueled by the unabating expansion of e-commerce, which necessitates sophisticated fulfillment and rapid delivery capabilities. This has spurred investment in advanced technologies and geographically strategic distribution centers to meet consumer expectations.
- A significant trend shaping the market is the adoption of automation and robotics within warehouses to enhance efficiency and accuracy, directly addressing persistent labor shortages. For instance, a large distributor can leverage autonomous mobile robots to process thousands of orders overnight, a task that would otherwise require multiple human shifts, thereby accelerating fulfillment without increasing headcount.
- Concurrently, the move toward onshoring manufacturing is creating new demand for domestic logistics and intermodal transportation strategies. However, the industry grapples with challenges such as navigating complex regulatory landscapes, rising cybersecurity threats in an increasingly digital environment, and managing the high costs associated with fleet electrification and other sustainability initiatives.
- Success hinges on a provider's ability to integrate technologies like digital freight matching to optimize capacity and provide end-to-end visibility.
What will be the Size of the US Third-party Logistics (3PL) Market during the forecast period?
Get Key Insights on Market Forecast (PDF) Get Free Sample
How is the US Third-party Logistics (3PL) Market Segmented?
The us third-party logistics (3pl) industry research report provides comprehensive data (region-wise segment analysis), with forecasts and estimates in "USD billion" for the period 2026-2030, as well as historical data from 2020-2024 for the following segments.
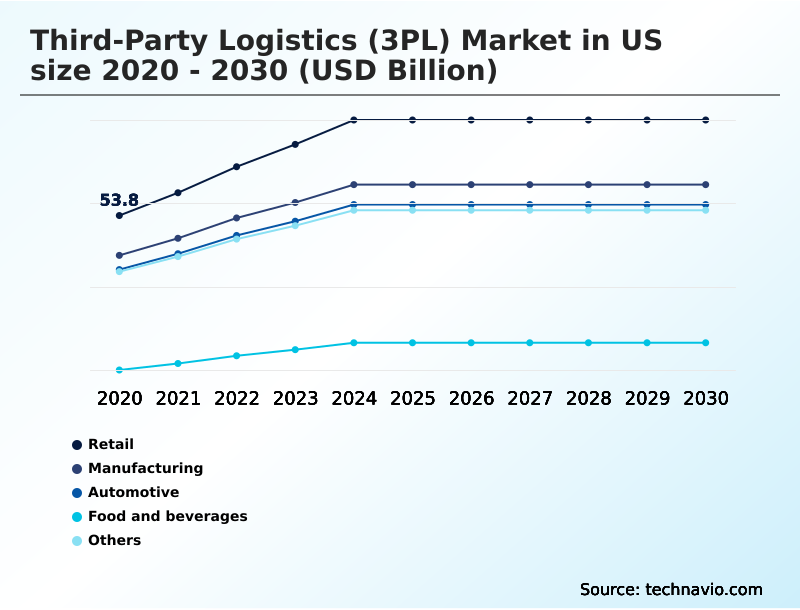
- End-user
- Retail
- Manufacturing
- Automotive
- Food and beverages
- Others
- Service
- Transportation
- Warehousing and distribution
- Others
- Mode of transportation
- Roadways
- Railways
- Waterways
- Airways
- Geography
- North America
- US
- North America
By End-user Insights
The retail segment is estimated to witness significant growth during the forecast period.
The retail sector increasingly relies on outsourced logistics services for comprehensive supply chain optimization. Providers deliver integrated supply chain solutions that facilitate everything from initial fulfillment to complex reverse logistics.
Effective inventory management is crucial, with leading retailers reducing stockouts by 15% through enhanced visibility. Operations are streamlined using techniques like cross-docking to accelerate product flow and reduce storage time.
Many retailers engage providers for dedicated contract services and specialized value-added services such as kitting and custom packaging.
Advanced firms are now using digital twin simulation to model and refine their end-to-end logistics management, ensuring resilience and efficiency in a competitive landscape where final mile delivery optimization and services like food safety tracking are paramount.
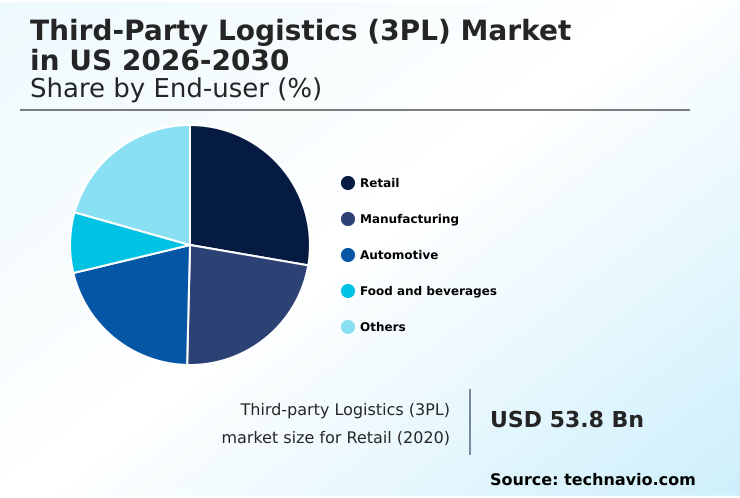
The Retail segment was valued at USD 77.3 billion in 2024 and showed a gradual increase during the forecast period.
Market Dynamics
Our researchers analyzed the data with 2025 as the base year, along with the key drivers, trends, and challenges. A holistic analysis of drivers will help companies refine their marketing strategies to gain a competitive advantage.
- Businesses evaluating the cost of third party logistics are discovering that the benefits of outsourcing warehouse management extend far beyond simple savings. For a 3pl provider for small business, the ability to scale operations without massive capital outlay is a primary advantage.
- The process of automating fulfillment for e-commerce has become a core competency, addressing the key challenges in last mile delivery. In today's volatile environment, improving supply chain resilience is a strategic imperative, where the role of 3pl in manufacturing is pivotal for just-in-time production. This is especially true for sectors managing cold chain compliance, where specialized expertise is non-negotiable.
- The evolution of technology in freight brokerage services now provides unprecedented transparency. When comparing intermodal vs over the road, providers can optimize for both cost and speed. Leading 3pl solutions for retail industry integrate real time visibility in logistics, a feature that has been shown to reduce stockouts more effectively than traditional methods.
- When optimizing less than truckload shipping, providers consolidate freight to lower costs. Addressing the impact of driver shortages on 3pl operations requires innovative retention and technology strategies. For those looking to reduce transportation costs with 3pl, the answer often lies in network optimization.
- It is crucial to consider 3pl cybersecurity best practices and understand how to choose a 3pl partner that aligns with strategic goals, such as implementing sustainable logistics practices. Expertise in navigating customs with a 3pl is vital for global trade, as is understanding the unique needs of the 3pl services for automotive supply chain.
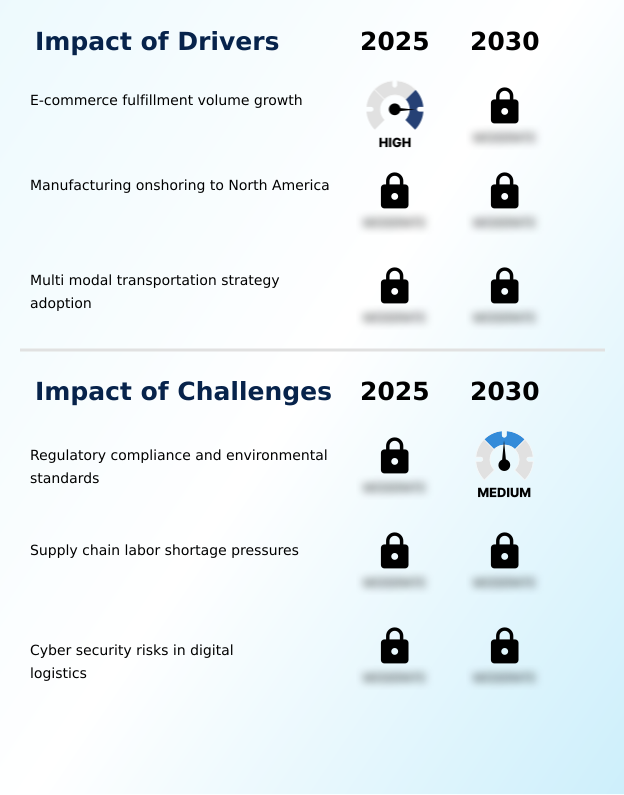
What are the key market drivers leading to the rise in the adoption of US Third-party Logistics (3PL) Industry?
- The significant growth in e-commerce fulfillment volumes is the primary driver for the market, demanding more sophisticated and rapid distribution strategies.
- The relentless expansion of e-commerce fulfillment is a primary market catalyst, compelling providers to master high-velocity fulfillment and complex omnichannel fulfillment models.
- This surge has increased demand for same-day last mile delivery by over 50% in key metro areas, driving investment in urban logistics hubs.
- Concurrently, the rise of onshoring manufacturing logistics stimulates demand for efficient domestic freight movements and agile production logistics. To manage this complexity, firms leverage sophisticated transportation management systems (TMS) and advanced route planning software.
- These tools are critical for optimizing a multimodal transport strategy that effectively blends intermodal transportation with truck-based order fulfillment, reducing fuel consumption by as much as 15%.
What are the market trends shaping the US Third-party Logistics (3PL) Industry?
- The adoption of autonomous robotics in warehouse operations is a transformative market trend. These systems are enhancing productivity and efficiency in sorting and picking processes.
- The evolution of smart warehouse technology is reshaping logistics, with autonomous mobile robots and automated sorting systems becoming standard. These technologies integrate with advanced warehouse management systems to improve fulfillment speeds by over 25%.
- The adoption of robotic process automation (RPA) and generative AI tools facilitates freight rate automation and streamlines automated payment processing, reducing manual data entry by up to 90%. Furthermore, predictive pricing models and comprehensive digital freight management platforms enhance logistics network visibility.
- This enables better carrier performance monitoring and provides shippers with real-time tracking from origin to destination, creating a more transparent and efficient ecosystem.
What challenges does the US Third-party Logistics (3PL) Industry face during its growth?
- Navigating complex regulatory compliance and adhering to evolving environmental standards presents a significant challenge to industry growth and operational costs.
- Providers face significant headwinds from stringent regulations and persistent cybersecurity risks. The mandate for electronic logging devices (ELDs) and the push toward green logistics initiatives—including the adoption of zero-emission vehicles—require substantial updates to fleet management solutions, with initial capital expenditure rising by over 20%.
- Firms must also enhance asset management protocols to ensure secure freight transport, especially as cyber incidents in the sector increased 40% last year. To counter this, some are exploring blockchain for logistics for greater transparency. A contract logistics provider must also navigate complex cross-border logistics management, often requiring specialized supply chain consulting to build a resilient supply chain design.
Exclusive Technavio Analysis on Customer Landscape
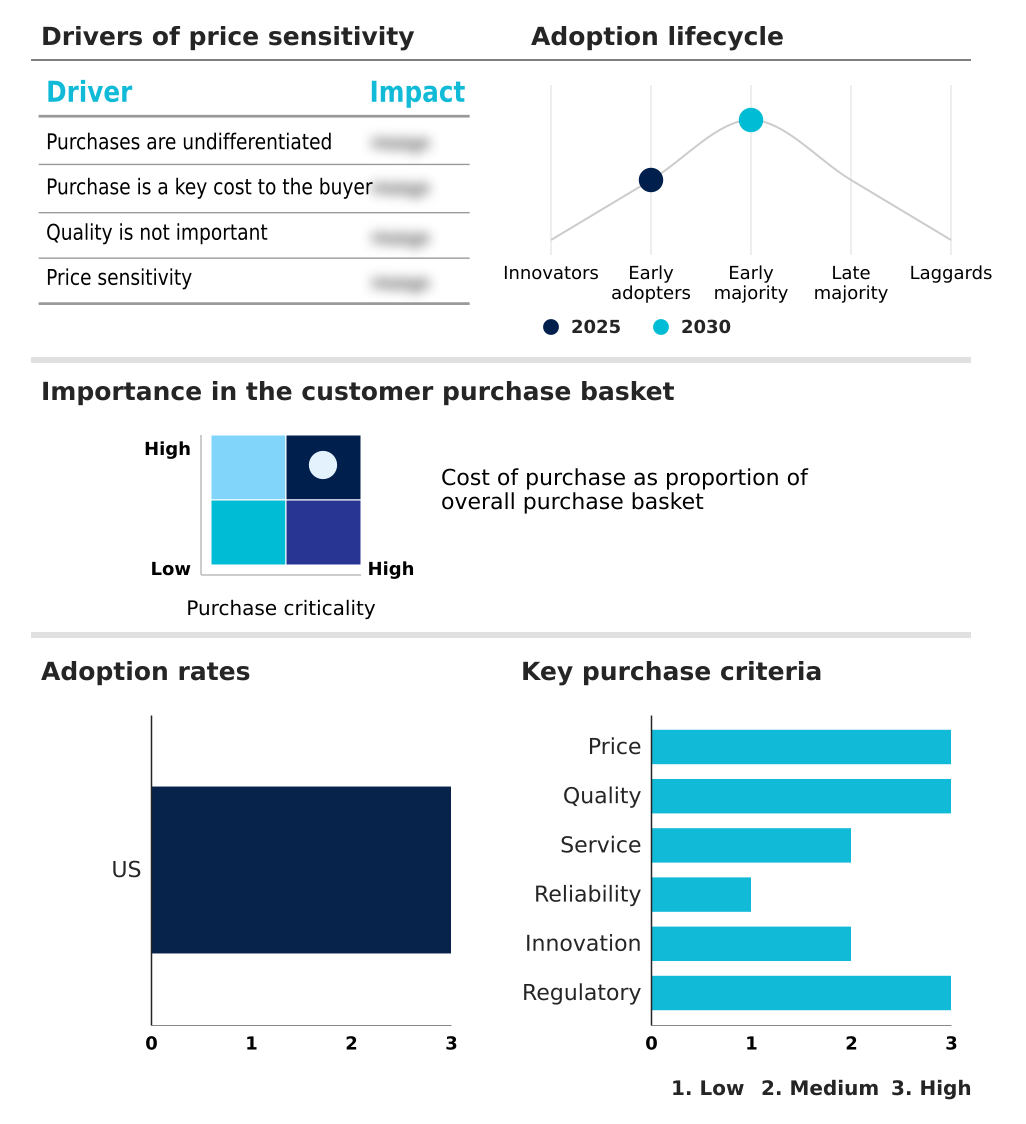
The us third-party logistics (3pl) market forecasting report includes the adoption lifecycle of the market, covering from the innovator’s stage to the laggard’s stage. It focuses on adoption rates in different regions based on penetration. Furthermore, the us third-party logistics (3pl) market report also includes key purchase criteria and drivers of price sensitivity to help companies evaluate and develop their market growth analysis strategies.
Customer Landscape of US Third-party Logistics (3PL) Industry
Competitive Landscape
Companies are implementing various strategies, such as strategic alliances, us third-party logistics (3pl) market forecast, partnerships, mergers and acquisitions, geographical expansion, and product/service launches, to enhance their presence in the industry.
Americold Realty Trust Inc. - Specialized temperature-controlled warehousing and cold chain logistics ensuring product integrity for sensitive goods through integrated supply chain solutions.
The industry research and growth report includes detailed analyses of the competitive landscape of the market and information about key companies, including:
- Americold Realty Trust Inc.
- Burris Logistics Co.
- C H Robinson Worldwide Inc.
- DHL International GmbH
- Expeditors International Inc.
- FedEx Corp.
- Hub Group Inc.
- JB Hunt Transport Services
- Kenco Group Inc.
- Kuehne Nagel Management AG
- M and W Logistics Group Inc.
- NFI Industries Inc.
- Rhenus SE and Co. KG
- Ryder System Inc.
- Taylor Logistics Inc.
- Total Quality Logistics LLC
- United Parcel Service Inc.
- Wagner Logistics Inc.
- XPO Inc.
Qualitative and quantitative analysis of companies has been conducted to help clients understand the wider business environment as well as the strengths and weaknesses of key industry players. Data is qualitatively analyzed to categorize companies as pure play, category-focused, industry-focused, and diversified; it is quantitatively analyzed to categorize companies as dominant, leading, strong, tentative, and weak.
Recent Development and News in Us third-party logistics (3pl) market
- In August, 2024, Crete Carrier Corp. announced the addition of several electric heavy duty tractors to its fleet to evaluate their efficiency in regional delivery routes.
- In August, 2024, FedEx Corp. expanded its automated sorting and handling capabilities at its major air hubs to improve the efficiency and speed of its express parcel operations.
- In September, 2024, Blu Logistics introduced a new training and technology platform to help its cross-border teams manage higher shipment volumes more efficiently.
- In October, 2024, United Parcel Service Inc. opened a new automated facility to enhance its small package processing capacity for retail and healthcare customers.
Dive into Technavio’s robust research methodology, blending expert interviews, extensive data synthesis, and validated models for unparalleled US Third-party Logistics (3PL) Market insights. See full methodology.
| Market Scope | |
|---|---|
| Page number | 198 |
| Base year | 2025 |
| Historic period | 2020-2024 |
| Forecast period | 2026-2030 |
| Growth momentum & CAGR | Accelerate at a CAGR of 8.4% |
| Market growth 2026-2030 | USD 146.8 billion |
| Market structure | Fragmented |
| YoY growth 2025-2026(%) | 8.0% |
| Key countries | US |
| Competitive landscape | Leading Companies, Market Positioning of Companies, Competitive Strategies, and Industry Risks |
Research Analyst Overview
- The market is defined by the strategic integration of advanced technologies to achieve new levels of supply chain optimization. Core operations like e-commerce fulfillment and order fulfillment are being transformed by automated sorting systems and autonomous mobile robots.
- In a key boardroom consideration, companies leveraging transportation management systems (TMS) with integrated route planning software have demonstrated a 15% reduction in fuel costs, directly impacting profitability. The complexity of modern logistics demands sophisticated fleet management solutions and robust asset management protocols.
- Services now span everything from less-than-truckload (LTL) and full truckload (FTL) shipping to specialized intermodal transportation, drayage services, and customs brokerage. Key trends include the use of digital freight matching and predictive pricing models within freight brokerage. Generative AI tools and robotic process automation (RPA) are streamlining operations, while technologies like digital twin simulation and blockchain for logistics promise greater resilience.
- The necessity of cold chain logistics and temperature-controlled warehousing continues to grow, alongside a focus on efficient reverse logistics, cross-docking, and comprehensive inventory management. Providers also offer vital supply chain consulting and adhere to strict standards, including compliance with electronic logging devices (ELDs) and the transition toward zero-emission vehicles.
What are the Key Data Covered in this US Third-party Logistics (3PL) Market Research and Growth Report?
-
What is the expected growth of the US Third-party Logistics (3PL) Market between 2026 and 2030?
-
USD 146.8 billion, at a CAGR of 8.4%
-
-
What segmentation does the market report cover?
-
The report is segmented by End-user (Retail, Manufacturing, Automotive, Food and beverages, and Others), Service (Transportation, Warehousing and distribution, and Others), Mode of Transportation (Roadways, Railways, Waterways, and Airways) and Geography (North America)
-
-
Which regions are analyzed in the report?
-
North America
-
-
What are the key growth drivers and market challenges?
-
E-commerce fulfillment volume growth, Regulatory compliance and environmental standards
-
-
Who are the major players in the US Third-party Logistics (3PL) Market?
-
Americold Realty Trust Inc., Burris Logistics Co., C H Robinson Worldwide Inc., DHL International GmbH, Expeditors International Inc., FedEx Corp., Hub Group Inc., JB Hunt Transport Services, Kenco Group Inc., Kuehne Nagel Management AG, M and W Logistics Group Inc., NFI Industries Inc., Rhenus SE and Co. KG, Ryder System Inc., Taylor Logistics Inc., Total Quality Logistics LLC, United Parcel Service Inc., Wagner Logistics Inc. and XPO Inc.
-
Market Research Insights
- The market is characterized by a shift toward fully integrated supply chain solutions and end-to-end logistics management. Providers are moving beyond basic transport to offer outsourced logistics services that drive strategic value.
- For example, implementing smart warehouse technology has been shown to boost high-velocity fulfillment speeds by up to 30%, while robust carrier performance monitoring can reduce shipping errors by 15%. The growth of omnichannel fulfillment models is driving investments in urban logistics hubs for faster final mile delivery optimization.
- Specializations like white-glove delivery services and stringent food safety tracking are becoming key differentiators. The adoption of digital freight management platforms is enhancing logistics network visibility, enabling more agile production logistics and improving port drayage efficiency. These advancements support trends like onshoring manufacturing logistics and create a more resilient supply chain design.
We can help! Our analysts can customize this us third-party logistics (3pl) market research report to meet your requirements.
 RIA -
RIA - 
