India Third-party Logistics Market Size 2026-2030
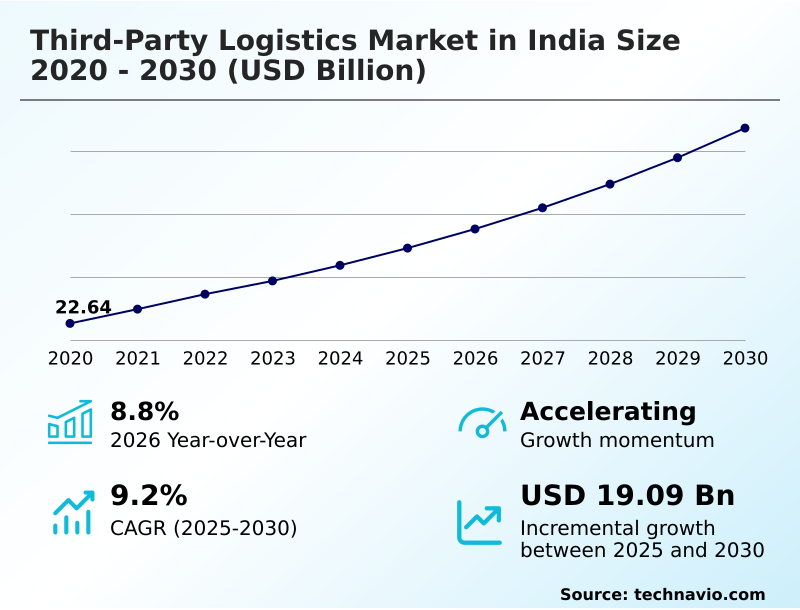
The india third-party logistics market size is valued to increase by USD 19.09 billion, at a CAGR of 9.2% from 2025 to 2030. Growth of E-commerce sector will drive the india third-party logistics market.
Major Market Trends & Insights
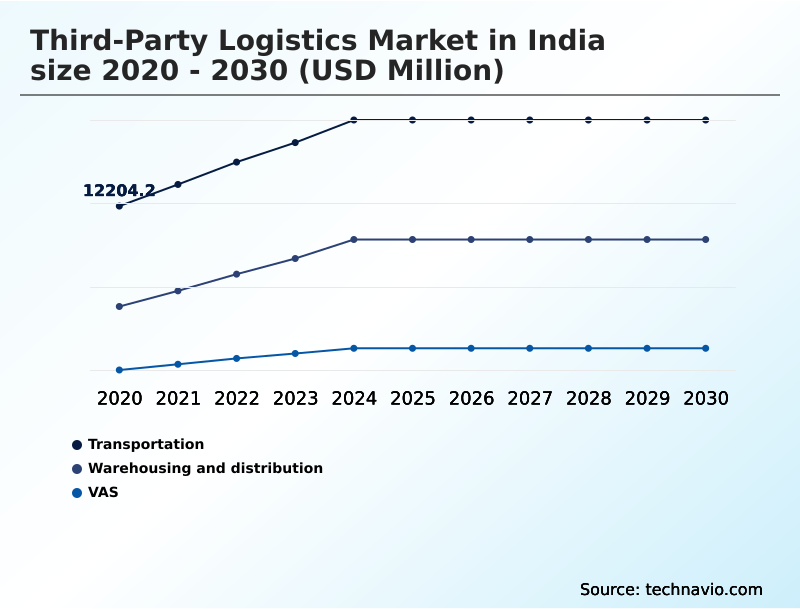
- By Service - Transportation segment was valued at USD 16.75 billion in 2024
- By End-user - Manufacturing segment accounted for the largest market revenue share in 2024
Market Size & Forecast
- Market Opportunities: USD 31.07 billion
- Market Future Opportunities: USD 19.09 billion
- CAGR from 2025 to 2030 : 9.2%
Market Summary
- The third-party logistics market in India is undergoing a significant transformation, driven by robust economic expansion and the increasing strategic imperative for businesses to outsource supply chain functions. Organizations across manufacturing and retail are leveraging 3PL partnerships to enhance operational efficiency, reduce capital expenditure on non-core assets, and access specialized logistical networks.
- A key catalyst is the exponential growth of e-commerce, which demands sophisticated solutions for warehousing, inventory management, and last-mile delivery. For instance, a direct-to-consumer brand can partner with a 3PL provider to manage its entire order-to-delivery lifecycle, enabling it to meet consumer expectations for rapid fulfillment without building an in-house logistics infrastructure.
- This allows the brand to focus on core competencies like product development and marketing. Concurrently, supportive government policies and substantial infrastructure investments are creating a more streamlined operating environment, fostering deeper technology integration. The market is defined by a shift toward integrated, value-added services, where providers act as strategic collaborators, using technology to deliver smarter and more resilient supply chains.
What will be the Size of the India Third-party Logistics Market during the forecast period?
Get Key Insights on Market Forecast (PDF) Get Free Sample
How is the India Third-party Logistics Market Segmented?
The india third-party logistics industry research report provides comprehensive data (region-wise segment analysis), with forecasts and estimates in "USD million" for the period 2026-2030, as well as historical data from 2020-2024 for the following segments.
- Service
- Transportation
- Warehousing and distribution
- VAS
- End-user
- Manufacturing
- Consumer goods
- Food and beverage
- Automotive
- Others
- Mode of transportation
- Land transportation
- Sea transportation
- Air transportation
- Geography
- APAC
- India
- APAC
By Service Insights
The transportation segment is estimated to witness significant growth during the forecast period.
The transportation segment is the largest component of the third-party logistics market in India, connecting manufacturing hubs to consumption centers. Its growth is shaped by government-led infrastructure development, including dedicated freight corridors that enhance the viability of multi-modal transportation.
A third-party logistics (3PL) provider leverages these upgrades for more reliable services. The rise of e-commerce drives demand for sophisticated last-mile and first-mile capabilities, requiring agile, tech-driven models that achieve higher operational efficiency.
Widespread implementation of transportation management systems and route optimization software improves on-time delivery rates by over 12%.
The adoption of digital freight aggregation platforms is formalizing the industry, improving asset use and enabling just-in-time inventory strategies while providing greater supply chain visibility.
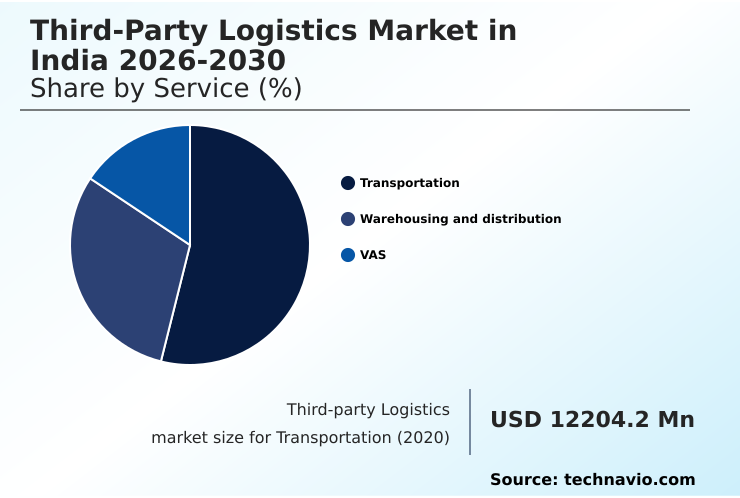
The Transportation segment was valued at USD 16.75 billion in 2024 and showed a gradual increase during the forecast period.
Market Dynamics
Our researchers analyzed the data with 2025 as the base year, along with the key drivers, trends, and challenges. A holistic analysis of drivers will help companies refine their marketing strategies to gain a competitive advantage.
- The strategic importance of third-party logistics is becoming increasingly evident across various sectors. The benefits of integrated logistics services are particularly clear for businesses seeking end-to-end supply chain management solutions. In manufacturing, outsourced logistics for manufacturing sector helps streamline operations, while the third-party logistics for automotive components is critical for just-in-time production.
- Similarly, the role of 3PL in consumer goods distribution and third-party logistics for food and beverage highlights the need for specialized handling and efficient distribution networks. The primary growth drivers for 3PL in India include the boom in e-commerce, which fuels technology adoption in e-commerce logistics and the need for improving last-mile delivery efficiency.
- Managing reverse logistics for retail has also become a key differentiator. The impact of IoT on supply chain visibility and the use of warehouse automation solutions for 3PL are addressing these demands. Businesses are also focused on cost reduction in freight management by optimizing transportation with TMS software.
- However, challenges in cold chain supply management persist, making 3PL services for pharmaceutical industry a highly specialized field. The expansion of cross-border e-commerce logistics solutions and the rising demand for VAS in third-party logistics create new opportunities.
- Ultimately, the third-party logistics market in India 2026-2030 services are evolving to meet these diverse needs, with firms that master sustainable practices in warehousing operations gaining a competitive advantage over those that do not, leading to a notable difference in client retention rates.
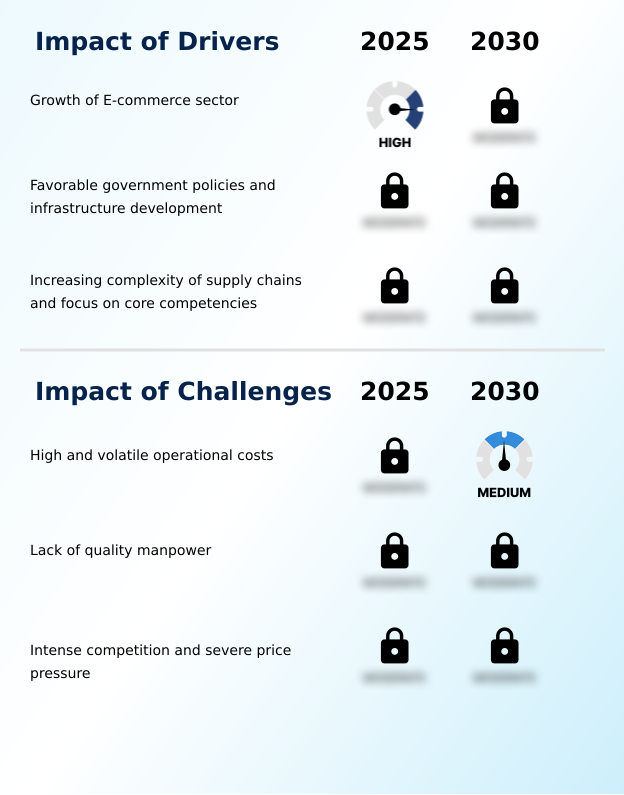
What are the key market drivers leading to the rise in the adoption of India Third-party Logistics Industry?
- The significant growth of the e-commerce sector serves as a key driver for the third-party logistics market in India.
- The rapid proliferation of e-commerce is a primary driver for the market, creating immense demand for efficient e-commerce fulfillment and scalable logistics. This has spurred partnerships where 3PLs manage the entire order-to-delivery cycle.
- Concurrently, government reforms and infrastructure development are creating a more favorable operating environment. These initiatives support complex contract logistics and enable businesses to consolidate warehousing, fueling demand for organized providers.
- For example, streamlined customs brokerage has reduced cross-border clearance times by up to 20%. The increasing complexity of supply chains compels companies to outsource functions like freight forwarding and adopt lean manufacturing logistics.
- By leveraging an asset-light logistics model, firms convert fixed costs into variable expenses, improving capital allocation by 15%, while using freight consolidation to optimize shipments.
What are the market trends shaping the India Third-party Logistics Industry?
- The accelerated adoption of technology and digitalization is a primary trend reshaping the market. This shift fundamentally alters operational models and enhances service delivery expectations.
- The third-party logistics market in India is evolving beyond transactional services toward comprehensive, integrated supply chain solutions. Leading providers are expanding their portfolios to include sophisticated value-added services and complex order fulfillment. A crucial growth area is reverse logistics, where providers offering robust solutions for returns management gain a competitive edge.
- The adoption of green logistics practices is also accelerating, with a focus on sustainable warehousing and fleet modernization. Advanced technologies are central to this transformation; deploying internet of things (iot) sensors for real-time tracking of shipments in cold chain logistics has improved product integrity by 25%.
- Furthermore, the use of predictive analytics for demand forecasting enhances inventory accuracy by up to 18%, while robotic process automation (rpa) in warehouses streamlines last-mile delivery preparation, supporting the expansive parcel distribution network.
What challenges does the India Third-party Logistics Industry face during its growth?
- High and volatile operational costs present a significant challenge affecting the industry's profitability and sustainable growth.
- High and volatile operational costs, driven by fluctuating fuel prices and rising real estate expenses, constrain profitability in the third-party logistics market in India. These pressures limit investment in technology and infrastructure upgrades like warehouse automation. A structural scarcity of skilled manpower, from drivers to managers proficient in supply chain optimization, further hampers growth.
- This talent deficit acts as a barrier to adopting advanced fleet management systems, with a recent survey indicating that 40% of firms cite a lack of trained personnel as a key challenge. Intense price-based competition from a fragmented market of unorganized players also erodes margins, discouraging innovation in specialized handling and services for time-sensitive shipments.
- This commoditization cycle restricts the financial capacity of firms to invest in critical areas like advanced in-plant logistics or obtaining comprehensive cargo insurance, ultimately stifling the market's evolution toward value-driven solutions.
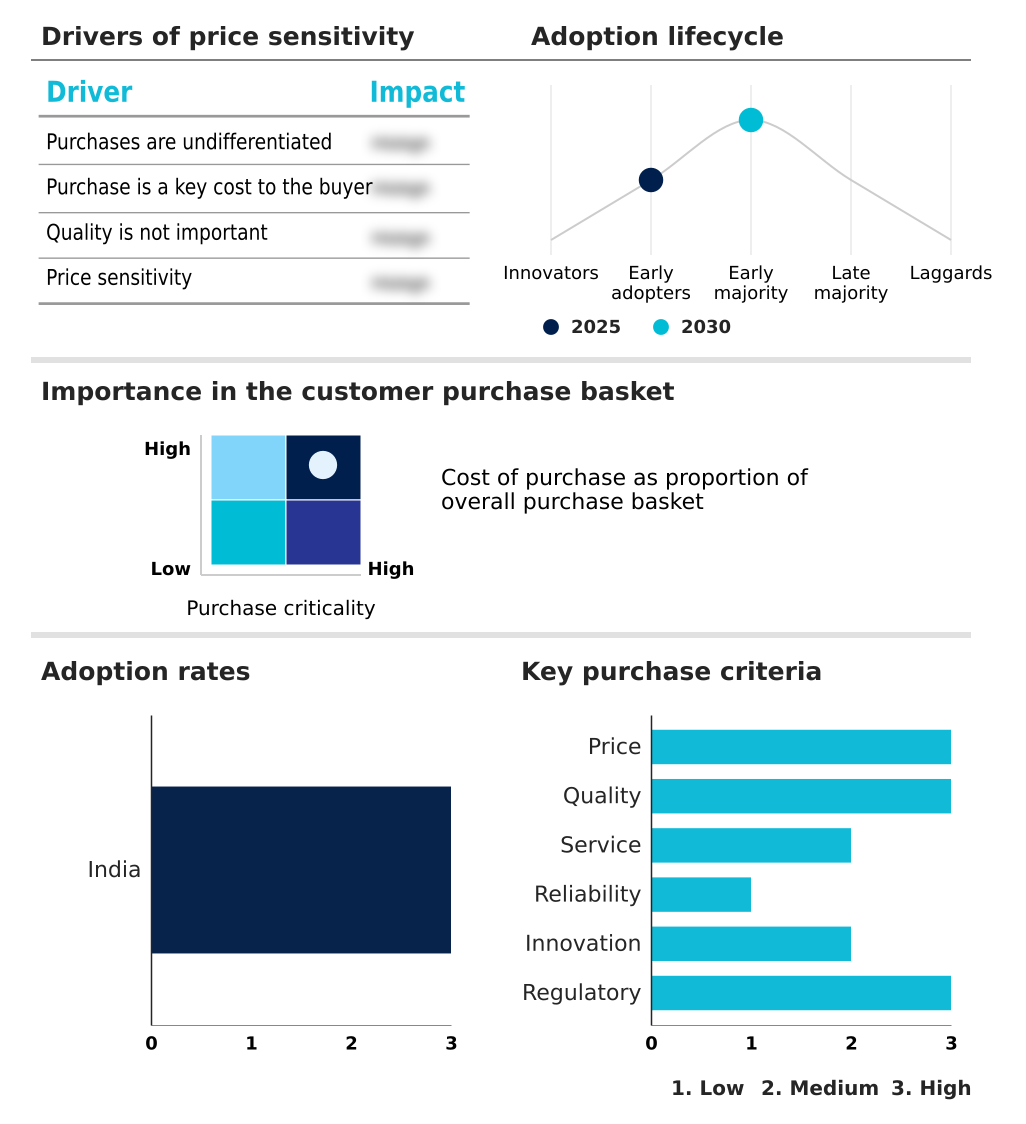
Exclusive Technavio Analysis on Customer Landscape
The india third-party logistics market forecasting report includes the adoption lifecycle of the market, covering from the innovator’s stage to the laggard’s stage. It focuses on adoption rates in different regions based on penetration. Furthermore, the india third-party logistics market report also includes key purchase criteria and drivers of price sensitivity to help companies evaluate and develop their market growth analysis strategies.
Customer Landscape of India Third-party Logistics Industry
Competitive Landscape
Companies are implementing various strategies, such as strategic alliances, india third-party logistics market forecast, partnerships, mergers and acquisitions, geographical expansion, and product/service launches, to enhance their presence in the industry.
AWL India Pvt. Ltd. - Delivering integrated supply chain solutions, from transportation and warehousing to value-added services, tailored for complex and scalable logistics requirements across diverse industries.
The industry research and growth report includes detailed analyses of the competitive landscape of the market and information about key companies, including:
- AWL India Pvt. Ltd.
- Busybees Logistics Solutions
- CJ Darcl Logistics Ltd.
- CMA CGM Group
- Delhivery Ltd.
- DHL International GmbH
- DTDC Express Ltd.
- FedEx Corp.
- Instakart Services Pvt Ltd
- KD Logistics
- Kuehne Nagel Management AG
- Mahindra Logistics Ltd.
- NimbusPost Pvt Ltd
- Nippon Express Holdings Inc.
- Parekh Integrated Services Ltd
- Safexpress Pvt. Ltd.
- Schenker AG
- SF Express Co. Ltd.
- TVS Supply Chain Solutions
- WareIQ Pvt. Ltd.
Qualitative and quantitative analysis of companies has been conducted to help clients understand the wider business environment as well as the strengths and weaknesses of key industry players. Data is qualitatively analyzed to categorize companies as pure play, category-focused, industry-focused, and diversified; it is quantitatively analyzed to categorize companies as dominant, leading, strong, tentative, and weak.
Recent Development and News in India third-party logistics market
- In April 2025, Delhivery Ltd. finalized its acquisition of Ecom Express in a USD 170 million deal, creating India's largest express delivery network by parcel volume.
- In March 2025, Mahindra Logistics Ltd. expanded its Eastern India presence by launching two Grade-A warehouses in Guwahati and Agartala, adding over 400,000 sq. ft. of modern warehousing capacity.
- In January 2025, Blue Dart Express Ltd. unveiled a major automated logistics hub in Delhi, featuring a daily handling capacity of 50,000 shipments to boost service efficiency in North India.
- In April 2025, Mahindra Logistics Ltd. continued its strategic expansion by securing large warehousing facilities in Siddipet, Telangana, and near Pune and Kolkata, strengthening its national distribution network.
Dive into Technavio’s robust research methodology, blending expert interviews, extensive data synthesis, and validated models for unparalleled India Third-party Logistics Market insights. See full methodology.
| Market Scope | |
|---|---|
| Page number | 193 |
| Base year | 2025 |
| Historic period | 2020-2024 |
| Forecast period | 2026-2030 |
| Growth momentum & CAGR | Accelerate at a CAGR of 9.2% |
| Market growth 2026-2030 | USD 19088.2 million |
| Market structure | Fragmented |
| YoY growth 2025-2026(%) | 8.8% |
| Key countries | India |
| Competitive landscape | Leading Companies, Market Positioning of Companies, Competitive Strategies, and Industry Risks |
Research Analyst Overview
- The third-party logistics market in India is advancing through significant technological integration and service expansion. Companies are moving beyond basic offerings to provide integrated supply chain solutions, which encompass everything from initial freight forwarding and customs brokerage to complex contract logistics.
- A central theme is supply chain optimization, where the deployment of warehouse management systems and transportation management systems is foundational. For boardroom decisions, the ROI on such technology is clear; firms using predictive analytics for demand have seen forecast accuracy improve by over 20%. The landscape includes specialized services like cold chain logistics, in-plant logistics, and yard management.
- Core operations such as order fulfillment and inventory management are being refined through innovations in cross-docking and efficient fleet management. The growth in e-commerce fulfillment is also driving demand for advanced last-mile delivery and reverse logistics capabilities. To compete, firms are offering value-added services (VAS) and exploring models like lead logistics provider (4PL).
- This evolution is supported by new tools like digital freight aggregation and route optimization software, promoting sustainable warehousing and efficient multi-modal transportation.
What are the Key Data Covered in this India Third-party Logistics Market Research and Growth Report?
-
What is the expected growth of the India Third-party Logistics Market between 2026 and 2030?
-
USD 19.09 billion, at a CAGR of 9.2%
-
-
What segmentation does the market report cover?
-
The report is segmented by Service (Transportation, Warehousing and distribution, and VAS), End-user (Manufacturing, Consumer goods, Food and beverage, Automotive, and Others), Mode of Transportation (Land transportation, Sea transportation, and Air transportation) and Geography (APAC)
-
-
Which regions are analyzed in the report?
-
APAC
-
-
What are the key growth drivers and market challenges?
-
Growth of E-commerce sector, High and volatile operational costs
-
-
Who are the major players in the India Third-party Logistics Market?
-
AWL India Pvt. Ltd., Busybees Logistics Solutions, CJ Darcl Logistics Ltd., CMA CGM Group, Delhivery Ltd., DHL International GmbH, DTDC Express Ltd., FedEx Corp., Instakart Services Pvt Ltd, KD Logistics, Kuehne Nagel Management AG, Mahindra Logistics Ltd., NimbusPost Pvt Ltd, Nippon Express Holdings Inc., Parekh Integrated Services Ltd, Safexpress Pvt. Ltd., Schenker AG, SF Express Co. Ltd., TVS Supply Chain Solutions and WareIQ Pvt. Ltd.
-
Market Research Insights
- The market is characterized by a strategic shift toward outsourcing to enhance operational efficiency and focus on core competencies. A third-party logistics (3PL) provider enables businesses to implement just-in-time inventory models, with some firms achieving a 20% reduction in carrying costs.
- The e-commerce boom necessitates agile e-commerce fulfillment and an expansive parcel distribution network, where real-time tracking has improved on-time delivery rates by over 15%. Growing demand for specialized handling in sectors like automotive and pharmaceuticals drives the need for sophisticated aftermarket logistics and stringent temperature controls.
- Furthermore, an increasing emphasis on green logistics practices and robust customs compliance is reshaping service offerings, compelling providers to invest in sustainable solutions and advanced trade facilitation expertise to remain competitive.
We can help! Our analysts can customize this india third-party logistics market research report to meet your requirements.
 RIA -
RIA - 
