
Third-party Logistics (3PL) Market Analysis, Size, and Forecast 2026-2030: APAC (China, Japan, and India), North America (US, Canada, and Mexico), Europe (Germany, UK, and France), South America (Brazil, Argentina, and Chile), Middle East and Africa (Saudi Arabia, UAE, and South Africa), and Rest of World (ROW)

Third-party Logistics (3PL) Market Analysis, Size, and Forecast 2026-2030:
APAC (China, Japan, and India), North America (US, Canada, and Mexico), Europe (Germany, UK, and France), South America (Brazil, Argentina, and Chile), Middle East and Africa (Saudi Arabia, UAE, and South Africa), and Rest of World (ROW)

Published: Oct 2026 319 Pages SKU: IRTNTR45655

Market Overview at a Glance

$733.6 B
Market Opportunity
8.6%
CAGR 2025 - 2030
44%
APAC Growth
$520.4 B
Transportation services segment 2024

Third-Party Logistics (3Pl) Market Size 2026-2030

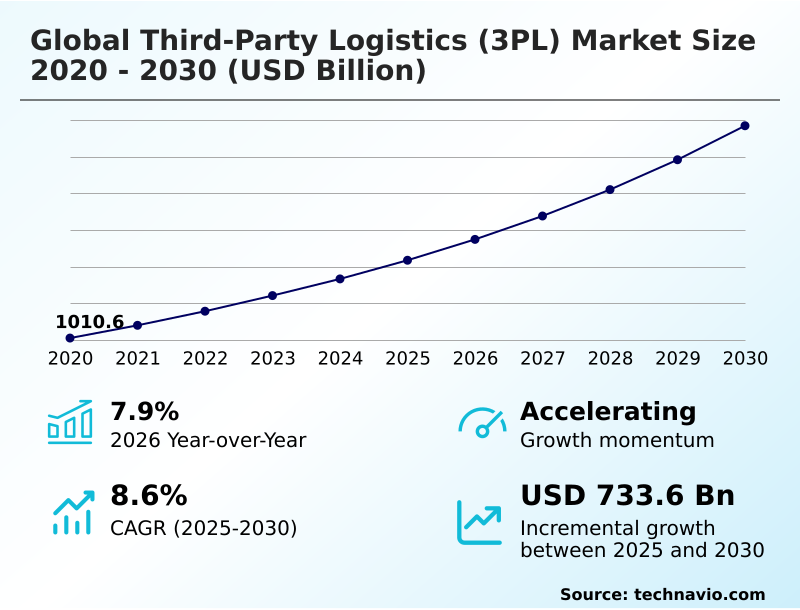
The third-party logistics (3pl) market size is valued to increase by USD 733.6 billion, at a CAGR of 8.6% from 2025 to 2030. Rapid expansion of global digital commerce will drive the third-party logistics (3pl) market.

Major Market Trends & Insights

  • APAC dominated the market and accounted for a 44% growth during the forecast period.
  • By Application - Transportation services segment was valued at USD 520.4 billion in 2024
  • By End-user - Manufacturing segment accounted for the largest market revenue share in 2024

Market Size & Forecast

  • Market Opportunities: USD 1158 billion
  • Market Future Opportunities: USD 733.6 billion
  • CAGR from 2025 to 2030 : 8.6%

Market Summary

  • The Third-party Logistics (3PL) Market exhibits robust momentum as commercial enterprises increasingly outsource complex supply chain operations to specialized intermediaries. A defining catalyst for this shift is the rapid expansion of digital commerce, which compels retailers to deploy an omni-channel distribution network to manage immense volumes of individualized parcels.
  • To support this volume, businesses are integrating an automated storage and retrieval system to optimize inventory staging, accelerating warehouse throughput by up to 35% compared to manual handling methods.
  • In a practical supply chain scenario, a major retailer leveraging dynamic route optimization can dynamically reroute autonomous mobile robotics within distribution hubs, thereby neutralizing seasonal peak disruptions and significantly lowering final-mile delivery costs. However, severe labor shortages in the commercial transport sector challenge operational consistency, directly causing inflated wage expenditures that compress overall profit margins.
  • As organizations navigate these constraints, the strategic adoption of predictive inventory analytics and an internet of things shipment tracking framework ensures high-velocity order processing while maintaining stringent regulatory compliance across international borders.

What will be the Size of the Third-Party Logistics (3Pl) Market during the forecast period?
Get Key Insights on Market Forecast (PDF) Get Free Sample

How is the Third-Party Logistics (3Pl) Market Segmented?

The third-party logistics (3pl) industry research report provides comprehensive data (region-wise segment analysis), with forecasts and estimates in "USD billion" for the period 2026-2030, as well as historical data from 2020-2024 for the following segments.

  • Application
    • Transportation services
    • Warehousing and distribution services
    • Others
  • End-user
    • Manufacturing
    • Retail
    • Consumer goods
    • Healthcare
    • Others
  • Mode of transportation
    • Roadways
    • Seaways
    • Railways
    • Airways
    • Multimodal transport
  • Geography
    • APAC
      • China
      • Japan
      • India
      • South Korea
      • Australia
      • Indonesia
    • North America
      • US
      • Canada
      • Mexico
    • Europe
      • Germany
      • UK
      • France
      • Italy
      • Spain
      • The Netherlands
    • South America
      • Brazil
      • Argentina
      • Chile
    • Middle East and Africa
      • Saudi Arabia
      • UAE
      • South Africa
      • Israel
      • Turkey

By Application Insights

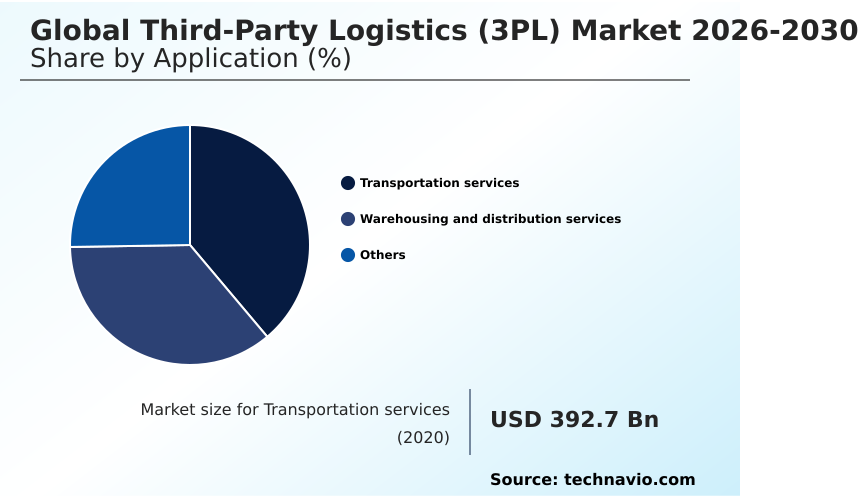
The transportation services segment is estimated to witness significant growth during the forecast period.

The transportation services segment functions as the operational core of the Third-party Logistics (3PL), orchestrating multi-modal transit execution across diverse global supply chains. As enterprises shift toward decentralized distribution models, prioritizing end-to-end cargo visibility becomes essential for maintaining operational agility.

Modern shippers increasingly rely on third-party partners to navigate complex cross-border transit corridors and manage customs brokerage compliance efficiently. The deployment of dynamic route optimization directly enhances fleet utilization, ensuring that intelligent fleet telematics can reduce transit delays.

Statistically, organizations leveraging automated routing experience a 15% reduction in fuel consumption, significantly lowering operational overhead. Furthermore, advanced platforms enable a 20% faster response time to maritime port bottlenecks compared to legacy tracking methods.

This transition from fixed asset ownership to scalable transportation management empowers companies to mitigate macroeconomic friction while accelerating speed-to-market.
Get Free Sample

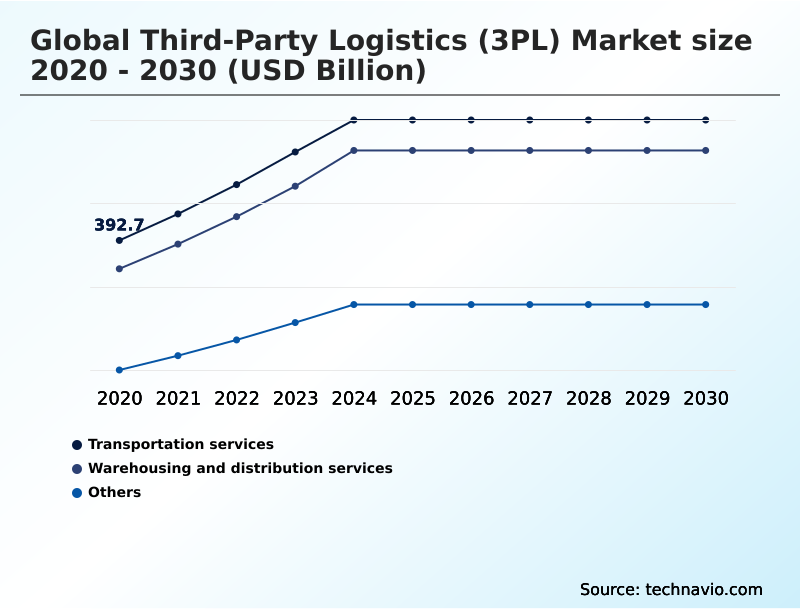
The Transportation services segment was valued at USD 520.4 billion in 2024 and showed a gradual increase during the forecast period.
Get Free Sample

Regional Analysis

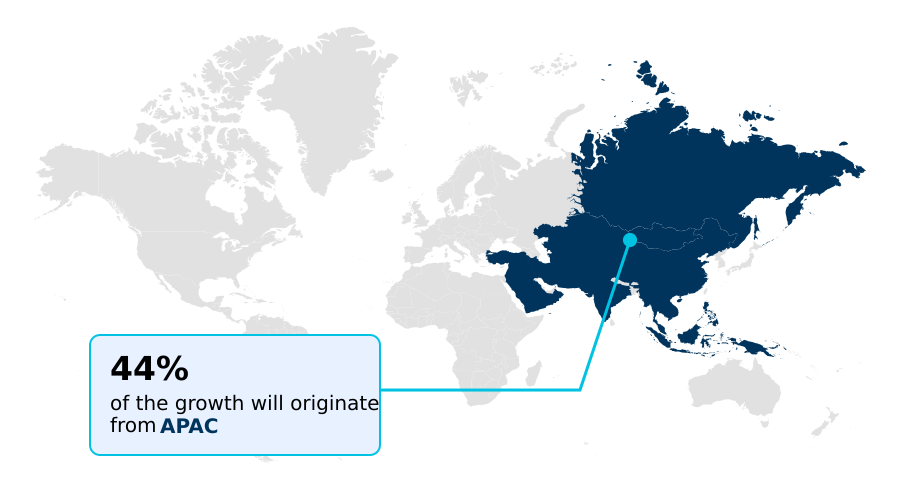
APAC is estimated to contribute 44% to the growth of the global market during the forecast period.Technavio’s analysts have elaborately explained the regional trends and drivers that shape the market during the forecast period.
See How Third-Party Logistics (3Pl) Market Demand is Rising in APAC Get Free Sample

The geographic landscape of the Third-party Logistics (3PL) reveals distinct strategic priorities between the APAC and North America regions.

In APAC, expansive manufacturing ecosystems and aggressive e-commerce penetration drive hyper-local fulfillment, where operators report a 40% higher adoption rate of micro-fulfillment node infrastructure compared to Western markets.

This dense urbanization requires sophisticated reverse logistics management and intelligent fleet telematics to navigate congested transit corridors.

Conversely, North America prioritizes warehouse modernization to counteract acute labor deficits, achieving a 25% improvement in operational throughput through the widespread deployment of automated guided vehicle integration.

While APAC focuses on cross-border transit corridors to support intra-regional trade, North American enterprises heavily invest in supply chain resilience optimization to mitigate nearshoring complexities.

Furthermore, North American facilities demonstrate a 30% greater reliance on ultra-dense vertical storage to offset escalating industrial real estate costs, showcasing how regional economic pressures dictate distinct technological and infrastructural investments.

Market Dynamics

Our researchers analyzed the data with 2025 as the base year, along with the key drivers, trends, and challenges. A holistic analysis of drivers will help companies refine their marketing strategies to gain a competitive advantage.

  • As modern supply chains face unprecedented volatility, the strategic outsourcing of fulfillment operations has become an essential business mandate within the Third-party Logistics (3PL) ecosystem. Organizations are moving away from legacy, fragmented transport models and are prioritizing advanced warehouse management platform integration to achieve real-time visibility across complex distribution nodes.
  • This digital transformation is particularly critical for omnichannel retail order fulfillment execution, where consumer expectations for same-day delivery compel merchants to position inventory closer to metropolitan hubs. Compared to centralized mega-warehouses, localized fulfillment nodes utilizing predictive analytics in freight routing can reduce last-mile delivery transit times by nearly half, optimizing both fleet utilization and customer satisfaction.
  • Furthermore, highly regulated sectors are mandating the deployment of automated cold chain logistics infrastructure to ensure the integrity of temperature-sensitive pharmaceuticals and perishable agricultural exports. Maintaining continuous thermal data streams minimizes product spoilage and significantly lowers financial liability during transit. On an international scale, geopolitical friction and shifting tariff structures demand rigorous cross-border trade compliance management.
  • Third-party logistics providers act as crucial intermediaries, leveraging digital customs interfaces to prevent costly border delays and administrative penalties. By converting fixed capital investments into variable operating costs, enterprise shippers can redirect resources toward core product innovation while relying on specialized logistics partners to orchestrate secure, compliant, and highly responsive global supply networks.
What are the key market drivers leading to the rise in the adoption of Third-Party Logistics (3Pl) Industry?

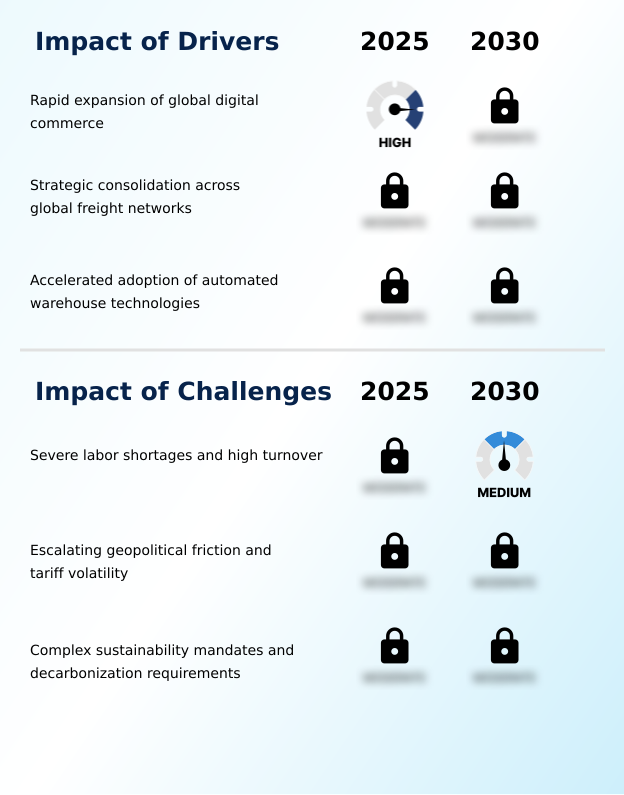
  • The rapid expansion of global digital commerce acts as a primary catalyst, necessitating scalable logistics infrastructure to manage high-volume order processing efficiently.

  • The exponential expansion of digital commerce and global trade complexity serves as a primary driver for the Third-party Logistics (3PL).
  • As manufacturing organizations diversify their sourcing footprints to avoid geographic concentration risks, the necessity for robust customs brokerage compliance and intermodal freight consolidation has intensified.
  • This structural realignment forces enterprises to deploy a digital freight matching algorithm to secure reliable capacity across volatile maritime and overland routes.
  • By leveraging a supply chain orchestration tower, companies can proactively manage disruptions, resulting in a 30% decrease in transit-related downtime and a 15% reduction in excess safety stock requirements.
  • The continuous demand for end-to-end cargo visibility ensures that logistics partners can seamlessly execute just-in-sequence material delivery, optimizing factory assembly lines and preserving profit margins amid fluctuating transport costs.

What are the market trends shaping the Third-Party Logistics (3Pl) Industry?

  • The rapid growth of global omnichannel fulfillment networks has emerged as a definitive market trend. This structural shift compels businesses to implement decentralized distribution models to meet escalating consumer demands.

  • The rapid decentralization of omnichannel retail fulfillment stands as a dominant trend reshaping the Third-party Logistics (3PL). To combat rising final-mile delivery costs, enterprise shippers are migrating away from centralized mega-facilities toward specialized micro-fulfillment node infrastructure located within dense urban perimeters.
  • This strategic pivot is driven by consumer demands for ultra-fast delivery, compelling operators to implement autonomous mobile robotics to accelerate high-velocity order processing. Consequently, early adopters of these localized, automated hubs report a 40% reduction in order processing times and a 25% improvement in last-mile routing efficiency.
  • The integration of predictive inventory analytics further enables businesses to anticipate localized demand spikes, ensuring optimal stock placement. By utilizing automated guided vehicle integration, logistics providers effectively mitigate peak-season labor constraints, ultimately elevating overall supply chain resilience optimization and customer satisfaction.

What challenges does the Third-Party Logistics (3Pl) Industry face during its growth?

  • Persistent severe labor shortages and high employee turnover rates present critical structural challenges, constraining transport capacity and elevating operational overhead across the industry.

  • Acute labor shortages and escalating regulatory sustainability mandates present severe operational hurdles within the Third-party Logistics (3PL). The chronic deficit of qualified commercial drivers and warehouse technicians forces logistics providers to inflate base wages, directly compressing operating margins by up to 18%.
  • To counterbalance this constraint, operators must heavily invest in an automated storage and retrieval system and dynamic route optimization, which require massive upfront capital expenditures. Simultaneously, strict scope three emissions tracking requirements mandate the rapid transition to zero-emission heavy transport fleets. Complying with these environmental directives increases initial fleet acquisition costs by nearly 40% compared to traditional diesel assets.
  • Consequently, balancing the financial burden of adopting sustainable aviation fuel adoption and intelligent fleet telematics against intense pricing competition remains a critical challenge for sustained profitability.

Exclusive Technavio Analysis on Customer Landscape

The third-party logistics (3pl) market forecasting report includes the adoption lifecycle of the market, covering from the innovator’s stage to the laggard’s stage. It focuses on adoption rates in different regions based on penetration. Furthermore, the third-party logistics (3pl) market report also includes key purchase criteria and drivers of price sensitivity to help companies evaluate and develop their market growth analysis strategies.
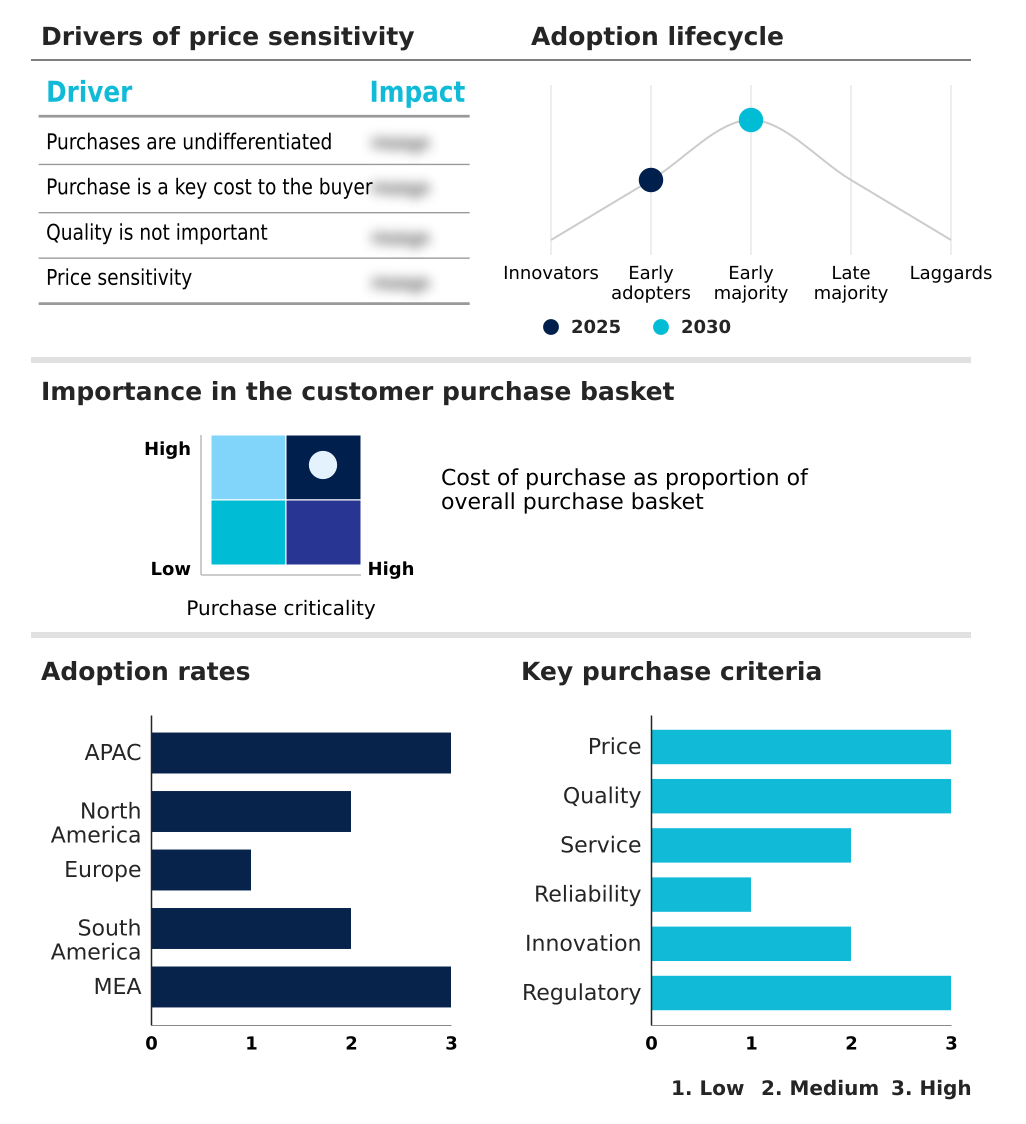
Customer Landscape of Third-Party Logistics (3Pl) Industry

Competitive Landscape

Companies are implementing various strategies, such as strategic alliances, third-party logistics (3pl) market forecast, partnerships, mergers and acquisitions, geographical expansion, and product/service launches, to enhance their presence in the industry.

Americold Realty Trust Inc. - Delivering comprehensive third-party logistics solutions, the focus remains on optimizing omni-channel distribution networks and integrating automated storage and retrieval systems to enhance supply chain resilience optimization and streamline freight forwarding.

The industry research and growth report includes detailed analyses of the competitive landscape of the market and information about key companies, including:

  • Americold Realty Trust Inc.
  • AP Moller Maersk AS
  • Burris Logistics Co.
  • C H Robinson Worldwide Inc.
  • CEVA Logistics SA
  • Dachser SE
  • DB Schenker
  • DHL International GmbH
  • Expeditors International Inc.
  • FedEx Corp.
  • GEODIS
  • Hellmann Worldwide Logistics
  • Hub Group Inc.
  • JB Hunt Transport Services
  • Kenco Group Inc.
  • Kuehne Nagel Management AG
  • M and W Logistics Group Inc.
  • NFI Industries Inc.
  • Ryder System Inc.
  • SF Express Co. Ltd.
  • United Parcel Service Inc.
  • XPO Inc.

Qualitative and quantitative analysis of companies has been conducted to help clients understand the wider business environment as well as the strengths and weaknesses of key industry players. Data is qualitatively analyzed to categorize companies as pure play, category-focused, industry-focused, and diversified; it is quantitatively analyzed to categorize companies as dominant, leading, strong, tentative, and weak.

Recent Development and News in Third-party logistics (3pl) market

  • In the Air Freight and Logistics industry, the stringent implementation of scope three emissions tracking mandates has accelerated the transition toward zero-emission heavy transport, directly impacting Third-party Logistics (3PL) demand by requiring a 40% reduction in fleet carbon footprints across cross-border transit corridors.
  • The widespread commercial deployment of an electronic bill of lading framework has modernized traditional maritime freight handling, enabling a 25% faster automated customs interface clearance process and boosting Third-party Logistics (3PL) reliance on predictive risk management for global shipping.
  • The aggressive scale-up of hyperscale cloud logistics infrastructure has forced air cargo carriers to optimize high-velocity order processing, increasing Third-party Logistics (3PL) adoption of decentralized distribution models to improve last-mile urban delivery speeds by over 30%.
  • Shifting aviation regulatory standards favoring sustainable aviation fuel adoption have fundamentally altered operational cost structures, pushing Third-party Logistics (3PL) providers to integrate scalable warehousing infrastructure and multi-tenant public warehousing solutions to offset a 15% rise in baseline air freight expenditures.

Dive into Technavio’s robust research methodology, blending expert interviews, extensive data synthesis, and validated models for unparalleled Third-Party Logistics (3Pl) Market insights. See full methodology.

Market Scope
Page number 319
Base year 2025
Historic period 2020-2024
Forecast period 2026-2030
Growth momentum & CAGR Accelerate at a CAGR of 8.6%
Market growth 2026-2030 USD 733.6 billion
Market structure Fragmented
YoY growth 2025-2026(%) 7.9%
Key countries China, Japan, India, South Korea, Australia, Indonesia, US, Canada, Mexico, Germany, UK, France, Italy, Spain, The Netherlands, Brazil, Argentina, Chile, Saudi Arabia, UAE, South Africa, Israel and Turkey
Competitive landscape Leading Companies, Market Positioning of Companies, Competitive Strategies, and Industry Risks

Request Free Sample

Research Analyst Overview

  • The Third-party Logistics (3PL) landscape reflects a fundamental shift in how multinational enterprises engineer their distribution networks to withstand macroeconomic volatility. Boardroom executives are increasingly prioritizing a supply chain orchestration tower to govern complex procurement, transit, and fulfillment operations, directly aligning logistics strategy with enterprise risk management.
  • The accelerated adoption of an automated storage and retrieval system allows operators to navigate severe labor deficits, enabling a 35% reduction in manual order picking errors while maximizing facility throughput. Furthermore, executing precise reverse logistics management has become a critical profitability driver for the retail sector, minimizing asset depreciation on returned merchandise.
  • The strategic deployment of a digital freight matching algorithm optimizes intermodal freight consolidation, granting shippers the agility to secure dedicated contract carriage during periods of tight maritime capacity. Simultaneously, stringent regulatory mandates require the implementation of blockchain trade documentation to ensure transparent, audit-ready cargo provenance.
  • By integrating an internet of things shipment tracking protocol, businesses successfully transform rigid supply chains into dynamic, data-driven ecosystems capable of executing just-in-sequence material delivery without inflating operational overhead.

What are the Key Data Covered in this Third-Party Logistics (3Pl) Market Research and Growth Report?

  • What is the expected growth of the Third-Party Logistics (3Pl) Market between 2026 and 2030?

    • USD 733.6 billion, at a CAGR of 8.6%

  • What segmentation does the market report cover?

    • The report is segmented by Application (Transportation services, Warehousing and distribution services, and Others), End-user (Manufacturing, Retail, Consumer goods, Healthcare, and Others), Mode of Transportation (Roadways, Seaways, Railways, Airways, and Multimodal transport) and Geography (APAC, North America, Europe, South America, Middle East and Africa)

  • Which regions are analyzed in the report?

    • APAC, North America, Europe, South America and Middle East and Africa

  • What are the key growth drivers and market challenges?

    • Rapid expansion of global digital commerce, Severe labor shortages and high turnover

  • Who are the major players in the Third-Party Logistics (3Pl) Market?

    • Americold Realty Trust Inc., AP Moller Maersk AS, Burris Logistics Co., C H Robinson Worldwide Inc., CEVA Logistics SA, Dachser SE, DB Schenker, DHL International GmbH, Expeditors International Inc., FedEx Corp., GEODIS, Hellmann Worldwide Logistics, Hub Group Inc., JB Hunt Transport Services, Kenco Group Inc., Kuehne Nagel Management AG, M and W Logistics Group Inc., NFI Industries Inc., Ryder System Inc., SF Express Co. Ltd., United Parcel Service Inc. and XPO Inc.

Market Research Insights

  • The Third-party Logistics (3PL) Market is undergoing a rapid structural transformation as enterprises transition toward a decentralized distribution model to enhance market responsiveness. By leveraging scalable warehousing infrastructure, shippers have successfully reduced inventory holding periods by over 20%, directly improving working capital efficiency.
  • The implementation of an electronic bill of lading alongside an automated customs interface has accelerated cross-border documentation processing by 30%, minimizing port dwell times and ensuring supply chain continuity. Furthermore, the integration of continuous temperature monitoring within multi-tenant public warehousing allows pharmaceutical distributors to cut transit spoilage rates by nearly 15%.
  • This asset-light approach enables multinational corporations to execute variable operating cost conversion while maintaining robust, compliant, and highly efficient global freight operations.

We can help! Our analysts can customize this third-party logistics (3pl) market research report to meet your requirements.

Get in touch

1. Executive Summary

1.1 Market overview

Executive Summary - Chart on Market Overview
Executive Summary - Data Table on Market Overview
Executive Summary - Chart on Global Market Characteristics
Executive Summary - Chart on Market by Geography
Executive Summary - Chart on Market Segmentation by Application
Executive Summary - Chart on Market Segmentation by End-user
Executive Summary - Chart on Market Segmentation by Mode of Transportation
Executive Summary - Chart on Incremental Growth
Executive Summary - Data Table on Incremental Growth
Executive Summary - Chart on Company Market Positioning

2. Technavio Analysis

2.1 Analysis of price sensitivity, lifecycle, customer purchase basket, adoption rates, and purchase criteria

2.2 Criticality of inputs and Factors of differentiation

Chart on Overview on criticality of inputs and factors of differentiation

2.3 Factors of disruption

Chart on Overview on factors of disruption

2.4 Impact of drivers and challenges

Chart on Impact of drivers and challenges in 2025 and 2030

3. Market Landscape

3.1 Market ecosystem

Chart on Parent Market
Data Table on - Parent Market

3.2 Market characteristics

Chart on Market characteristics analysis

3.3 Value chain analysis

Chart on Value chain analysis

4. Market Sizing

4.1 Market definition

Data Table on Offerings of companies included in the market definition

4.2 Market segment analysis

Market segments

4.3 Market size 2025

4.4 Market outlook: Forecast for 2025-2030

Chart on Global - Market size and forecast 2025-2030 ($ billion)
Data Table on Global - Market size and forecast 2025-2030 ($ billion)
Chart on Global Market: Year-over-year growth 2025-2030 (%)
Data Table on Global Market: Year-over-year growth 2025-2030 (%)

5. Historic Market Size

5.1 Global Third-Party Logistics (3PL) Market 2020 - 2024

Historic Market Size - Data Table on Global Third-Party Logistics (3PL) Market 2020 - 2024 ($ billion)

5.2 Application segment analysis 2020 - 2024

Historic Market Size - Application Segment 2020 - 2024 ($ billion)

5.3 End-user segment analysis 2020 - 2024

Historic Market Size - End-user Segment 2020 - 2024 ($ billion)

5.4 Mode of Transportation segment analysis 2020 - 2024

Historic Market Size - Mode of Transportation Segment 2020 - 2024 ($ billion)

5.5 Geography segment analysis 2020 - 2024

Historic Market Size - Geography Segment 2020 - 2024 ($ billion)

5.6 Country segment analysis 2020 - 2024

Historic Market Size - Country Segment 2020 - 2024 ($ billion)

6. Qualitative Analysis

6.1 Impact of AI on Global Third-party Logistics (3PL) Market

6.2 Impact of geopolitical conflicts on Global Third-party Logistics (3PL) Market

7. Five Forces Analysis

7.1 Five forces summary

Five forces analysis - Comparison between 2025 and 2030

7.2 Bargaining power of buyers

Bargaining power of buyers - Impact of key factors 2025 and 2030

7.3 Bargaining power of suppliers

Bargaining power of suppliers - Impact of key factors in 2025 and 2030

7.4 Threat of new entrants

Threat of new entrants - Impact of key factors in 2025 and 2030

7.5 Threat of substitutes

Threat of substitutes - Impact of key factors in 2025 and 2030

7.6 Threat of rivalry

Threat of rivalry - Impact of key factors in 2025 and 2030

7.7 Market condition

Chart on Market condition - Five forces 2025 and 2030

8. Market Segmentation by Application

8.1 Market segments

Chart on Application - Market share 2025-2030 (%)
Data Table on Application - Market share 2025-2030 (%)

8.2 Comparison by Application

Chart on Comparison by Application
Data Table on Comparison by Application

8.3 Transportation services - Market size and forecast 2025-2030

Chart on Transportation services - Market size and forecast 2025-2030 ($ billion)
Data Table on Transportation services - Market size and forecast 2025-2030 ($ billion)
Chart on Transportation services - Year-over-year growth 2025-2030 (%)
Data Table on Transportation services - Year-over-year growth 2025-2030 (%)

8.4 Warehousing and distribution services - Market size and forecast 2025-2030

Chart on Warehousing and distribution services - Market size and forecast 2025-2030 ($ billion)
Data Table on Warehousing and distribution services - Market size and forecast 2025-2030 ($ billion)
Chart on Warehousing and distribution services - Year-over-year growth 2025-2030 (%)
Data Table on Warehousing and distribution services - Year-over-year growth 2025-2030 (%)

8.5 Others - Market size and forecast 2025-2030

Chart on Others - Market size and forecast 2025-2030 ($ billion)
Data Table on Others - Market size and forecast 2025-2030 ($ billion)
Chart on Others - Year-over-year growth 2025-2030 (%)
Data Table on Others - Year-over-year growth 2025-2030 (%)

8.6 Market opportunity by Application

Market opportunity by Application ($ billion)
Data Table on Market opportunity by Application ($ billion)

9. Market Segmentation by End-user

9.1 Market segments

Chart on End-user - Market share 2025-2030 (%)
Data Table on End-user - Market share 2025-2030 (%)

9.2 Comparison by End-user

Chart on Comparison by End-user
Data Table on Comparison by End-user

9.3 Manufacturing - Market size and forecast 2025-2030

Chart on Manufacturing - Market size and forecast 2025-2030 ($ billion)
Data Table on Manufacturing - Market size and forecast 2025-2030 ($ billion)
Chart on Manufacturing - Year-over-year growth 2025-2030 (%)
Data Table on Manufacturing - Year-over-year growth 2025-2030 (%)

9.4 Retail - Market size and forecast 2025-2030

Chart on Retail - Market size and forecast 2025-2030 ($ billion)
Data Table on Retail - Market size and forecast 2025-2030 ($ billion)
Chart on Retail - Year-over-year growth 2025-2030 (%)
Data Table on Retail - Year-over-year growth 2025-2030 (%)

9.5 Consumer goods - Market size and forecast 2025-2030

Chart on Consumer goods - Market size and forecast 2025-2030 ($ billion)
Data Table on Consumer goods - Market size and forecast 2025-2030 ($ billion)
Chart on Consumer goods - Year-over-year growth 2025-2030 (%)
Data Table on Consumer goods - Year-over-year growth 2025-2030 (%)

9.6 Healthcare - Market size and forecast 2025-2030

Chart on Healthcare - Market size and forecast 2025-2030 ($ billion)
Data Table on Healthcare - Market size and forecast 2025-2030 ($ billion)
Chart on Healthcare - Year-over-year growth 2025-2030 (%)
Data Table on Healthcare - Year-over-year growth 2025-2030 (%)

9.7 Others - Market size and forecast 2025-2030

Chart on Others - Market size and forecast 2025-2030 ($ billion)
Data Table on Others - Market size and forecast 2025-2030 ($ billion)
Chart on Others - Year-over-year growth 2025-2030 (%)
Data Table on Others - Year-over-year growth 2025-2030 (%)

9.8 Market opportunity by End-user

Market opportunity by End-user ($ billion)
Data Table on Market opportunity by End-user ($ billion)

10. Market Segmentation by Mode of Transportation

10.1 Market segments

Chart on Mode of Transportation - Market share 2025-2030 (%)
Data Table on Mode of Transportation - Market share 2025-2030 (%)

10.2 Comparison by Mode of Transportation

Chart on Comparison by Mode of Transportation
Data Table on Comparison by Mode of Transportation

10.3 Roadways - Market size and forecast 2025-2030

Chart on Roadways - Market size and forecast 2025-2030 ($ billion)
Data Table on Roadways - Market size and forecast 2025-2030 ($ billion)
Chart on Roadways - Year-over-year growth 2025-2030 (%)
Data Table on Roadways - Year-over-year growth 2025-2030 (%)

10.4 Seaways - Market size and forecast 2025-2030

Chart on Seaways - Market size and forecast 2025-2030 ($ billion)
Data Table on Seaways - Market size and forecast 2025-2030 ($ billion)
Chart on Seaways - Year-over-year growth 2025-2030 (%)
Data Table on Seaways - Year-over-year growth 2025-2030 (%)

10.5 Railways - Market size and forecast 2025-2030

Chart on Railways - Market size and forecast 2025-2030 ($ billion)
Data Table on Railways - Market size and forecast 2025-2030 ($ billion)
Chart on Railways - Year-over-year growth 2025-2030 (%)
Data Table on Railways - Year-over-year growth 2025-2030 (%)

10.6 Airways - Market size and forecast 2025-2030

Chart on Airways - Market size and forecast 2025-2030 ($ billion)
Data Table on Airways - Market size and forecast 2025-2030 ($ billion)
Chart on Airways - Year-over-year growth 2025-2030 (%)
Data Table on Airways - Year-over-year growth 2025-2030 (%)

10.7 Multimodal transport - Market size and forecast 2025-2030

Chart on Multimodal transport - Market size and forecast 2025-2030 ($ billion)
Data Table on Multimodal transport - Market size and forecast 2025-2030 ($ billion)
Chart on Multimodal transport - Year-over-year growth 2025-2030 (%)
Data Table on Multimodal transport - Year-over-year growth 2025-2030 (%)

10.8 Market opportunity by Mode of Transportation

Market opportunity by Mode of Transportation ($ billion)
Data Table on Market opportunity by Mode of Transportation ($ billion)

11. Customer Landscape

11.1 Customer landscape overview

Analysis of price sensitivity, lifecycle, customer purchase basket, adoption rates, and purchase criteria

12. Geographic Landscape

12.1 Geographic segmentation

Chart on Market share by geography 2025-2030 (%)
Data Table on Market share by geography 2025-2030 (%)

12.2 Geographic comparison

Chart on Geographic comparison
Data Table on Geographic comparison

12.3 APAC - Market size and forecast 2025-2030

Chart on APAC - Market size and forecast 2025-2030 ($ billion)
Data Table on APAC - Market size and forecast 2025-2030 ($ billion)
Chart on APAC - Year-over-year growth 2025-2030 (%)
Data Table on APAC - Year-over-year growth 2025-2030 (%)
Chart on Regional Comparison - APAC
Data Table on Regional Comparison - APAC

12.3.1 China - Market size and forecast 2025-2030

Chart on China - Market size and forecast 2025-2030 ($ billion)
Data Table on China - Market size and forecast 2025-2030 ($ billion)
Chart on China - Year-over-year growth 2025-2030 (%)
Data Table on China - Year-over-year growth 2025-2030 (%)

12.3.2 Japan - Market size and forecast 2025-2030

Chart on Japan - Market size and forecast 2025-2030 ($ billion)
Data Table on Japan - Market size and forecast 2025-2030 ($ billion)
Chart on Japan - Year-over-year growth 2025-2030 (%)
Data Table on Japan - Year-over-year growth 2025-2030 (%)

12.3.3 India - Market size and forecast 2025-2030

Chart on India - Market size and forecast 2025-2030 ($ billion)
Data Table on India - Market size and forecast 2025-2030 ($ billion)
Chart on India - Year-over-year growth 2025-2030 (%)
Data Table on India - Year-over-year growth 2025-2030 (%)

12.3.4 South Korea - Market size and forecast 2025-2030

Chart on South Korea - Market size and forecast 2025-2030 ($ billion)
Data Table on South Korea - Market size and forecast 2025-2030 ($ billion)
Chart on South Korea - Year-over-year growth 2025-2030 (%)
Data Table on South Korea - Year-over-year growth 2025-2030 (%)

12.3.5 Australia - Market size and forecast 2025-2030

Chart on Australia - Market size and forecast 2025-2030 ($ billion)
Data Table on Australia - Market size and forecast 2025-2030 ($ billion)
Chart on Australia - Year-over-year growth 2025-2030 (%)
Data Table on Australia - Year-over-year growth 2025-2030 (%)

12.3.6 Indonesia - Market size and forecast 2025-2030

Chart on Indonesia - Market size and forecast 2025-2030 ($ billion)
Data Table on Indonesia - Market size and forecast 2025-2030 ($ billion)
Chart on Indonesia - Year-over-year growth 2025-2030 (%)
Data Table on Indonesia - Year-over-year growth 2025-2030 (%)

12.4 North America - Market size and forecast 2025-2030

Chart on North America - Market size and forecast 2025-2030 ($ billion)
Data Table on North America - Market size and forecast 2025-2030 ($ billion)
Chart on North America - Year-over-year growth 2025-2030 (%)
Data Table on North America - Year-over-year growth 2025-2030 (%)
Chart on Regional Comparison - North America
Data Table on Regional Comparison - North America

12.4.1 US - Market size and forecast 2025-2030

Chart on US - Market size and forecast 2025-2030 ($ billion)
Data Table on US - Market size and forecast 2025-2030 ($ billion)
Chart on US - Year-over-year growth 2025-2030 (%)
Data Table on US - Year-over-year growth 2025-2030 (%)

12.4.2 Canada - Market size and forecast 2025-2030

Chart on Canada - Market size and forecast 2025-2030 ($ billion)
Data Table on Canada - Market size and forecast 2025-2030 ($ billion)
Chart on Canada - Year-over-year growth 2025-2030 (%)
Data Table on Canada - Year-over-year growth 2025-2030 (%)

12.4.3 Mexico - Market size and forecast 2025-2030

Chart on Mexico - Market size and forecast 2025-2030 ($ billion)
Data Table on Mexico - Market size and forecast 2025-2030 ($ billion)
Chart on Mexico - Year-over-year growth 2025-2030 (%)
Data Table on Mexico - Year-over-year growth 2025-2030 (%)

12.5 Europe - Market size and forecast 2025-2030

Chart on Europe - Market size and forecast 2025-2030 ($ billion)
Data Table on Europe - Market size and forecast 2025-2030 ($ billion)
Chart on Europe - Year-over-year growth 2025-2030 (%)
Data Table on Europe - Year-over-year growth 2025-2030 (%)
Chart on Regional Comparison - Europe
Data Table on Regional Comparison - Europe

12.5.1 Germany - Market size and forecast 2025-2030

Chart on Germany - Market size and forecast 2025-2030 ($ billion)
Data Table on Germany - Market size and forecast 2025-2030 ($ billion)
Chart on Germany - Year-over-year growth 2025-2030 (%)
Data Table on Germany - Year-over-year growth 2025-2030 (%)

12.5.2 UK - Market size and forecast 2025-2030

Chart on UK - Market size and forecast 2025-2030 ($ billion)
Data Table on UK - Market size and forecast 2025-2030 ($ billion)
Chart on UK - Year-over-year growth 2025-2030 (%)
Data Table on UK - Year-over-year growth 2025-2030 (%)

12.5.3 France - Market size and forecast 2025-2030

Chart on France - Market size and forecast 2025-2030 ($ billion)
Data Table on France - Market size and forecast 2025-2030 ($ billion)
Chart on France - Year-over-year growth 2025-2030 (%)
Data Table on France - Year-over-year growth 2025-2030 (%)

12.5.4 Italy - Market size and forecast 2025-2030

Chart on Italy - Market size and forecast 2025-2030 ($ billion)
Data Table on Italy - Market size and forecast 2025-2030 ($ billion)
Chart on Italy - Year-over-year growth 2025-2030 (%)
Data Table on Italy - Year-over-year growth 2025-2030 (%)

12.5.5 Spain - Market size and forecast 2025-2030

Chart on Spain - Market size and forecast 2025-2030 ($ billion)
Data Table on Spain - Market size and forecast 2025-2030 ($ billion)
Chart on Spain - Year-over-year growth 2025-2030 (%)
Data Table on Spain - Year-over-year growth 2025-2030 (%)

12.5.6 The Netherlands - Market size and forecast 2025-2030

Chart on The Netherlands - Market size and forecast 2025-2030 ($ billion)
Data Table on The Netherlands - Market size and forecast 2025-2030 ($ billion)
Chart on The Netherlands - Year-over-year growth 2025-2030 (%)
Data Table on The Netherlands - Year-over-year growth 2025-2030 (%)

12.6 South America - Market size and forecast 2025-2030

Chart on South America - Market size and forecast 2025-2030 ($ billion)
Data Table on South America - Market size and forecast 2025-2030 ($ billion)
Chart on South America - Year-over-year growth 2025-2030 (%)
Data Table on South America - Year-over-year growth 2025-2030 (%)
Chart on Regional Comparison - South America
Data Table on Regional Comparison - South America

12.6.1 Brazil - Market size and forecast 2025-2030

Chart on Brazil - Market size and forecast 2025-2030 ($ billion)
Data Table on Brazil - Market size and forecast 2025-2030 ($ billion)
Chart on Brazil - Year-over-year growth 2025-2030 (%)
Data Table on Brazil - Year-over-year growth 2025-2030 (%)

12.6.2 Argentina - Market size and forecast 2025-2030

Chart on Argentina - Market size and forecast 2025-2030 ($ billion)
Data Table on Argentina - Market size and forecast 2025-2030 ($ billion)
Chart on Argentina - Year-over-year growth 2025-2030 (%)
Data Table on Argentina - Year-over-year growth 2025-2030 (%)

12.6.3 Chile - Market size and forecast 2025-2030

Chart on Chile - Market size and forecast 2025-2030 ($ billion)
Data Table on Chile - Market size and forecast 2025-2030 ($ billion)
Chart on Chile - Year-over-year growth 2025-2030 (%)
Data Table on Chile - Year-over-year growth 2025-2030 (%)

12.7 Middle East and Africa - Market size and forecast 2025-2030

Chart on Middle East and Africa - Market size and forecast 2025-2030 ($ billion)
Data Table on Middle East and Africa - Market size and forecast 2025-2030 ($ billion)
Chart on Middle East and Africa - Year-over-year growth 2025-2030 (%)
Data Table on Middle East and Africa - Year-over-year growth 2025-2030 (%)
Chart on Regional Comparison - Middle East and Africa
Data Table on Regional Comparison - Middle East and Africa

12.7.1 Saudi Arabia - Market size and forecast 2025-2030

Chart on Saudi Arabia - Market size and forecast 2025-2030 ($ billion)
Data Table on Saudi Arabia - Market size and forecast 2025-2030 ($ billion)
Chart on Saudi Arabia - Year-over-year growth 2025-2030 (%)
Data Table on Saudi Arabia - Year-over-year growth 2025-2030 (%)

12.7.2 UAE - Market size and forecast 2025-2030

Chart on UAE - Market size and forecast 2025-2030 ($ billion)
Data Table on UAE - Market size and forecast 2025-2030 ($ billion)
Chart on UAE - Year-over-year growth 2025-2030 (%)
Data Table on UAE - Year-over-year growth 2025-2030 (%)

12.7.3 South Africa - Market size and forecast 2025-2030

Chart on South Africa - Market size and forecast 2025-2030 ($ billion)
Data Table on South Africa - Market size and forecast 2025-2030 ($ billion)
Chart on South Africa - Year-over-year growth 2025-2030 (%)
Data Table on South Africa - Year-over-year growth 2025-2030 (%)

12.7.4 Israel - Market size and forecast 2025-2030

Chart on Israel - Market size and forecast 2025-2030 ($ billion)
Data Table on Israel - Market size and forecast 2025-2030 ($ billion)
Chart on Israel - Year-over-year growth 2025-2030 (%)
Data Table on Israel - Year-over-year growth 2025-2030 (%)

12.7.5 Turkey - Market size and forecast 2025-2030

Chart on Turkey - Market size and forecast 2025-2030 ($ billion)
Data Table on Turkey - Market size and forecast 2025-2030 ($ billion)
Chart on Turkey - Year-over-year growth 2025-2030 (%)
Data Table on Turkey - Year-over-year growth 2025-2030 (%)

12.8 Market opportunity by geography

Market opportunity by geography ($ billion)
Data Tables on Market opportunity by geography ($ billion)

13. Drivers, Challenges, and Opportunity

13.1 Market drivers

Rapid expansion of global digital commerce
Strategic consolidation across global freight networks
Accelerated adoption of automated warehouse technologies

13.2 Market challenges

Severe labor shortages and high turnover
Escalating geopolitical friction and tariff volatility
Complex sustainability mandates and decarbonization requirements

13.3 Impact of drivers and challenges

Impact of drivers and challenges in 2025 and 2030

13.4 Market opportunities

Rapid growth of global omnichannel fulfillment
Integration of advanced supply chain technologies
Rising demand for sustainable green logistics

14. Competitive Landscape

14.1 Overview

14.2

Overview on criticality of inputs and factors of differentiation

14.3 Landscape disruption

Overview on factors of disruption

14.4 Industry risks

Impact of key risks on business

15. Competitive Analysis

15.1 Companies profiled

Companies covered

15.2 Company ranking index

15.3 Market positioning of companies

Matrix on companies position and classification

15.4 AP Moller Maersk AS

AP Moller Maersk AS - Overview
AP Moller Maersk AS - Business segments
AP Moller Maersk AS - Key news
AP Moller Maersk AS - Key offerings
AP Moller Maersk AS - Segment focus
SWOT

15.5 C H Robinson Worldwide Inc.

C H Robinson Worldwide Inc. - Overview
C H Robinson Worldwide Inc. - Business segments
C H Robinson Worldwide Inc. - Key news
C H Robinson Worldwide Inc. - Key offerings
C H Robinson Worldwide Inc. - Segment focus
SWOT

15.6 CEVA Logistics SA

CEVA Logistics SA - Overview
CEVA Logistics SA - Product / Service
CEVA Logistics SA - Key offerings
SWOT

15.7 Dachser SE

Dachser SE - Overview
Dachser SE - Product / Service
Dachser SE - Key offerings
SWOT

15.8 DB Schenker

DB Schenker - Overview
DB Schenker - Product / Service
DB Schenker - Key offerings
SWOT

15.9 DHL International GmbH

DHL International GmbH - Overview
DHL International GmbH - Business segments
DHL International GmbH - Key news
DHL International GmbH - Key offerings
DHL International GmbH - Segment focus
SWOT

15.10 Expeditors International Inc.

Expeditors International Inc. - Overview
Expeditors International Inc. - Business segments
Expeditors International Inc. - Key offerings
Expeditors International Inc. - Segment focus
SWOT

15.11 FedEx Corp.

FedEx Corp. - Overview
FedEx Corp. - Business segments
FedEx Corp. - Key news
FedEx Corp. - Key offerings
FedEx Corp. - Segment focus
SWOT

15.12 GEODIS

GEODIS - Overview
GEODIS - Product / Service
GEODIS - Key offerings
SWOT

15.13 JB Hunt Transport Services

JB Hunt Transport Services - Overview
JB Hunt Transport Services - Business segments
JB Hunt Transport Services - Key offerings
JB Hunt Transport Services - Segment focus
SWOT

15.14 Kuehne Nagel Management AG

Kuehne Nagel Management AG - Overview
Kuehne Nagel Management AG - Business segments
Kuehne Nagel Management AG - Key news
Kuehne Nagel Management AG - Key offerings
Kuehne Nagel Management AG - Segment focus
SWOT

15.15 Ryder System Inc.

Ryder System Inc. - Overview
Ryder System Inc. - Business segments
Ryder System Inc. - Key offerings
Ryder System Inc. - Segment focus
SWOT

15.16 SF Express Co. Ltd.

SF Express Co. Ltd. - Overview
SF Express Co. Ltd. - Business segments
SF Express Co. Ltd. - Key offerings
SF Express Co. Ltd. - Segment focus
SWOT

15.17 United Parcel Service Inc.

United Parcel Service Inc. - Overview
United Parcel Service Inc. - Business segments
United Parcel Service Inc. - Key offerings
United Parcel Service Inc. - Segment focus
SWOT

15.18 XPO Inc.

XPO Inc. - Overview
XPO Inc. - Business segments
XPO Inc. - Key offerings
XPO Inc. - Segment focus
SWOT

16. Appendix

16.1 Scope of the report

Market definition
Objectives
Notes and caveats

16.2 Inclusions and exclusions checklist

Inclusions checklist
Exclusions checklist

16.3 Currency conversion rates for US$

16.4 Research methodology

16.5 Data procurement

Information sources

16.6 Data validation

16.7 Validation techniques employed for market sizing

16.8 Data synthesis

16.9 360 degree market analysis

16.10 List of abbreviations

Research Methodology

Technavio presents a detailed picture of the market by way of study, synthesis, and summation of data from multiple sources. The analysts have presented the various facets of the market with a particular focus on identifying the key industry influencers. The data thus presented is comprehensive, reliable, and the result of extensive research, both primary and secondary.

INFORMATION SOURCES

Primary sources

  • Manufacturers and suppliers
  • Channel partners
  • Industry experts
  • Strategic decision makers

Secondary sources

  • Industry journals and periodicals
  • Government data
  • Financial reports of key industry players
  • Historical data
  • Press releases

DATA ANALYSIS

Data Synthesis

  • Collation of data
  • Estimation of key figures
  • Analysis of derived insights

Data Validation

  • Triangulation with data models
  • Reference against proprietary databases
  • Corroboration with industry experts

REPORT WRITING

Qualitative

  • Market drivers
  • Market challenges
  • Market trends
  • Five forces analysis

Quantitative

  • Market size and forecast
  • Market segmentation
  • Geographical insights
  • Competitive landscape

Interested in this report?

Get your sample now to see our research methodology and insights!

Download Now

Frequently Asked Questions

Third-Party Logistics (3Pl) market growth will increase by USD 733.6 billion during 2026-2030.

The Third-Party Logistics (3Pl) market is expected to grow at a CAGR of 8.6% during 2026-2030.

Third-Party Logistics (3Pl) market is segmented by Application (Transportation services, Warehousing and distribution services, Others) End-user (Manufacturing, Retail, Consumer goods, Healthcare, Others) Mode of transportation (Roadways, Seaways, Railways, Airways, Multimodal transport)

Americold Realty Trust Inc., AP Moller Maersk AS, Burris Logistics Co., C H Robinson Worldwide Inc., CEVA Logistics SA, Dachser SE, DB Schenker, DHL International GmbH, Expeditors International Inc., FedEx Corp., GEODIS, Hellmann Worldwide Logistics, Hub Group Inc., JB Hunt Transport Services, Kenco Group Inc., Kuehne Nagel Management AG, M and W Logistics Group Inc., NFI Industries Inc., Ryder System Inc., SF Express Co. Ltd., United Parcel Service Inc., XPO Inc. are a few of the key vendors in the Third-Party Logistics (3Pl) market.

APAC will register the highest growth rate of 44% among the other regions. Therefore, the Third-Party Logistics (3Pl) market in APAC is expected to garner significant business opportunities for the vendors during the forecast period.

China, Japan, India, South Korea, Australia, Indonesia, US, Canada, Mexico, Germany, UK, France, Italy, Spain, The Netherlands, Brazil, Argentina, Chile, Saudi Arabia, UAE, South Africa, Israel, Turkey

  • Rapid expansion of global digital commerce is the driving factor this market.

The Third-Party Logistics (3Pl) market vendors should focus on grabbing business opportunities from the Application segment as it accounted for the largest market share in the base year.
RIA - Research AI Assistant
Ask RIA
