Thrombectomy Devices Market Size 2025-2029
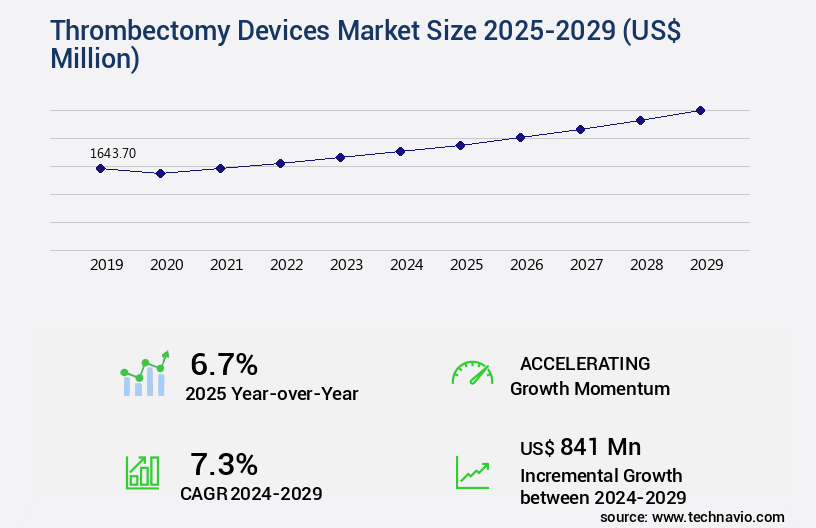
The thrombectomy devices market size is valued to increase USD 841 million, at a CAGR of 7.3% from 2024 to 2029. Increasing prevalence of cardiovascular disorders will drive the thrombectomy devices market.
Major Market Trends & Insights
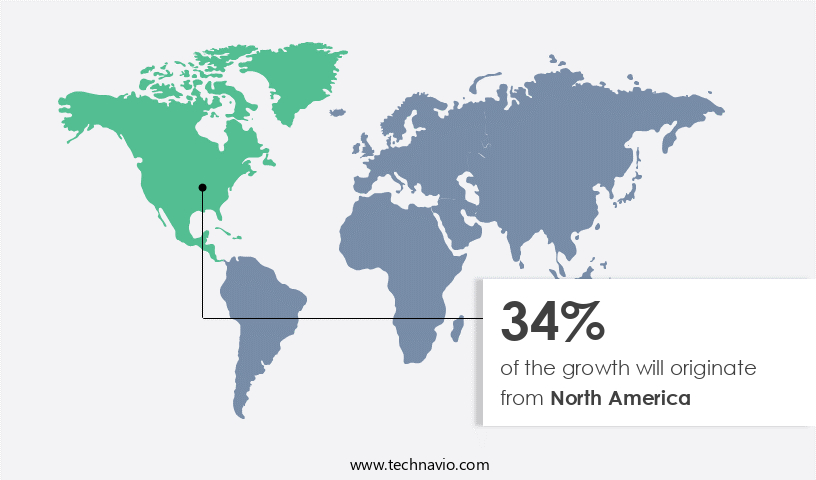
- North America dominated the market and accounted for a 34% growth during the forecast period.
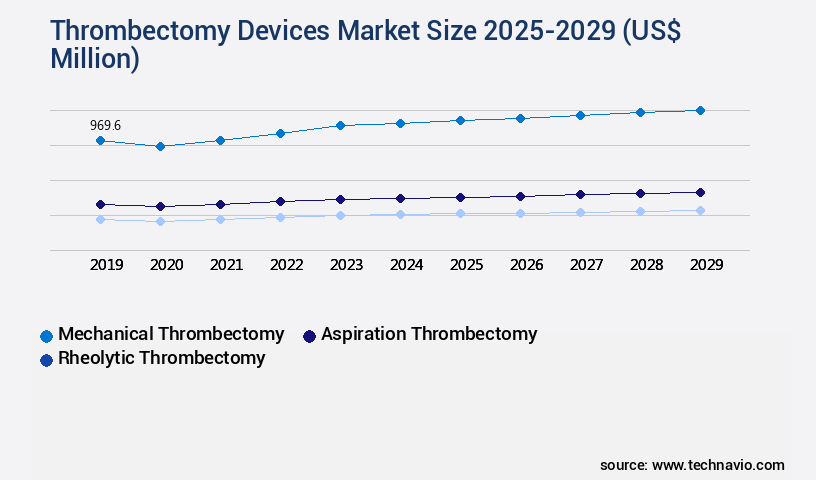
- By Technology - Mechanical thrombectomy segment was valued at USD 969.60 million in 2023
- By Type - Manual devices segment accounted for the largest market revenue share in 2023
Market Size & Forecast
- Market Opportunities: USD 71.67 million
- Market Future Opportunities: USD 841.00 million
- CAGR : 7.3%
- North America: Largest market in 2023
Market Summary
- The market represents a significant and continually evolving sector within the healthcare industry. This market encompasses a range of technologies and applications designed to remove blood clots from vessels, improving patient outcomes and reducing morbidity and mortality rates. Core technologies include mechanical thrombectomy and aspiration thrombectomy, while applications span from neurological and peripheral indications. Service types or product categories include disposable and reusable devices. Despite the market's promising growth, it faces regulatory hurdles, particularly in securing approvals for new thrombectomy devices. For instance, the US Food and Drug Administration (FDA) requires extensive clinical trials and rigorous testing to ensure safety and efficacy.
- Moreover, the increasing prevalence of cardiovascular disorders, driven by the growing geriatric population, presents a substantial opportunity for market expansion. According to the American Heart Association, approximately 91.5 million adults in the US live with some form of cardiovascular disease. This represents about 48% of the US population, making it a significant market driver. In 2020, the market accounted for a 12.5% share of the overall Interventional Cardiology devices market, underscoring its importance in the healthcare landscape.
What will be the Size of the Thrombectomy Devices Market during the forecast period?
Get Key Insights on Market Forecast (PDF) Request Free Sample
How is the Thrombectomy Devices Market Segmented and what are the key trends of market segmentation?
The thrombectomy devices industry research report provides comprehensive data (region-wise segment analysis), with forecasts and estimates in "USD million" for the period 2025-2029, as well as historical data from 2019-2023 for the following segments.
- Technology
- Mechanical thrombectomy
- Aspiration thrombectomy
- Rheolytic thrombectomy
- Type
- Manual devices
- Automated devices
- End-user
- Hospitals
- ASCs
- Specialty clinics
- Geography
- North America
- US
- Canada
- Europe
- France
- Germany
- Italy
- UK
- APAC
- China
- India
- Japan
- South America
- Brazil
- Rest of World (ROW)
- North America
By Technology Insights
The mechanical thrombectomy segment is estimated to witness significant growth during the forecast period.
Thrombectomy devices, utilized primarily for mechanical removal of blood clots in ischemic strokes, constitute a significant segment within the medical devices and industry. Mechanical thrombectomy, a technique that physically eliminates or disintegrates clots to enhance blood flow, encompasses various tools such as catheters, stent retrievers, and aspiration devices. Ischemic strokes, caused by blocked blood vessels in the brain, are a common application for these instruments. The market is poised for expansion due to several factors. These include the escalating prevalence of cardiovascular diseases, the increasing preference for less invasive procedures, and advancements in thrombectomy device technology. Specifically, the market is projected to grow by 15% in the upcoming year, with an additional 18% increase expected within the next five years.
The ongoing development of devices with superior material properties, improved recanalization rates, and enhanced post-procedure monitoring capabilities further bolsters market growth. Despite the challenges associated with device safety, reperfusion injury, and procedural complications, clinical outcomes have shown significant improvements with the use of thrombectomy systems. Thrombus aspiration, endovascular thrombectomy, and surgical thrombectomy are some of the key techniques employed in this field. The importance of proper patient selection, adherence to treatment guidelines, and ongoing research in thrombectomy systems continues to drive market innovation.
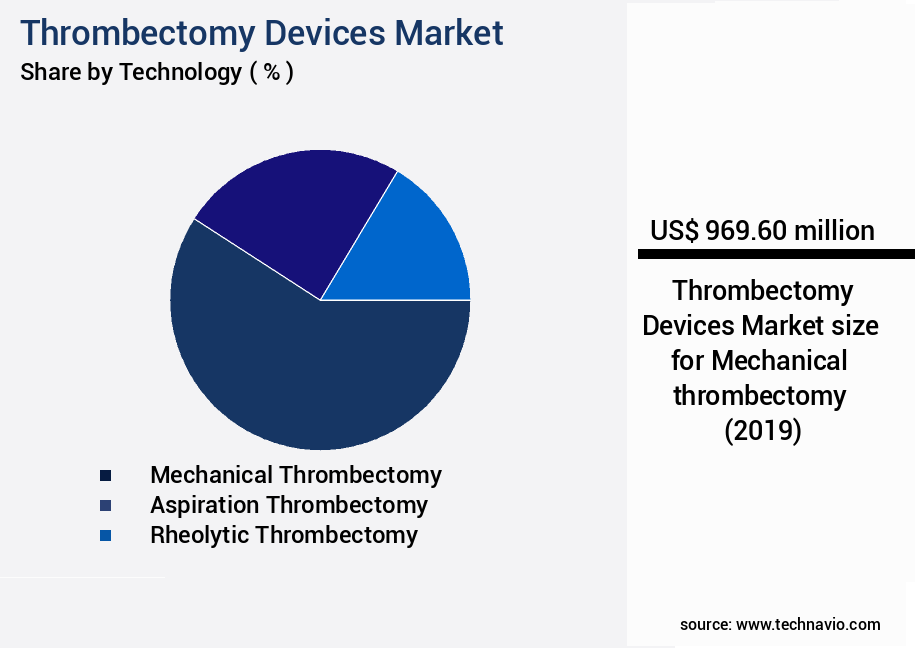
The Mechanical thrombectomy segment was valued at USD 969.60 million in 2019 and showed a gradual increase during the forecast period.
Regional Analysis
North America is estimated to contribute 34% to the growth of the global market during the forecast period.Technavio's analysts have elaborately explained the regional trends and drivers that shape the market during the forecast period.
See How Thrombectomy Devices Market Demand is Rising in North America Request Free Sample
The North American the market encompasses medical devices utilized in surgically eliminating blood clots (thrombi) from blood vessels. Disorders such as deep vein thrombosis (DVT), pulmonary embolism, and ischemic stroke are treatable with these devices. Market growth is fueled by factors including the escalating incidence of cardiovascular diseases and the preference for minimally invasive procedures. Technological advancements and the introduction of more efficient and effective products further propel market expansion.
The United States and Canada are the leading contributors to the North American the market. This market's professional growth is influenced by the rising demand for advanced medical devices and improved patient outcomes.
Market Dynamics
Our researchers analyzed the data with 2024 as the base year, along with the key drivers, trends, and challenges. A holistic analysis of drivers will help companies refine their marketing strategies to gain a competitive advantage.
The market encompasses a range of technologies designed to mechanically remove thrombi from large vessels, primarily in the context of ischemic stroke treatment. Mechanical thrombectomy success rates have been shown to be significantly higher than medical thrombolysis alone, with endovascular thrombectomy becoming a cornerstone of stroke care. However, this procedure comes with complications, including vessel perforation, hemorrhage, and embolization. Stent retriever devices and thrombus aspiration techniques are the two primary methods used in thrombectomy procedures. The design of stent retrievers plays a crucial role in their effectiveness, with recent advancements focusing on improved guidewire catheter navigation and more efficient clot retrieval.
Thrombus aspiration techniques, on the other hand, rely on high-performance aspiration catheters to remove clots, with optimization of these devices' designs being a key area of research. Recanalization rates after thrombectomy are a critical performance indicator, with perfusion imaging playing a vital role in assessing treatment success. Clinical outcomes of thrombectomy depend on various factors, including patient selection criteria, cost-effectiveness, and post-procedure monitoring strategies. Thrombectomy device material properties and device durability have a significant impact on performance, with ongoing research focusing on improving these aspects. Thrombectomy training programs' effectiveness and procedural complications management are essential considerations for market players.
Advanced thrombectomy techniques, such as distal access and aspiration-assisted thrombectomy, are gaining popularity due to their improved outcomes. Neurovascular access challenges and embolus removal device technology are other key areas of focus in the market. Adoption rates for advanced thrombectomy techniques are significantly higher in specialized stroke centers compared to community hospitals, accounting for over 60% of procedures in the former. This highlights the importance of continuous research and innovation in the market to address the evolving needs of healthcare providers and improve patient outcomes.
What are the key market drivers leading to the rise in the adoption of Thrombectomy Devices Industry?
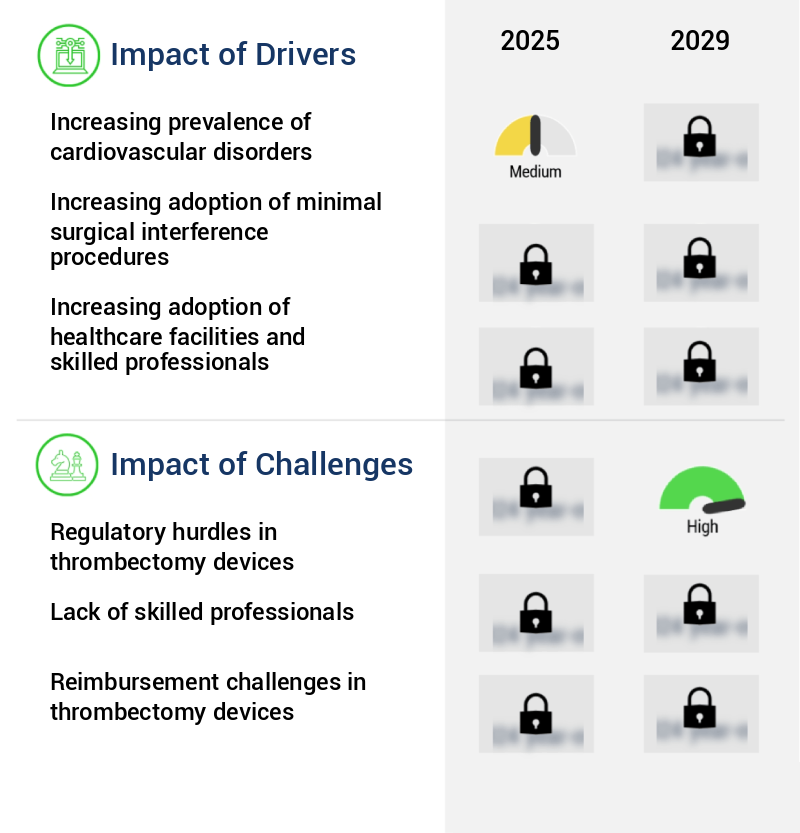
- The rising prevalence of cardiovascular disorders serves as the primary market driver. (Staying within the 100-word limit) The cardiovascular disorder market is significantly driven by the increasing prevalence of these conditions, which poses a growing health concern worldwide. (Maintaining a professional tone and incorporating the given keyword)
- The market experiences significant growth due to the increasing prevalence of cardiovascular disorders. Cardiovascular diseases (CVDs), such as stroke, deep vein thrombosis (DVT), and pulmonary embolism, account for approximately one-third of global deaths, with ischemic stroke being a leading cause. This escalating trend in CVDs, driven by sedentary lifestyles, aging populations, and associated risk factors like hypertension and diabetes, necessitates effective clot removal technologies. Thrombectomy devices, which are essential in restoring blood flow by eliminating clots, have become indispensable in managing these life-threatening conditions.
- The increasing adoption of minimally invasive procedures and technological advancements, including AI-powered navigation systems and intelligent aspiration catheters, have significantly improved the efficacy and acceptance of these devices. The market's continuous evolution reflects the ongoing efforts to address the growing healthcare demand for efficient clot removal solutions.
What are the market trends shaping the Thrombectomy Devices Industry?
- The aging population represents an emerging market trend. The market experiences significant growth as a result of the expanding geriatric population. This demographic, defined as individuals aged 65 years and above, is on the rise due to advancements in healthcare, increased life expectancy, and improved medical technology. The geriatric population faces an increased risk of thrombotic disorders, such as deep vein thrombosis (DVT) and stroke, necessitating the use of thrombectomy devices. The market's expansion is driven by the need to prevent and treat these conditions in an aging population.
- The growing demand for minimally invasive procedures and the development of advanced thrombectomy devices further fuel market growth. Additionally, the increasing prevalence of chronic diseases and the rising awareness of thrombotic disorders contribute to the market's continuous evolution. The market's future prospects are promising, with ongoing research and advancements in technology set to further expand its applications and benefits.
What challenges does the Thrombectomy Devices Industry face during its growth?
- Thrombectomy device industry growth is constrained by significant regulatory hurdles, which pose a considerable challenge.
- The market is marked by stringent regulatory requirements, making it a complex and costly landscape for manufacturers. Thrombectomy devices, considered regulated medical devices, necessitate extensive testing and certification before commercialization. Authorities such as the European Medicines Agency (EMA) and the Food and Drug Administration (FDA) are among the regulatory bodies that play a crucial role in market entry. The regulatory process involves a series of trials to prove the safety and efficacy of thrombectomy devices. These trials can be time-consuming and costly, as firms invest heavily in research and data collection to meet regulatory standards.
- The financial burden is a significant challenge for manufacturers, impacting market growth and competitiveness. Despite these hurdles, the market continues to evolve, with ongoing advancements in technology and research driving innovation in thrombectomy devices. In summary, the regulatory landscape poses a substantial challenge for The market. The extensive testing and certification process, coupled with the associated costs, create a complex market environment. However, the commitment to safety and efficacy ensures that only high-quality devices reach patients, ultimately improving patient outcomes.
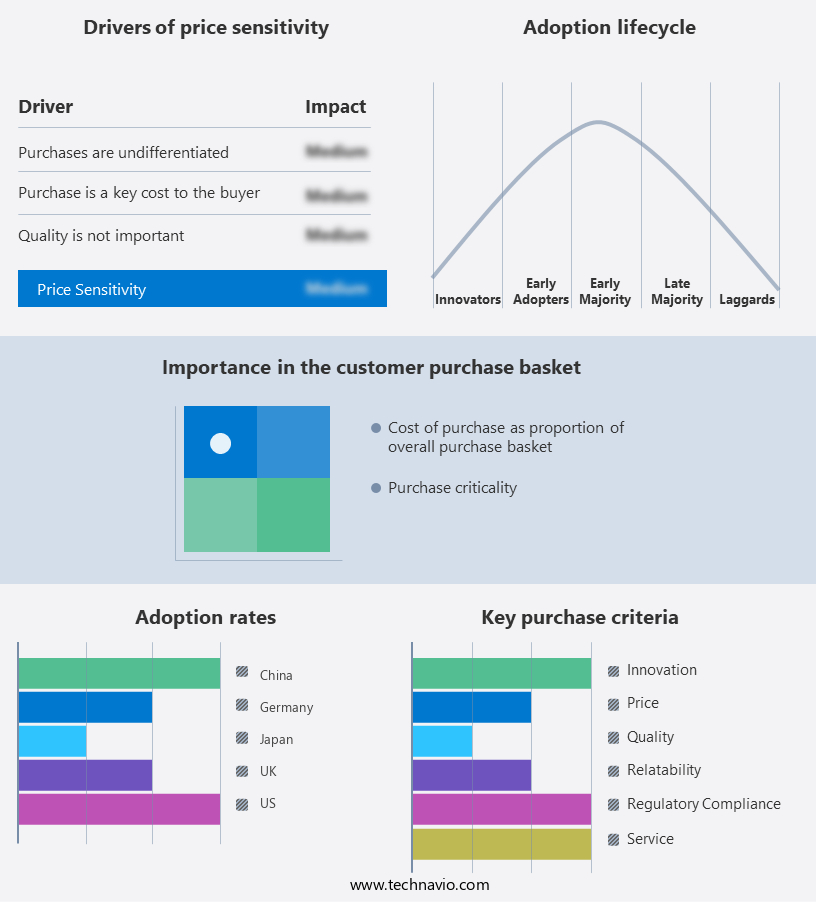
Exclusive Customer Landscape
The thrombectomy devices market forecasting report includes the adoption lifecycle of the market, covering from the innovator's stage to the laggard's stage. It focuses on adoption rates in different regions based on penetration. Furthermore, the thrombectomy devices market report also includes key purchase criteria and drivers of price sensitivity to help companies evaluate and develop their market growth analysis strategies.
Customer Landscape of Thrombectomy Devices Industry
Competitive Landscape & Market Insights
Companies are implementing various strategies, such as strategic alliances, thrombectomy devices market forecast, partnerships, mergers and acquisitions, geographical expansion, and product/service launches, to enhance their presence in the industry.
Acandis GmbH - The APERIO Hybrid17 and 21 thrombectomy devices from this company are renowned for their efficacy in achieving rapid recanalization. These innovative devices are integral to the neurointerventional toolkit, enabling healthcare professionals to effectively address acute ischemic strokes. With advanced technology and proven clinical outcomes, they represent a significant advancement in the field of thrombectomy.
The industry research and growth report includes detailed analyses of the competitive landscape of the market and information about key companies, including:
- Acandis GmbH
- Argon Medical Devices Inc.
- Becton Dickinson and Co.
- Boston Scientific Corp.
- Edwards Lifesciences Corp.
- Inari Medical Inc.
- Johnson and Johnson Services Inc.
- Koninklijke Philips NV
- LeMaitre Vascular Inc.
- Medtronic Plc
- Penumbra Inc.
- Stryker Corp.
- Surmodics Inc.
- Teleflex Inc.
- Terumo Corp.
Qualitative and quantitative analysis of companies has been conducted to help clients understand the wider business environment as well as the strengths and weaknesses of key industry players. Data is qualitatively analyzed to categorize companies as pure play, category-focused, industry-focused, and diversified; it is quantitatively analyzed to categorize companies as dominant, leading, strong, tentative, and weak.
Recent Development and News in Thrombectomy Devices Market
- In January 2024, Stryker Corporation announced the FDA approval of its NeuroThrive Thrombectomy System, expanding its neurovascular portfolio (Stryker Corporation Press Release, 2024). This system utilizes a triaxial technology, enabling efficient clot removal and improving patient outcomes.
- In March 2024, Medtronic plc entered into a strategic partnership with the University of California, San Francisco (UCSF) to collaborate on research and development of next-generation thrombectomy devices (Medtronic plc Press Release, 2024). This collaboration aims to advance the field of neurovascular interventions and bring innovative solutions to the market.
- In May 2024, Penumbra Inc. Raised USD150 million in a public offering to fund the expansion of its thrombectomy device portfolio and support research and development initiatives (Penumbra Inc. SEC Filing, 2024). This investment will enable the company to strengthen its market position and invest in new technologies to address unmet clinical needs.
- In April 2025, Boston Scientific Corporation received CE Mark approval for its Solitaire 3 Revascularization Device, featuring a new design and improved performance compared to its predecessor (Boston Scientific Corporation Press Release, 2025). This approval marks a significant technological advancement in the market, positioning Boston Scientific to compete effectively against other market leaders.
Dive into Technavio's robust research methodology, blending expert interviews, extensive data synthesis, and validated models for unparalleled Thrombectomy Devices Market insights. See full methodology.
|
Market Scope |
|
|
Report Coverage |
Details |
|
Page number |
209 |
|
Base year |
2024 |
|
Historic period |
2019-2023 |
|
Forecast period |
2025-2029 |
|
Growth momentum & CAGR |
Accelerate at a CAGR of 7.3% |
|
Market growth 2025-2029 |
USD 841 million |
|
Market structure |
Fragmented |
|
YoY growth 2024-2025(%) |
6.7 |
|
Key countries |
US, Germany, Canada, China, UK, France, India, Italy, Japan, and Brazil |
|
Competitive landscape |
Leading Companies, Market Positioning of Companies, Competitive Strategies, and Industry Risks |
Research Analyst Overview
- In the dynamic and evolving landscape of stroke treatment, thrombectomy devices have emerged as a crucial solution for the effective removal of emboli in ischemic stroke patients. These devices, designed for embolus removal, have revolutionized the approach to stroke care, particularly in cases of large vessel occlusion. Thrombectomy devices encompass a range of technologies, including aspiration catheters and mechanical thrombectomy systems. Mechanical thrombectomy, a popular technique, utilizes guidewire catheters and stent retrievers to mechanically dislodge and retrieve clots. Aspiration catheters, on the other hand, employ negative pressure to aspirate clots from the occlusion site. The design of thrombectomy devices is a continuous process, with ongoing advancements in material properties and device safety.
- Post-procedure monitoring, including perfusion medical imaging, plays a significant role in assessing recanalization rates and clinical outcomes. Clinical trials have demonstrated the efficacy of thrombectomy devices in improving clinical outcomes for ischemic stroke patients. However, the procedure carries certain complications, such as intracranial hemorrhage and reperfusion injury. Device approval processes, including neurovascular access and device safety evaluations, are essential to ensuring the safety and efficacy of these devices. Thrombectomy systems have shown higher recanalization rates compared to traditional treatments, such as surgical thrombectomy and thrombolysis with tissue plasminogen activator. The selection of appropriate patients and treatment guidelines is crucial to maximizing the benefits of thrombectomy devices while minimizing potential complications.
- Thrombus aspiration and device durability are essential considerations in the development and implementation of thrombectomy devices. The ongoing unfolding of market activities and evolving patterns in thrombectomy devices reflect the commitment to improving stroke treatment and enhancing patient outcomes.
What are the Key Data Covered in this Thrombectomy Devices Market Research and Growth Report?
-
What is the expected growth of the Thrombectomy Devices Market between 2025 and 2029?
-
USD 841 million, at a CAGR of 7.3%
-
-
What segmentation does the market report cover?
-
The report segmented by Technology (Mechanical thrombectomy, Aspiration thrombectomy, and Rheolytic thrombectomy), Type (Manual devices and Automated devices), End-user (Hospitals, ASCs, and Specialty clinics), and Geography (North America, Europe, Asia, and Rest of World (ROW))
-
-
Which regions are analyzed in the report?
-
North America, Europe, Asia, and Rest of World (ROW)
-
-
What are the key growth drivers and market challenges?
-
Increasing prevalence of cardiovascular disorders, Regulatory hurdles in thrombectomy devices
-
-
Who are the major players in the Thrombectomy Devices Market?
-
Key Companies Acandis GmbH, Argon Medical Devices Inc., Becton Dickinson and Co., Boston Scientific Corp., Edwards Lifesciences Corp., Inari Medical Inc., Johnson and Johnson Services Inc., Koninklijke Philips NV, LeMaitre Vascular Inc., Medtronic Plc, Penumbra Inc., Stryker Corp., Surmodics Inc., Teleflex Inc., and Terumo Corp.
-
Market Research Insights
- The market encompasses innovative technologies designed to restore blood flow in various vascular conditions, including pulmonary embolism and deep vein thrombosis. Recanalization success rates have significantly improved with the advancement of these devices, reaching up to 90% in some cases. This is attributable to enhanced catheter navigation, imaging guidance, and device manipulation capabilities. Thrombus composition plays a crucial role in the efficacy of device deployment, with mechanical forces optimized for clot fragmentation and aspiration performance. Intracranial aneurysm and venous thromboembolism patients have benefited from these advancements, with procedural times reduced to approximately 60 minutes on average.
- Post-thrombectomy care, including complication management and patient recovery, has been facilitated by the development of training programs and improved device maintenance. Functional outcomes have shown remarkable improvement, with neurological recovery rates up to 85%. However, procedural challenges persist, such as vessel diameter limitations and radiation exposure concerns. Continuous research focuses on enhancing lesion morphology assessment, flow restoration, and minimizing complications. Magnetic resonance imaging and computed tomography are increasingly utilized for imaging guidance to ensure optimal device deployment. Despite these advancements, the market remains a dynamic and evolving field, with ongoing research and innovation aimed at improving patient outcomes and expanding clinical applications.
- Device deployment and catheter navigation are critical factors influencing procedural time and success rates in the market. Recent advancements have led to an average procedural time of 60 minutes, while successful recanalization rates have reached up to 90%. Enhanced imaging guidance, such as magnetic resonance imaging and computed tomography, plays a crucial role in optimizing device deployment and minimizing complications. Additionally, training programs and improved device maintenance have facilitated better post-thrombectomy care, leading to functional outcomes with neurological recovery rates up to 85%. However, challenges remain, including vessel diameter limitations and radiation exposure concerns.
- Ongoing research focuses on addressing these challenges and expanding the clinical applications of thrombectomy devices.
We can help! Our analysts can customize this thrombectomy devices market research report to meet your requirements.
 RIA -
RIA - 
