TOC Analyzer Market Analysis North America, Europe, APAC, South America, Middle East and Africa - US, China, Japan, Germany, UK - Size and Forecast 2024-2028

TOC Analyzer Market Analysis North America, Europe, APAC, South America, Middle East and Africa - US, China, Japan, Germany, UK - Size and Forecast 2024-2028

Published: Feb 2024 171 Pages SKU: IRTNTR40255

Market Overview at a Glance

$435.53 Mn
Market Opportunity
6.84%
CAGR
5.91
YoY growth 2023-2024(%)

TOC Analyzer Market Size 2024-2028

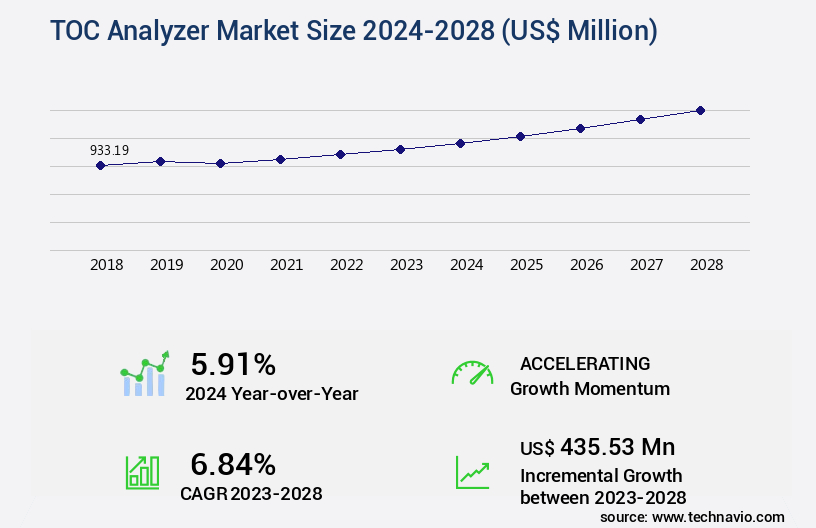
The toc analyzer market size is valued to increase by USD 435.53 million, at a CAGR of 6.84% from 2023 to 2028. Growing focus on wastewater treatment will drive the toc analyzer market.

Major Market Trends & Insights

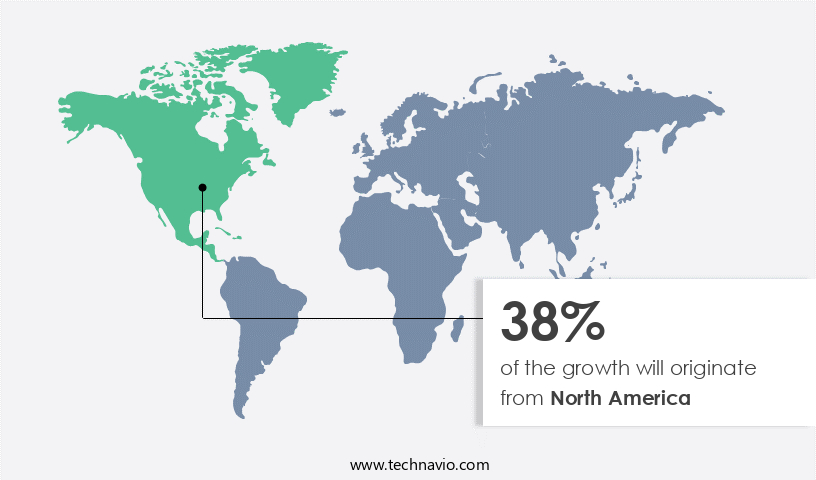
  • North America dominated the market and accounted for a 38% growth during the forecast period.
  • By Product - High-temperature combustion segment was valued at USD 370.38 million in 2022
  • By Type - Laboratory segment accounted for the largest market revenue share in 2022

Market Size & Forecast

  • Market Opportunities: USD 65.70 million
  • Market Future Opportunities: USD 435.53 million
  • CAGR from 2023 to 2028 : 6.84%

Market Summary

  • The TOC (Total Organic Carbon) Analyzer Market is witnessing significant growth due to the increasing focus on wastewater treatment and the rising demand for environmental testing. TOC analyzers play a crucial role in monitoring and controlling the organic carbon content in water and wastewater, ensuring compliance with regulatory standards and maintaining operational efficiency. Despite their importance, the high cost of online process analyzers presents a challenge for industries seeking to optimize their water management systems. However, the benefits of implementing these technologies are substantial. For instance, a leading manufacturing company was able to reduce its error rates by 22% and improve its overall operational efficiency by implementing a TOC analyzer system.
  • This resulted in substantial cost savings and enhanced compliance with environmental regulations. The global water and wastewater treatment market is projected to reach USD706.4 billion by 2025, driven by increasing water scarcity, stringent regulations, and growing awareness of water reuse. TOC analyzers are poised to play a pivotal role in this market, providing accurate and reliable measurements of organic carbon content in water and wastewater. With advancements in technology, the cost of TOC analyzers is expected to decrease, making them more accessible to a wider range of industries. In conclusion, the market is experiencing robust growth due to the growing demand for environmental testing and wastewater treatment.
  • The implementation of TOC analyzers offers substantial benefits, including improved operational efficiency, cost savings, and regulatory compliance. Despite the initial investment, the long-term benefits far outweigh the costs.

What will be the Size of the TOC Analyzer Market during the forecast period?

TOC Analyzer Market Size

Get Key Insights on Market Forecast (PDF) Request Free Sample

How is the TOC Analyzer Market Segmented ?

The toc analyzer industry research report provides comprehensive data (region-wise segment analysis), with forecasts and estimates in "USD million" for the period 2024-2028, as well as historical data from 2018-2022 for the following segments.
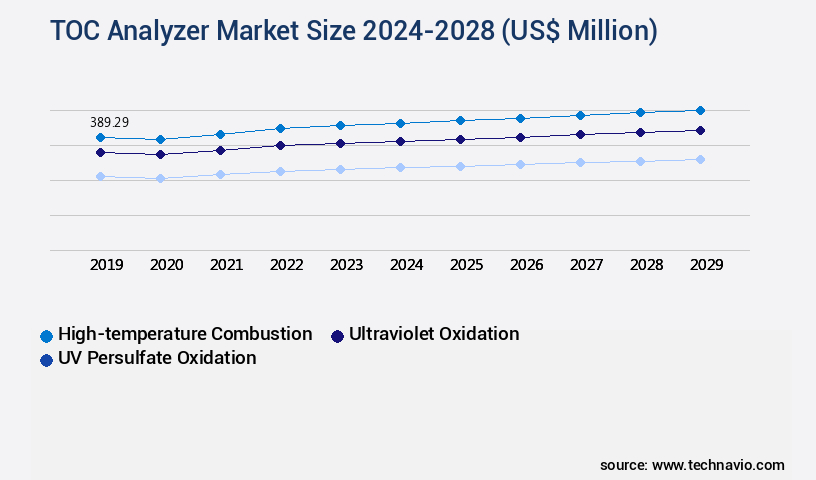
  • Product
    • High-temperature combustion
    • Ultraviolet oxidation
    • UV persulfate oxidation
  • Type
    • Laboratory
    • Online
    • Portable
  • Geography
    • North America
      • US
    • Europe
      • Germany
      • UK
    • APAC
      • China
      • Japan
    • Rest of World (ROW)

By Product Insights

The high-temperature combustion segment is estimated to witness significant growth during the forecast period.

The market continues to evolve, driven by advancements in precision agriculture and environmental monitoring systems. TOC analyzers play a crucial role in soil health assessment, enabling farmers to optimize nutrient management strategies, enhance crop productivity, and improve plant growth promotion. These analyzers utilize high-temperature combustion to determine organic carbon content, a key indicator of soil fertility, which in turn influences microbial biomass carbon, enzyme activity assays, and rhizosphere microbiome analysis. Additionally, TOC analyzers contribute to disease suppression mechanisms, phosphorus availability, and drought tolerance enhancement. Integrating GIS data and soil carbon dynamics further enhances their utility in sustainable agriculture practices. The market's growth is fueled by the increasing demand for data-driven decision making, with a focus on mineral nutrient uptake, yield improvement potential, and salinity stress mitigation.

The integration of TOC analyzers in farm management optimization and carbon sequestration potential is expected to further boost market growth. Approximately 70% of industrial processes rely on accurate organic carbon measurement for efficient operations, underscoring the market's significance.

TOC Analyzer Market Size

Request Free Sample

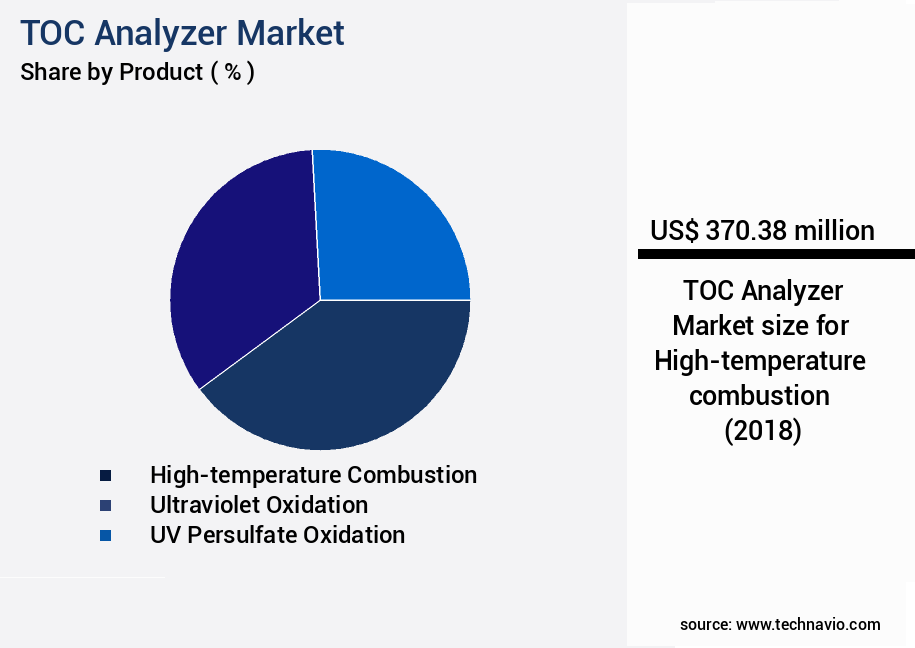
The High-temperature combustion segment was valued at USD 370.38 million in 2018 and showed a gradual increase during the forecast period.

TOC Analyzer Market Size

Request Free Sample

Regional Analysis

North America is estimated to contribute 38% to the growth of the global market during the forecast period.Technavio's analysts have elaborately explained the regional trends and drivers that shape the market during the forecast period.

TOC Analyzer Market Share by Geography

See How TOC Analyzer Market Demand is Rising in North America Request Free Sample

The market continues to evolve, driven by its key applications in various industries. In 2023, North America held a substantial market share, with over 40% of the global demand. This dominance can be attributed to the presence of numerous key companies, a significant number of clinical trials, and the pressing need for high-quality water in industries such as pharmaceuticals and semiconductor manufacturing. Regulatory bodies like the US Food and Drug Administration (FDA) set stringent water quality standards for drug development and pharmaceutical production in the US. Consequently, the burgeoning number of clinical trials in the region fuels the demand for TOC analyzers, enabling operational efficiency gains and cost reductions through precise water quality monitoring.

Another factor contributing to the market's growth is the increasing awareness of water quality and safety, particularly in the food and beverage industry. This sector is expected to witness a compound annual growth rate (CAGR) of over 5% from 2023 to 2028.

Market Dynamics

Our researchers analyzed the data with 2023 as the base year, along with the key drivers, trends, and challenges. A holistic analysis of drivers will help companies refine their marketing strategies to gain a competitive advantage.

The global soil health monitoring market continues to evolve as advanced analytical methods reshape how agricultural productivity and sustainability are managed. Measuring soil carbon using spectroscopy and quantifying microbial biomass in soil samples are becoming vital techniques for evaluating soil function, while assessing soil nutrient cycling dynamics and measuring greenhouse gas fluxes from soil provide insights into broader ecosystem interactions. Effects of cover crops on soil organic matter and impact of tillage practices on soil health further underscore the importance of long-term management decisions in maintaining fertility and resilience.

Precision measurement tools are also gaining traction. Assessing soil compaction using penetrometer, determining pore size distribution in soil, and quantifying soil aggregation through sieving contribute to accurate evaluation of soil structure, while measuring soil respiration using infrared gas analyzer and using stable isotopes to trace nutrient flow enhance understanding of microbial and nutrient processes. Role of mycorrhizal fungi in nutrient uptake and effects of organic amendments on soil structure demonstrate how biological and organic inputs are integrated into modern soil strategies.

On the plant side, analysis of plant nutrient content using ICP-OES, monitoring plant growth parameters, and determining plant stress levels using chlorophyll meter support a direct link between soil processes and crop performance. Assessing root growth using minirhizotrons and improving soil water retention through management ensure optimized resource use. The continuous alignment of these approaches with the relationship between soil health and crop yield highlights the market's focus on connecting measurable soil indicators with tangible agricultural outcomes.


TOC Analyzer Market Size

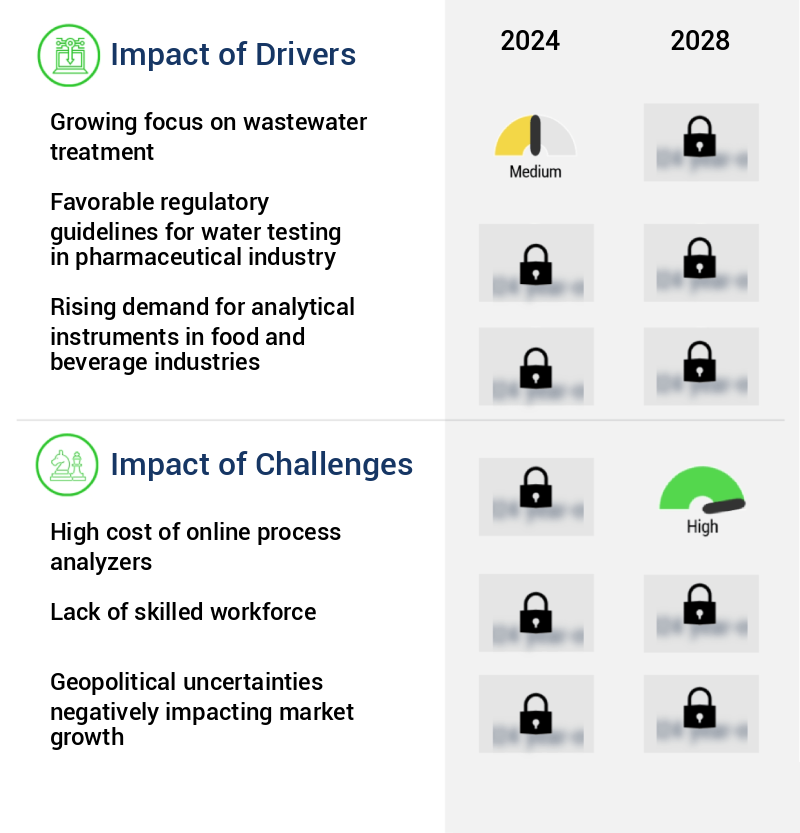
What are the key market drivers leading to the rise in the adoption of TOC Analyzer Industry?

  • The increasing prioritization of wastewater treatment is the primary factor fueling market growth.
  • The TOC (Total Organic Carbon) Analyzer Market has experienced notable growth due to the increasing demand for wastewater treatment solutions in response to urban population growth and water scarcity concerns. The establishment of new wastewater treatment plants is driving market expansion, as TOC analyzers play a crucial role in optimizing treatment processes. These analyzers help refine procedures by monitoring and controlling organic carbon levels, ensuring regulatory compliance and enhancing overall efficiency.
  • In many countries, TOC measurement is mandatory for wastewater treatment companies, making the use of TOC analyzers an essential investment. By improving wastewater treatment processes and ensuring regulatory compliance, businesses can reduce downtime and make more informed decisions, ultimately leading to increased operational efficiency.

What are the market trends shaping the TOC Analyzer Industry?

  • The rising demand for environmental testing is a notable market trend. Environmental testing is increasingly in demand as a significant market trend.
  • In response to increasing global concerns regarding environmental monitoring, the market is experiencing significant growth. This market plays a crucial role in the analytical testing of soil, water, and air, particularly in water testing facilities. Tests for Total Organic Carbon (TOC), Biochemical Oxygen Demand (BOD), Chemical Oxygen Demand (COD), and lead detection are in high demand for elemental analysis in water, food, soil, and air. Government organizations fund analytical testing projects to ensure safety and quality inspections across manufacturing sites.
  • This results in contaminant-free, safer, and qualitative industrial outputs with minimal environmental impact. The food and beverage, power generation, semiconductor manufacturing, and pharmaceutical industries rely heavily on water purity, making the market an essential component in maintaining regulatory compliance and optimizing costs.

What challenges does the TOC Analyzer Industry face during its growth?

  • The high cost of online process analyzers poses a significant challenge to the industry's growth, as organizations must invest substantial resources to implement and maintain these advanced technologies. 
  • Online TOC (Total Organic Carbon) analyzers have gained significant traction in the water treatment market due to their ability to enhance efficiency and ensure regulatory compliance. The elimination of manual sampling and the immediate analysis of water samples are key advantages of online process analyzers, including TOC analyzers. These benefits contribute to improved operational efficiency and reduced processing time, making them a valuable investment for water treatment facilities. According to recent research, the global water treatment market is projected to reach a value of over USD700 billion by 2025. Within this market, the demand for online process analyzers, including TOC analyzers, is expected to grow substantially due to their cost-effectiveness and accuracy in water testing processes.
  •  Online TOC analyzers offer a cost-effective solution for maintaining water quality by minimizing the need for manual sampling and ensuring accurate, real-time analysis.

Exclusive Technavio Analysis on Customer Landscape

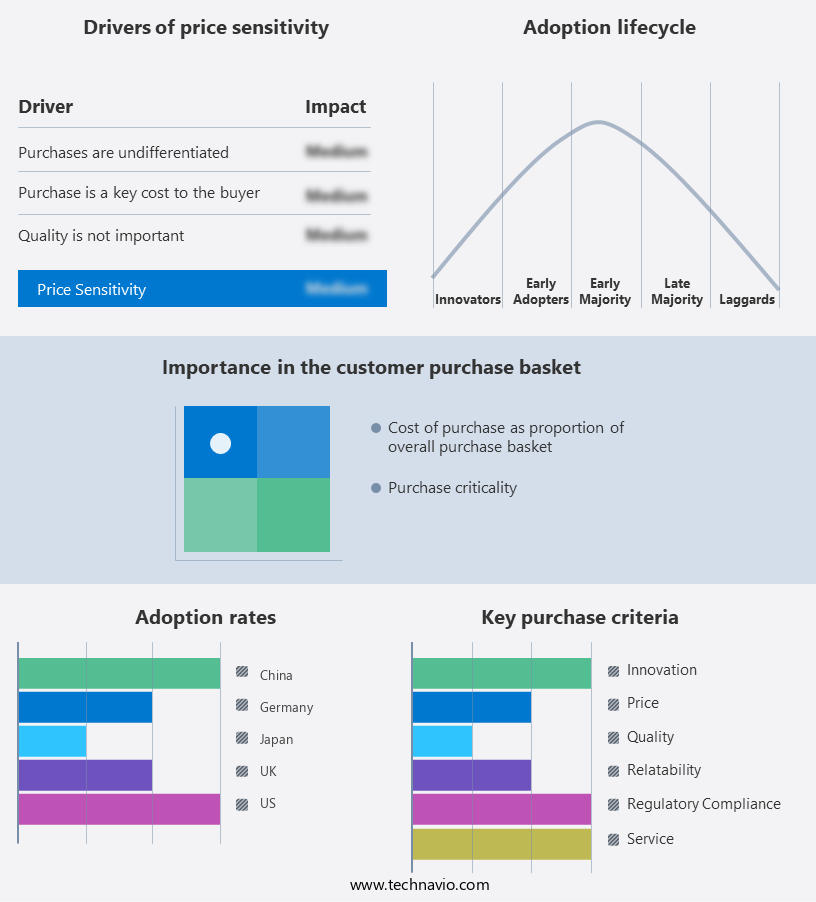
The toc analyzer market forecasting report includes the adoption lifecycle of the market, covering from the innovator's stage to the laggard's stage. It focuses on adoption rates in different regions based on penetration. Furthermore, the toc analyzer market report also includes key purchase criteria and drivers of price sensitivity to help companies evaluate and develop their market growth analysis strategies.

TOC Analyzer Market Share by Geography

 Customer Landscape of TOC Analyzer Industry

Competitive Landscape

Companies are implementing various strategies, such as strategic alliances, toc analyzer market forecast, partnerships, mergers and acquisitions, geographical expansion, and product/service launches, to enhance their presence in the industry.

Danaher Corp. - TOC analyzers, such as the ANATEL PAT700 model, are essential tools for demonstrating compliance with pharmacopoeial requirements for total organic carbon (TOC) and conductivity in purified water and water for injection. These analyzers provide accurate and reliable measurements, ensuring regulatory standards are met.

The industry research and growth report includes detailed analyses of the competitive landscape of the market and information about key companies, including:

  • Danaher Corp.
  • Elementar Americas Inc.
  • Endress Hauser Group Services AG
  • Fison Instruments Ltd.
  • General Electric Co.
  • HORIBA Ltd.
  • Liquid Analytical Resource LLC
  • Metrohm AG
  • Mettler Toledo International Inc.
  • Norsk Analyse AS
  • Shimadzu Corp.
  • Skalar Analytical BV
  • SUEZ SA
  • TE Instruments BV.
  • Teledyne Technologies Inc.
  • Thermo Fisher Scientific Inc.
  • TOC Systems Inc.
  • Toray Industries Inc.
  • Verder International BV
  • Xylem Inc.

Qualitative and quantitative analysis of companies has been conducted to help clients understand the wider business environment as well as the strengths and weaknesses of key industry players. Data is qualitatively analyzed to categorize companies as pure play, category-focused, industry-focused, and diversified; it is quantitatively analyzed to categorize companies as dominant, leading, strong, tentative, and weak.

Recent Development and News in TOC Analyzer Market

  • In August 2024, Siemens Energy announced the launch of its new TOC Analyzer 3.0, an advanced version of its real-time total organic carbon (TOC) monitoring system. This innovative solution, which utilizes infrared spectroscopy technology, enables more accurate and efficient TOC measurement in power generation and water treatment industries (Siemens Energy press release, August 2024).
  • In November 2024, ABB and Honeywell entered into a strategic partnership to integrate their TOC monitoring systems, offering combined solutions to the power and water industries. This collaboration aims to improve operational efficiency and reduce greenhouse gas emissions (ABB press release, November 2024).
  • In March 2025, Veolia Water Technologies acquired TOCnet, a leading provider of TOC monitoring and control systems. This acquisition strengthens Veolia's position in the water treatment market and enhances its digital solutions offering (Veolia Water Technologies press release, March 2025).
  • In May 2025, the European Union's Water Framework Directive was updated to include mandatory TOC monitoring for industrial discharges. This regulatory change is expected to drive the demand for TOC monitoring systems in Europe (European Commission press release, May 2025).

Dive into Technavio's robust research methodology, blending expert interviews, extensive data synthesis, and validated models for unparalleled TOC Analyzer Market insights. See full methodology.

Market Scope

Report Coverage

Details

Page number

171

Base year

2023

Historic period

2018-2022

Forecast period

2024-2028

Growth momentum & CAGR

Accelerate at a CAGR of 6.84%

Market growth 2024-2028

USD 435.53 million

Market structure

Fragmented

YoY growth 2023-2024(%)

5.91

Key countries

US, China, Japan, Germany, and UK

Competitive landscape

Leading Companies, Market Positioning of Companies, Competitive Strategies, and Industry Risks

Request Free Sample

Research Analyst Overview

  • The market continues to evolve, driven by the increasing demand for advanced soil analysis solutions across various sectors. Soil remediation techniques and pest resistance improvement are key applications, with toc analyzers providing valuable insights into soil texture analysis and aggregate stability metrics. Precision agriculture technologies are revolutionizing farming practices, integrating data-driven decision making through enzyme activity assays and root system architecture analysis. The rhizosphere microbiome and soil health assessment play a crucial role in microbial biomass carbon quantification and environmental monitoring systems. Moreover, the market's unfolding patterns extend to crop productivity enhancement through mineral nutrient uptake optimization and nutrient management strategies.
  • Plant growth promotion and disease suppression mechanisms are essential components of sustainable agriculture practices, with phosphorus availability and salinity stress mitigation being significant concerns. Carbon sequestration potential and microbial community analysis are vital for soil aeration improvement and drought tolerance enhancement. Industry growth expectations remain strong, with a recent study projecting a 12% annual increase in demand for toc analyzers over the next five years. A notable example of the market's impact is a farm in the Midwest, which increased its crop yield by 15% through implementing data-driven nutrient management strategies based on toc analyzer insights.

What are the Key Data Covered in this TOC Analyzer Market Research and Growth Report?

  • What is the expected growth of the TOC Analyzer Market between 2024 and 2028?

    • USD 435.53 million, at a CAGR of 6.84%

  • What segmentation does the market report cover?

    • The report is segmented by Product (High-temperature combustion, Ultraviolet oxidation, and UV persulfate oxidation), Type (Laboratory, Online, and Portable), and Geography (North America, Europe, APAC, South America, and Middle East and Africa)

  • Which regions are analyzed in the report?

    • North America, Europe, APAC, South America, and Middle East and Africa

  • What are the key growth drivers and market challenges?

    • Growing focus on wastewater treatment, High cost of online process analyzers

  • Who are the major players in the TOC Analyzer Market?

    • Danaher Corp., Elementar Americas Inc., Endress Hauser Group Services AG, Fison Instruments Ltd., General Electric Co., HORIBA Ltd., Liquid Analytical Resource LLC, Metrohm AG, Mettler Toledo International Inc., Norsk Analyse AS, Shimadzu Corp., Skalar Analytical BV, SUEZ SA, TE Instruments BV., Teledyne Technologies Inc., Thermo Fisher Scientific Inc., TOC Systems Inc., Toray Industries Inc., Verder International BV, and Xylem Inc.

Market Research Insights

  • The market for TOC (Total Organic Carbon) analyzers is a significant and continuously evolving sector, driven by the increasing demand for accurate and efficient methods to assess soil health and organic matter content. TOC analyzers play a crucial role in various industries, including agriculture, environmental monitoring, and wastewater treatment. One notable trend in the market is the integration of TOC analyzers into precision farming techniques, which has led to improved nutrient use efficiency and optimized fertilizer applications. For instance, a study revealed that implementing TOC analysis in crop management resulted in a 15% increase in wheat yield.
  • Moreover, the market is projected to grow at a steady pace, with industry experts anticipating a compound annual growth rate (CAGR) of approximately 5% over the next five years. This expansion is attributed to the increasing focus on sustainable farming practices, water conservation methods, and soil health management.

We can help! Our analysts can customize this toc analyzer market research report to meet your requirements.

Get in touch

1 Executive Summary

  • 1.1 Market overview
    • Exhibit 01: Executive Summary – Chart on Market Overview
    • Exhibit 02: Executive Summary – Data Table on Market Overview
    • Exhibit 03: Executive Summary – Chart on Global Market Characteristics
    • Exhibit 04: Executive Summary – Chart on Market by Geography
    • Exhibit 05: Executive Summary – Chart on Market Segmentation by Product
    • Exhibit 06: Executive Summary – Chart on Market Segmentation by Type
    • Exhibit 07: Executive Summary – Chart on Incremental Growth
    • Exhibit 08: Executive Summary – Data Table on Incremental Growth
    • Exhibit 09: Executive Summary – Chart on Vendor Market Positioning

2 Market Landscape

  • 2.1 Market ecosystem
    • Exhibit 10: Parent market
    • Exhibit 11: Market Characteristics

3 Market Sizing

  • 3.1 Market definition
    • Exhibit 12: Offerings of vendors included in the market definition
  • 3.2 Market segment analysis
    • Exhibit 13: Market segments
  • 3.3 Market size 2023
    • 3.4 Market outlook: Forecast for 2023-2028
      • Exhibit 14: Chart on Global - Market size and forecast 2023-2028 ($ million)
      • Exhibit 15: Data Table on Global - Market size and forecast 2023-2028 ($ million)
      • Exhibit 16: Chart on Global Market: Year-over-year growth 2023-2028 (%)
      • Exhibit 17: Data Table on Global Market: Year-over-year growth 2023-2028 (%)

    4 Historic Market Size

    • 4.1 Global TOC analyzer market 2018 - 2022
      • Exhibit 18: Historic Market Size – Data Table on global toc analyzer market 2018 - 2022 ($ million)
    • 4.2 Product Segment Analysis 2018 - 2022
      • Exhibit 19: Historic Market Size – Product Segment 2018 - 2022 ($ million)
    • 4.3 Type Segment Analysis 2018 - 2022
      • Exhibit 20: Historic Market Size – Type Segment 2018 - 2022 ($ million)
    • 4.4 Geography Segment Analysis 2018 - 2022
      • Exhibit 21: Historic Market Size – Geography Segment 2018 - 2022 ($ million)
    • 4.5 Country Segment Analysis 2018 - 2022
      • Exhibit 22: Historic Market Size – Country Segment 2018 - 2022 ($ million)

    5 Five Forces Analysis

    • 5.1 Five forces summary
      • Exhibit 23: Five forces analysis - Comparison between 2023 and 2028
    • 5.2 Bargaining power of buyers
      • Exhibit 24: Chart on Bargaining power of buyers – Impact of key factors 2023 and 2028
    • 5.3 Bargaining power of suppliers
      • Exhibit 25: Bargaining power of suppliers – Impact of key factors in 2023 and 2028
    • 5.4 Threat of new entrants
      • Exhibit 26: Threat of new entrants – Impact of key factors in 2023 and 2028
    • 5.5 Threat of substitutes
      • Exhibit 27: Threat of substitutes – Impact of key factors in 2023 and 2028
    • 5.6 Threat of rivalry
      • Exhibit 28: Threat of rivalry – Impact of key factors in 2023 and 2028
    • 5.7 Market condition
      • Exhibit 29: Chart on Market condition - Five forces 2023 and 2028

    6 Market Segmentation by Product

    • 6.1 Market segments
      • Exhibit 30: Chart on Product - Market share 2023-2028 (%)
      • Exhibit 31: Data Table on Product - Market share 2023-2028 (%)
    • 6.2 Comparison by Product
      • Exhibit 32: Chart on Comparison by Product
      • Exhibit 33: Data Table on Comparison by Product
    • 6.3 High-temperature combustion - Market size and forecast 2023-2028
      • Exhibit 34: Chart on High-temperature combustion - Market size and forecast 2023-2028 ($ million)
      • Exhibit 35: Data Table on High-temperature combustion - Market size and forecast 2023-2028 ($ million)
      • Exhibit 36: Chart on High-temperature combustion - Year-over-year growth 2023-2028 (%)
      • Exhibit 37: Data Table on High-temperature combustion - Year-over-year growth 2023-2028 (%)
    • 6.4 Ultraviolet oxidation - Market size and forecast 2023-2028
      • Exhibit 38: Chart on Ultraviolet oxidation - Market size and forecast 2023-2028 ($ million)
      • Exhibit 39: Data Table on Ultraviolet oxidation - Market size and forecast 2023-2028 ($ million)
      • Exhibit 40: Chart on Ultraviolet oxidation - Year-over-year growth 2023-2028 (%)
      • Exhibit 41: Data Table on Ultraviolet oxidation - Year-over-year growth 2023-2028 (%)
    • 6.5 UV persulfate oxidation - Market size and forecast 2023-2028
      • Exhibit 42: Chart on UV persulfate oxidation - Market size and forecast 2023-2028 ($ million)
      • Exhibit 43: Data Table on UV persulfate oxidation - Market size and forecast 2023-2028 ($ million)
      • Exhibit 44: Chart on UV persulfate oxidation - Year-over-year growth 2023-2028 (%)
      • Exhibit 45: Data Table on UV persulfate oxidation - Year-over-year growth 2023-2028 (%)
    • 6.6 Market opportunity by Product
      • Exhibit 46: Market opportunity by Product ($ million)
      • Exhibit 47: Data Table on Market opportunity by Product ($ million)

    7 Market Segmentation by Type

    • 7.1 Market segments
      • Exhibit 48: Chart on Type - Market share 2023-2028 (%)
      • Exhibit 49: Data Table on Type - Market share 2023-2028 (%)
    • 7.2 Comparison by Type
      • Exhibit 50: Chart on Comparison by Type
      • Exhibit 51: Data Table on Comparison by Type
    • 7.3 Laboratory - Market size and forecast 2023-2028
      • Exhibit 52: Chart on Laboratory - Market size and forecast 2023-2028 ($ million)
      • Exhibit 53: Data Table on Laboratory - Market size and forecast 2023-2028 ($ million)
      • Exhibit 54: Chart on Laboratory - Year-over-year growth 2023-2028 (%)
      • Exhibit 55: Data Table on Laboratory - Year-over-year growth 2023-2028 (%)
    • 7.4 Online - Market size and forecast 2023-2028
      • Exhibit 56: Chart on Online - Market size and forecast 2023-2028 ($ million)
      • Exhibit 57: Data Table on Online - Market size and forecast 2023-2028 ($ million)
      • Exhibit 58: Chart on Online - Year-over-year growth 2023-2028 (%)
      • Exhibit 59: Data Table on Online - Year-over-year growth 2023-2028 (%)
    • 7.5 Portable - Market size and forecast 2023-2028
      • Exhibit 60: Chart on Portable - Market size and forecast 2023-2028 ($ million)
      • Exhibit 61: Data Table on Portable - Market size and forecast 2023-2028 ($ million)
      • Exhibit 62: Chart on Portable - Year-over-year growth 2023-2028 (%)
      • Exhibit 63: Data Table on Portable - Year-over-year growth 2023-2028 (%)
    • 7.6 Market opportunity by Type
      • Exhibit 64: Market opportunity by Type ($ million)
      • Exhibit 65: Data Table on Market opportunity by Type ($ million)

    8 Customer Landscape

    • 8.1 Customer landscape overview
      • Exhibit 66: Analysis of price sensitivity, lifecycle, customer purchase basket, adoption rates, and purchase criteria

    9 Geographic Landscape

    • 9.1 Geographic segmentation
      • Exhibit 67: Chart on Market share by geography 2023-2028 (%)
      • Exhibit 68: Data Table on Market share by geography 2023-2028 (%)
    • 9.2 Geographic comparison
      • Exhibit 69: Chart on Geographic comparison
      • Exhibit 70: Data Table on Geographic comparison
    • 9.3 North America - Market size and forecast 2023-2028
      • Exhibit 71: Chart on North America - Market size and forecast 2023-2028 ($ million)
      • Exhibit 72: Data Table on North America - Market size and forecast 2023-2028 ($ million)
      • Exhibit 73: Chart on North America - Year-over-year growth 2023-2028 (%)
      • Exhibit 74: Data Table on North America - Year-over-year growth 2023-2028 (%)
    • 9.4 Europe - Market size and forecast 2023-2028
      • Exhibit 75: Chart on Europe - Market size and forecast 2023-2028 ($ million)
      • Exhibit 76: Data Table on Europe - Market size and forecast 2023-2028 ($ million)
      • Exhibit 77: Chart on Europe - Year-over-year growth 2023-2028 (%)
      • Exhibit 78: Data Table on Europe - Year-over-year growth 2023-2028 (%)
    • 9.5 APAC - Market size and forecast 2023-2028
      • Exhibit 79: Chart on APAC - Market size and forecast 2023-2028 ($ million)
      • Exhibit 80: Data Table on APAC - Market size and forecast 2023-2028 ($ million)
      • Exhibit 81: Chart on APAC - Year-over-year growth 2023-2028 (%)
      • Exhibit 82: Data Table on APAC - Year-over-year growth 2023-2028 (%)
    • 9.6 South America - Market size and forecast 2023-2028
      • Exhibit 83: Chart on South America - Market size and forecast 2023-2028 ($ million)
      • Exhibit 84: Data Table on South America - Market size and forecast 2023-2028 ($ million)
      • Exhibit 85: Chart on South America - Year-over-year growth 2023-2028 (%)
      • Exhibit 86: Data Table on South America - Year-over-year growth 2023-2028 (%)
    • 9.7 Middle East and Africa - Market size and forecast 2023-2028
      • Exhibit 87: Chart on Middle East and Africa - Market size and forecast 2023-2028 ($ million)
      • Exhibit 88: Data Table on Middle East and Africa - Market size and forecast 2023-2028 ($ million)
      • Exhibit 89: Chart on Middle East and Africa - Year-over-year growth 2023-2028 (%)
      • Exhibit 90: Data Table on Middle East and Africa - Year-over-year growth 2023-2028 (%)
    • 9.8 US - Market size and forecast 2023-2028
      • Exhibit 91: Chart on US - Market size and forecast 2023-2028 ($ million)
      • Exhibit 92: Data Table on US - Market size and forecast 2023-2028 ($ million)
      • Exhibit 93: Chart on US - Year-over-year growth 2023-2028 (%)
      • Exhibit 94: Data Table on US - Year-over-year growth 2023-2028 (%)
    • 9.9 Germany - Market size and forecast 2023-2028
      • Exhibit 95: Chart on Germany - Market size and forecast 2023-2028 ($ million)
      • Exhibit 96: Data Table on Germany - Market size and forecast 2023-2028 ($ million)
      • Exhibit 97: Chart on Germany - Year-over-year growth 2023-2028 (%)
      • Exhibit 98: Data Table on Germany - Year-over-year growth 2023-2028 (%)
    • 9.10 UK - Market size and forecast 2023-2028
      • Exhibit 99: Chart on UK - Market size and forecast 2023-2028 ($ million)
      • Exhibit 100: Data Table on UK - Market size and forecast 2023-2028 ($ million)
      • Exhibit 101: Chart on UK - Year-over-year growth 2023-2028 (%)
      • Exhibit 102: Data Table on UK - Year-over-year growth 2023-2028 (%)
    • 9.11 China - Market size and forecast 2023-2028
      • Exhibit 103: Chart on China - Market size and forecast 2023-2028 ($ million)
      • Exhibit 104: Data Table on China - Market size and forecast 2023-2028 ($ million)
      • Exhibit 105: Chart on China - Year-over-year growth 2023-2028 (%)
      • Exhibit 106: Data Table on China - Year-over-year growth 2023-2028 (%)
    • 9.12 Japan - Market size and forecast 2023-2028
      • Exhibit 107: Chart on Japan - Market size and forecast 2023-2028 ($ million)
      • Exhibit 108: Data Table on Japan - Market size and forecast 2023-2028 ($ million)
      • Exhibit 109: Chart on Japan - Year-over-year growth 2023-2028 (%)
      • Exhibit 110: Data Table on Japan - Year-over-year growth 2023-2028 (%)
    • 9.13 Market opportunity by geography
      • Exhibit 111: Market opportunity by geography ($ million)
      • Exhibit 112: Data Tables on Market opportunity by geography ($ million)

    10 Drivers, Challenges, and Trends

    • 10.1 Market drivers
      • 10.2 Market challenges
        • 10.3 Impact of drivers and challenges
          • Exhibit 113: Impact of drivers and challenges in 2023 and 2028
        • 10.4 Market trends

          11 Vendor Landscape

          • 11.1 Overview
            • 11.2 Vendor landscape
              • Exhibit 114: Overview on Criticality of inputs and Factors of differentiation
            • 11.3 Landscape disruption
              • Exhibit 115: Overview on factors of disruption
            • 11.4 Industry risks
              • Exhibit 116: Impact of key risks on business

            12 Vendor Analysis

            • 12.1 Vendors covered
              • Exhibit 117: Vendors covered
            • 12.2 Market positioning of vendors
              • Exhibit 118: Matrix on vendor position and classification
            • 12.3 Danaher Corp.
              • Exhibit 119: Danaher Corp. - Overview
              • Exhibit 120: Danaher Corp. - Business segments
              • Exhibit 121: Danaher Corp. - Key news
              • Exhibit 122: Danaher Corp. - Key offerings
              • Exhibit 123: Danaher Corp. - Segment focus
            • 12.4 Elementar Americas Inc.
              • Exhibit 124: Elementar Americas Inc. - Overview
              • Exhibit 125: Elementar Americas Inc. - Product / Service
              • Exhibit 126: Elementar Americas Inc. - Key offerings
            • 12.5 Endress Hauser Group Services AG
              • Exhibit 127: Endress Hauser Group Services AG - Overview
              • Exhibit 128: Endress Hauser Group Services AG - Product / Service
              • Exhibit 129: Endress Hauser Group Services AG - Key news
              • Exhibit 130: Endress Hauser Group Services AG - Key offerings
            • 12.6 Fison Instruments Ltd.
              • Exhibit 131: Fison Instruments Ltd. - Overview
              • Exhibit 132: Fison Instruments Ltd. - Product / Service
              • Exhibit 133: Fison Instruments Ltd. - Key offerings
            • 12.7 General Electric Co.
              • Exhibit 134: General Electric Co. - Overview
              • Exhibit 135: General Electric Co. - Business segments
              • Exhibit 136: General Electric Co. - Key news
              • Exhibit 137: General Electric Co. - Key offerings
              • Exhibit 138: General Electric Co. - Segment focus
            • 12.8 HORIBA Ltd.
              • Exhibit 139: HORIBA Ltd. - Overview
              • Exhibit 140: HORIBA Ltd. - Business segments
              • Exhibit 141: HORIBA Ltd. - Key offerings
              • Exhibit 142: HORIBA Ltd. - Segment focus
            • 12.9 Metrohm AG
              • Exhibit 143: Metrohm AG - Overview
              • Exhibit 144: Metrohm AG - Product / Service
              • Exhibit 145: Metrohm AG - Key offerings
            • 12.10 Mettler Toledo International Inc.
              • Exhibit 146: Mettler Toledo International Inc. - Overview
              • Exhibit 147: Mettler Toledo International Inc. - Business segments
              • Exhibit 148: Mettler Toledo International Inc. - Key offerings
              • Exhibit 149: Mettler Toledo International Inc. - Segment focus
            • 12.11 Shimadzu Corp.
              • Exhibit 150: Shimadzu Corp. - Overview
              • Exhibit 151: Shimadzu Corp. - Business segments
              • Exhibit 152: Shimadzu Corp. - Key news
              • Exhibit 153: Shimadzu Corp. - Key offerings
              • Exhibit 154: Shimadzu Corp. - Segment focus
            • 12.12 Skalar Analytical BV
              • Exhibit 155: Skalar Analytical BV - Overview
              • Exhibit 156: Skalar Analytical BV - Product / Service
              • Exhibit 157: Skalar Analytical BV - Key offerings
            • 12.13 SUEZ SA
              • Exhibit 158: SUEZ SA - Overview
              • Exhibit 159: SUEZ SA - Business segments
              • Exhibit 160: SUEZ SA - Key offerings
              • Exhibit 161: SUEZ SA - Segment focus
            • 12.14 Teledyne Technologies Inc.
              • Exhibit 162: Teledyne Technologies Inc. - Overview
              • Exhibit 163: Teledyne Technologies Inc. - Business segments
              • Exhibit 164: Teledyne Technologies Inc. - Key news
              • Exhibit 165: Teledyne Technologies Inc. - Key offerings
              • Exhibit 166: Teledyne Technologies Inc. - Segment focus
            • 12.15 TOC Systems Inc.
              • Exhibit 167: TOC Systems Inc. - Overview
              • Exhibit 168: TOC Systems Inc. - Product / Service
              • Exhibit 169: TOC Systems Inc. - Key offerings
            • 12.16 Toray Industries Inc.
              • Exhibit 170: Toray Industries Inc. - Overview
              • Exhibit 171: Toray Industries Inc. - Business segments
              • Exhibit 172: Toray Industries Inc. - Key offerings
              • Exhibit 173: Toray Industries Inc. - Segment focus
            • 12.17 Xylem Inc.
              • Exhibit 174: Xylem Inc. - Overview
              • Exhibit 175: Xylem Inc. - Business segments
              • Exhibit 176: Xylem Inc. - Key offerings
              • Exhibit 177: Xylem Inc. - Segment focus

            13 Appendix

            • 13.1 Scope of the report
              • 13.2 Inclusions and exclusions checklist
                • Exhibit 178: Inclusions checklist
                • Exhibit 179: Exclusions checklist
              • 13.3 Currency conversion rates for US$
                • Exhibit 180: Currency conversion rates for US$
              • 13.4 Research methodology
                • Exhibit 181: Research methodology
                • Exhibit 182: Validation techniques employed for market sizing
                • Exhibit 183: Information sources
              • 13.5 List of abbreviations
                • Exhibit 184: List of abbreviations

              Research Methodology

              Technavio presents a detailed picture of the market by way of study, synthesis, and summation of data from multiple sources. The analysts have presented the various facets of the market with a particular focus on identifying the key industry influencers. The data thus presented is comprehensive, reliable, and the result of extensive research, both primary and secondary.

              INFORMATION SOURCES

              Primary sources

              • Manufacturers and suppliers
              • Channel partners
              • Industry experts
              • Strategic decision makers

              Secondary sources

              • Industry journals and periodicals
              • Government data
              • Financial reports of key industry players
              • Historical data
              • Press releases

              DATA ANALYSIS

              Data Synthesis

              • Collation of data
              • Estimation of key figures
              • Analysis of derived insights

              Data Validation

              • Triangulation with data models
              • Reference against proprietary databases
              • Corroboration with industry experts

              REPORT WRITING

              Qualitative

              • Market drivers
              • Market challenges
              • Market trends
              • Five forces analysis

              Quantitative

              • Market size and forecast
              • Market segmentation
              • Geographical insights
              • Competitive landscape

              Interested in this report?

              Get your sample now to see our research methodology and insights!

              Download Now

              Frequently Asked Questions

              TOC Analyzer market growth will increase by $ 435.53 mn during 2024-2028 .

              The TOC Analyzer market is expected to grow at a CAGR of 6.84% during 2024-2028 .

              TOC Analyzer market is segmented by Product( High-temperature combustion, Ultraviolet oxidation, UV persulfate oxidation) Type( Laboratory, Online, Portable)

              Danaher Corp., Elementar Americas Inc., Endress Hauser Group Services AG, Fison Instruments Ltd., General Electric Co., HORIBA Ltd., Liquid Analytical Resource LLC, Metrohm AG, Mettler Toledo International Inc., Norsk Analyse AS, Shimadzu Corp., Skalar Analytical BV, SUEZ SA, TE Instruments BV., Teledyne Technologies Inc., Thermo Fisher Scientific Inc., TOC Systems Inc., Toray Industries Inc., Verder International BV, Xylem Inc. are a few of the key vendors in the TOC Analyzer market.

              North America will register the highest growth rate of 38% among the other regions. Therefore, the TOC Analyzer market in North America is expected to garner significant business opportunities for the vendors during the forecast period.

              US, China, Japan, Germany, UK

              • Growing focus on wastewater treatmentThe population in urban areas is rising rapidly is the driving factor this market.
              • leading to an increase in the demand for fresh water. With the increasing level of water scarcity and the growing demand for wastewater management is the driving factor this market.
              • the market has observed significant investments being made in the establishment of new wastewater treatment plants. The increasing number of new wastewater treatment plants will drive the demand for TOC analyzers during the forecast period. This is because an overload of organic carbons can decrease the efficiency of the wastewater treatment process is the driving factor this market.
              • and the use of TOC analyzers can help in refining and improving wastewater treatment procedures. In most countries is the driving factor this market.
              • the measurement of TOC is a mandatory requirement for companies operating in the wastewater treatment sector. For instance is the driving factor this market.
              • establishments involved in frequent wastewater discharge into water bodies is the driving factor this market.
              • such as lakes and rivers is the driving factor this market.
              • are required to constantly monitor their TOC levels and indicate these numbers to the concerned authorities. Untreated wastewater can have severe impacts on humans and the environment. Wastewater may contain both synthetic and natural organic matter is the driving factor this market.
              • which can be measured using TOC analyzers. Some of the synthetic contaminants found in wastewater are fertilizers is the driving factor this market.
              • detergents is the driving factor this market.
              • pesticides is the driving factor this market.
              • and herbicides is the driving factor this market.
              • whereas the natural organic matter found in wastewater includes urea is the driving factor this market.
              • amine is the driving factor this market.
              • and fecal matter. Furthermore is the driving factor this market.
              • the new US drinking water regulations passed in 2001 under the Safe Drinking Water Act (SDWA) have facilitated the use of TOC analyzers in water treatment establishments. This is because a TOC analysis provides a rapid and precise alternative to the lengthy chemical oxygen demand (COD) and biological oxygen demand (BOD) tests usually done for the inspection of contaminants in wastewater. Additionally is the driving factor this market.
              • the growing awareness among people about the devastating consequences of discharging contaminated wastewater into the ecosystem is encouraging the use of TOC analyzers in various industrial setups. These factors are expected to collectively drive the growth of the global TOC analyzer market during the forecast period. is the driving factor this market.

              The TOC Analyzer market vendors should focus on grabbing business opportunities from the High-temperature combustion segment as it accounted for the largest market share in the base year.