Process Analyzer Market Analysis APAC, North America, Europe, Middle East and Africa, South America - China, US, Japan, Germany, UK - Size and Forecast 2024-2028

Process Analyzer Market Analysis APAC, North America, Europe, Middle East and Africa, South America - China, US, Japan, Germany, UK - Size and Forecast 2024-2028

Published: Jun 2024 164 Pages SKU: IRTNTR72812

Market Overview at a Glance

$2.08 B
Market Opportunity
4.5%
CAGR
4.23
YoY growth 2023-2024(%)

Process Analyzer Market Size 2024-2028 

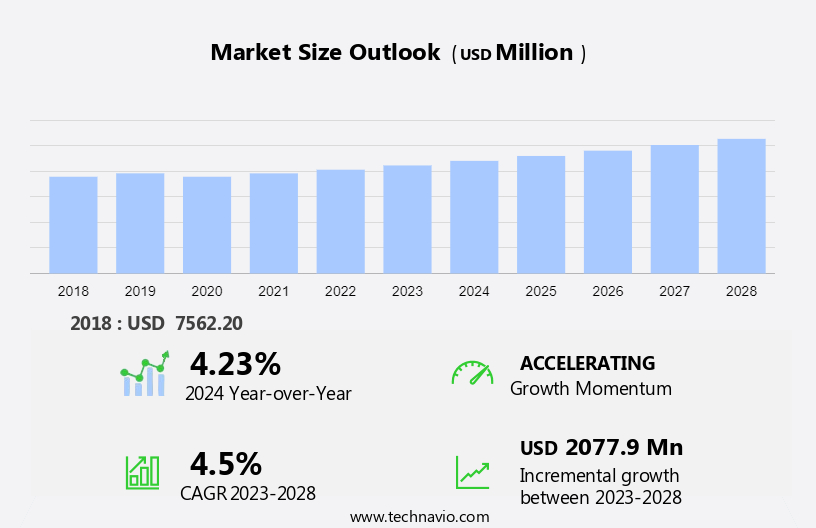
The process analyzer market size is forecast to increase by USD 2.08 billion at a CAGR of 4.5% between 2023 and 2028.

  • Process analyzers are used in laboratories and remote areas for various applications, including calibration, sensor placement, process control, maintenance, and troubleshooting.   Market trends include the increasing demand for portable process analyzers due to their ease of installation and flexibility. However, the adoption rate is relatively low in small-scale industrial facilities in developing countries. Market growth is driven by capacity additions in major end-user industries, including pharmaceuticals, food and beverage, and chemicals. companies are focusing on enhancing the cooling capabilities and power efficiency of process analyzers to meet the stringent environmental regulations. Protected cabinets are becoming a standard feature to ensure the accuracy and reliability of process measurements. The market is expected to grow steadily, with a focus on reducing power consumption and maintaining consistent temperature control.

What will be the Size of the Market During the Forecast Period?

Process Analyzer Market Size

 Request Free Sample

  • The market plays a pivotal role in ensuring the quality and efficiency of pharmaceutical manufacturing and bioprocessing. These technologies are essential for monitoring and optimizing various parameters in the production process, including pressure, flow rates, chemical composition, and water quality. In the context of pharmaceutical manufacturing, process analyzers are instrumental in maintaining the desired quality of drugs. The need for precise control and monitoring is especially crucial in light of freshwater availability concerns, climatic changes, and weather patterns that can impact water supply. Moreover, process analyzers help mitigate the risks associated with water pollution and ensure public health safety.
  • Bioprocessing, a critical aspect of the pharmaceutical industry, also benefits significantly from process analyzers. These technologies enable the optimization of processes, ensuring energy efficiency, and enhancing overall productivity. In addition, process analyzers are essential for monitoring hazardous substances and ensuring compliance with documentation and reporting requirements. Process analyzers are also indispensable in remote areas where access to advanced analytical instruments may be limited. These technologies offer the advantage of real-time monitoring and remote access, making them ideal for applications in such locations. Calibration is a crucial aspect of process analyzer usage. Regular calibration ensures accurate and reliable measurements, which is essential for maintaining the desired quality of pharmaceutical products and bioprocessing outputs.

How is this market segmented and which is the largest segment?

The market research report provides comprehensive data (region-wise segment analysis), with forecasts and estimates in "USD million" for the period 2024-2028, as well as historical data from 2018-2022 for the following segments.

  • End-user
    • Oil and gas
    • Chemical and petrochemical
    • Healthcare
    • Water and wastewater treatment
    • Others
  • Geography
    • APAC
      • China
      • Japan
    • North America
      • US
    • Europe
      • Germany
      • UK
    • Middle East and Africa
    • South America

By End-user Insights

  • The oil and gas segment is estimated to witness significant growth during the forecast period.

Process analyzers play a crucial role in the oil and gas industry, particularly in the upstream and midstream sectors. In the exploration phase of upstream operations, these analyzers are employed to identify the composition of various gases, including carbon dioxide, sulfur oxides, and nitrogen oxides. Accurate gas analysis is essential for ensuring safety, health, and environmental protection, as these gases can pose significant risks. Moving on to the midstream sector, process analyzers are indispensable in pipelines and liquefied natural gas (LNG) transportation. Their primary function is to prevent pipeline corrosion and ensure efficient LNG transportation. By monitoring the composition of the gas, process analyzers enable effective process control, maintenance, and troubleshooting, reducing operational costs and minimizing malfunctions.

Remote monitoring and calibration of process analyzers are increasingly gaining popularity due to their ability to provide real-time data from even the most remote areas. This not only enhances operational efficiency but also facilitates timely maintenance and troubleshooting, further reducing downtime and operational costs. Incorporating advanced analyzer technology into process control systems is a smart investment for oil and gas companies, ensuring optimal performance and reducing the risk of potential issues. By leveraging process analyzers, companies can maintain a competitive edge in the industry while ensuring safety, efficiency, and environmental compliance.

Process Analyzer Market Size

Get a glance at the market report of share of various segments Request Free Sample

The oil and gas segment was valued at USD 1.79 billion in 2018 and showed a gradual increase during the forecast period.

Regional Analysis

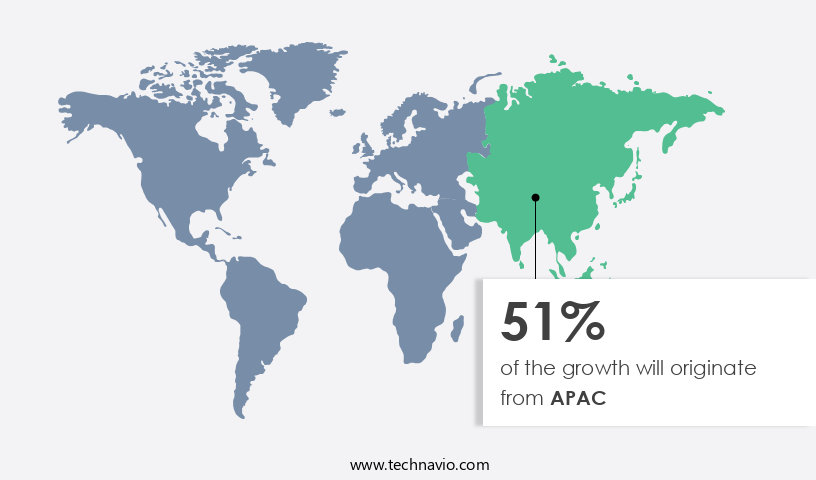
  • APAC is estimated to contribute 51% to the growth of the global market during the forecast period.

Technavio's analysts have elaborately explained the regional trends and drivers that shape the market during the forecast period.

Process Analyzer Market Share by Geography

For more insights on the market share of various regions Request Free Sample

In Asia-Pacific (APAC), home to approximately 60% of the global population, increasing urbanization and rising disposable incomes are leading to significant growth in various sectors. Developing countries such as China, India, Indonesia, Pakistan, Bangladesh, and Vietnam are witnessing increased investments in transportation and warehousing capacity, enhancing the supply chain infrastructure. The demand and availability of processed food and personal care products have risen due to these factors, leading to increased investments in the processed food and fast-moving consumer goods (FMCG) sectors. This trend underscores the growing importance of sustainability and efficiency in the production and distribution of processed food and FMCG products in APAC.

Market Dynamics

Our researchers analyzed the data with 2023 as the base year, along with the key drivers, trends, and challenges. A holistic analysis of drivers will help companies refine their marketing strategies to gain a competitive advantage.

What are the key market drivers leading to the rise in adoption of Process Analyzer Market?

Capacity additions in major end-user industries is the key driver of the market.

  • Process analyzers play a crucial role in various industries, particularly in sectors such as pharmaceuticals and biotech, which are integral to drug development and bioprocessing. The increasing research and development activities in these fields are driving the demand for analytical instruments to ensure product quality and adherence to regulatory standards. Additionally, factors such as freshwater availability, climatic changes, and weather patterns, as well as pollution, necessitate the use of process analyzers to monitor and maintain optimal process conditions. In the industries such as healthcare, food and beverages, and petrochemicals are significant consumers of process analyzers.
  • Petrochemicals are derived from fossil fuels like crude oil, natural gas, and coal, as well as agricultural produce such as corn and sugarcane. The two major classes of petrochemicals are olefins and aromatics. Olefins include ethylene, propylene, and methane, while aromatics consist of benzene, toluene, and xylene. These chemicals are used to manufacture a multitude of industrial and consumer products, including fertilizers, dyes, paints, solvents, auto parts, home appliances, and detergents. To maintain the quality and efficiency of these manufacturing processes, process analyzers are essential tools.

What are the market trends shaping the Process Analyzer Market?

Companies introducing portable process analyzers is the upcoming trend in the market.

  • Process analyzers are essential tools used in various industries for measuring and monitoring emissions, temperature, and other process parameters. companies are focusing on developing portable versions of these analyzers, such as TECsoft's testing and emission compliance software for Testo SE & Co. KGaA's testo 350 portable emission analyzer. This software enhances the testing and data handling capabilities of the portable analyzer, increasing its utility for end-users. Portable analyzers enable on-site sample analysis, eliminating the need to transport samples to laboratories.
  • On-site analysis provides more accurate results than laboratory analysis due to the absence of transportation-related variables. Protected cabinets and cooling capabilities are essential features of process analyzers, ensuring power efficiency and reducing power consumption. Compliance with environmental regulations is crucial, and process analyzers play a significant role in measuring pollutant levels and ensuring adherence to emission standards. With the increasing focus on reducing emissions and improving process efficiency, the demand for process analyzers is expected to grow.

What challenges does Process Analyzer Market face during its growth?

Low adoption by small-scale industrial facilities in developing countries is a key challenge affecting market growth.

  • Process analyzers play a crucial role in ensuring the quality and safety of water sources, particularly in large industrial facilities such as water supply systems, rainwater harvesting, and wastewater treatment. These facilities face stringent requirements from their clients, including households and businesses, to provide safe drinking water and maintain optimal production costs. For instance, a sugar manufacturer supplying sugar to a processed food company must adhere to specific sugar quality standards set by their clients. In contrast, a sugar manufacturer selling sugar in an unregulated market does not have the same level of scrutiny.
  • Gas analyzers, a type of process analyzer, are essential tools in ensuring the accuracy and reliability of water treatment processes. Innovations in process analyzer technology continue to improve efficiency and effectiveness in water supply, rainwater harvesting, and wastewater treatment. The use of process analyzers in these industries not only ensures consistent product quality but also helps in maintaining regulatory compliance.  Large industrial facilities, including those supplying water to households and businesses, require consistent quality output and optimum production costs due to their service level agreements (SLAs) with their clients. For instance, a sugar manufacturer selling sugar to a processed food company must adhere to specific sugar quality standards set by their client.

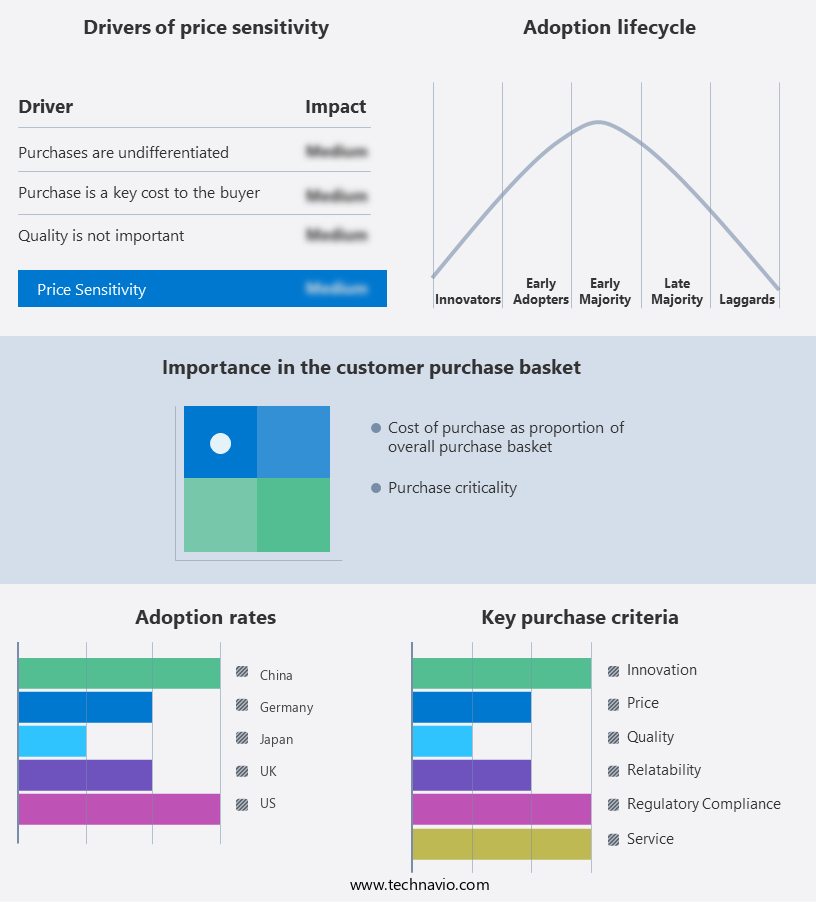
Exclusive Customer Landscape

The market forecasting report includes the adoption lifecycle of the market, covering from the innovator's stage to the laggard's stage. It focuses on adoption rates in different regions based on penetration. Furthermore, the market report also includes key purchase criteria and drivers of price sensitivity to help companies evaluate and develop their market growth analysis strategies.

Process Analyzer Market Share by Geography

 Customer Landscape

Key Companies & Market Insights

Companies are implementing various strategies, such as strategic alliances, market forecast, partnerships, mergers and acquisitions, geographical expansion, and product/service launches, to enhance their presence in the market. The market research and growth report includes detailed analyses of the competitive landscape of the market and information about key companies, including:

  • ABB Ltd.
  • Agilent Technologies Inc.
  • AMETEK Inc.
  • Aneolia SARL
  • Bruker Corp.
  • Danaher Corp.
  • Emerson Electric Co.
  • Endress Hauser Group Services AG
  • Honeywell International Inc.
  • KROHNE Messtechnik GmbH
  • Metrohm AG
  • Mettler Toledo International Inc.
  • Modcon Systems Ltd.
  • Perkin Elmer Inc.
  • Schneider Electric SE
  • Siemens AG
  • Spectris Plc
  • Teledyne Analytical Instruments
  • Testo SE and Co. KGaA
  • Thermo Fisher Scientific Inc.
  • Yokogawa Electric Corp.

Qualitative and quantitative analysis of companies has been conducted to help clients understand the wider business environment as well as the strengths and weaknesses of key market players. Data is qualitatively analyzed to categorize companies as pure play, category-focused, industry-focused, and diversified; it is quantitatively analyzed to categorize companies as dominant, leading, strong, tentative, and weak.

Research Analyst Overview

The market is witnessing significant growth due to the increasing demand for analytical instruments in various industries, including bioprocessing and pharmaceutical manufacturing. The need for ensuring quality and compliance with regulatory standards in these sectors is driving the adoption of process analyzers. Factors such as freshwater availability, climatic changes, and weather patterns are also influencing the market's growth, as process analyzers play a crucial role in monitoring water sources and ensuring safe drinking water. Process analyzers are essential for measuring temperature, pressure, flow rates, chemical composition, and other parameters in various industrial processes. They help in reducing operational costs by enabling real-time monitoring and predictive maintenance.

Furthermore, innovation and reliability are key factors that make process analyzers an attractive investment for industries. Gas analyzers, such as oxygen analyzers and combustion process analyzers, are gaining popularity due to their ability to monitor flammable gases and ensure combustion efficiency in boilers and reflow furnaces. Environmental regulations and the need for sustainability are also driving the demand for process analyzers in environmental monitoring applications. They offer features such as protected cabinets, cooling capabilities, power efficiency, and remote monitoring, making them an ideal choice for industries looking for accurate and reliable process measurements.

Market Scope

Report Coverage

Details

Page number

164

Base year

2023

Historic period

2018-2022

Forecast period

2024-2028

Growth momentum & CAGR

Accelerate at a CAGR of 4.5%

Market Growth 2024-2028

USD 2.08 billion

Market structure

Fragmented

YoY growth 2023-2024(%)

4.23

Key countries

China, US, Japan, Germany, and UK

Competitive landscape

Leading Companies, Market Positioning of Companies, Competitive Strategies, and Industry Risks

Request Free Sample

What are the Key Data Covered in this Market Research and Growth Report?

  • CAGR of the market during the forecast period
  • Detailed information on factors that will drive the market growth and forecasting between 2024 and 2028
  • Precise estimation of the size of the market  and its contribution of the market in focus to the parent market
  • Accurate predictions about upcoming market growth and trends and changes in consumer behaviour
  • Growth of the market across APAC, North America, Europe, Middle East and Africa, and South America
  • Thorough analysis of the market's competitive landscape and detailed information about companies
  • Comprehensive analysis of factors that will challenge the growth of market companies

We can help! Our analysts can customize this market research report to meet your requirements. Get in touch

1 Executive Summary

  • 1.1 Market overview
    • Executive Summary - Chart on Market Overview
    • Executive Summary - Data Table on Market Overview
    • Executive Summary - Chart on Global Market Characteristics
    • Executive Summary - Chart on Market by Geography
    • Executive Summary - Chart on Market Segmentation by End-user
    • Executive Summary - Chart on Incremental Growth
    • Executive Summary - Data Table on Incremental Growth
    • Executive Summary - Chart on Company Market Positioning

2 Market Landscape

  • 2.1 Market ecosystem
    • Parent Market
    • Data Table on - Parent Market
  • 2.2 Market characteristics
    • Market characteristics analysis
  • 2.3 Value chain analysis
    • Value Chain Analysis

3 Market Sizing

  • 3.1 Market definition
    • Offerings of companies included in the market definition
  • 3.2 Market segment analysis
    • Market segments
  • 3.3 Market size 2023
    • 3.4 Market outlook: Forecast for 2023-2028
      • Chart on Global - Market size and forecast 2023-2028 ($ million)
      • Data Table on Global - Market size and forecast 2023-2028 ($ million)
      • Chart on Global Market: Year-over-year growth 2023-2028 (%)
      • Data Table on Global Market: Year-over-year growth 2023-2028 (%)

    4 Historic Market Size

    • 4.1 Global Process Analyzer Market 2018 - 2022
      • Historic Market Size - Data Table on Global Process Analyzer Market 2018 - 2022 ($ million)
    • 4.2 End-user segment analysis 2018 - 2022
      • Historic Market Size - End-user Segment 2018 - 2022 ($ million)
    • 4.3 Geography segment analysis 2018 - 2022
      • Historic Market Size - Geography Segment 2018 - 2022 ($ million)
    • 4.4 Country segment analysis 2018 - 2022
      • Historic Market Size - Country Segment 2018 - 2022 ($ million)

    5 Five Forces Analysis

    • 5.1 Five forces summary
      • Five forces analysis - Comparison between 2023 and 2028
    • 5.2 Bargaining power of buyers
      • Bargaining power of buyers - Impact of key factors 2023 and 2028
    • 5.3 Bargaining power of suppliers
      • Bargaining power of suppliers - Impact of key factors in 2023 and 2028
    • 5.4 Threat of new entrants
      • Threat of new entrants - Impact of key factors in 2023 and 2028
    • 5.5 Threat of substitutes
      • Threat of substitutes - Impact of key factors in 2023 and 2028
    • 5.6 Threat of rivalry
      • Threat of rivalry - Impact of key factors in 2023 and 2028
    • 5.7 Market condition
      • Chart on Market condition - Five forces 2023 and 2028

    6 Market Segmentation by End-user

    • 6.1 Market segments
      • Chart on End-user - Market share 2023-2028 (%)
      • Data Table on End-user - Market share 2023-2028 (%)
    • 6.2 Comparison by End-user
      • Chart on Comparison by End-user
      • Data Table on Comparison by End-user
    • 6.3 Oil and gas - Market size and forecast 2023-2028
      • Chart on Oil and gas - Market size and forecast 2023-2028 ($ million)
      • Data Table on Oil and gas - Market size and forecast 2023-2028 ($ million)
      • Chart on Oil and gas - Year-over-year growth 2023-2028 (%)
      • Data Table on Oil and gas - Year-over-year growth 2023-2028 (%)
    • 6.4 Chemical and petrochemical - Market size and forecast 2023-2028
      • Chart on Chemical and petrochemical - Market size and forecast 2023-2028 ($ million)
      • Data Table on Chemical and petrochemical - Market size and forecast 2023-2028 ($ million)
      • Chart on Chemical and petrochemical - Year-over-year growth 2023-2028 (%)
      • Data Table on Chemical and petrochemical - Year-over-year growth 2023-2028 (%)
    • 6.5 Healthcare - Market size and forecast 2023-2028
      • Chart on Healthcare - Market size and forecast 2023-2028 ($ million)
      • Data Table on Healthcare - Market size and forecast 2023-2028 ($ million)
      • Chart on Healthcare - Year-over-year growth 2023-2028 (%)
      • Data Table on Healthcare - Year-over-year growth 2023-2028 (%)
    • 6.6 Water and wastewater treatment - Market size and forecast 2023-2028
      • Chart on Water and wastewater treatment - Market size and forecast 2023-2028 ($ million)
      • Data Table on Water and wastewater treatment - Market size and forecast 2023-2028 ($ million)
      • Chart on Water and wastewater treatment - Year-over-year growth 2023-2028 (%)
      • Data Table on Water and wastewater treatment - Year-over-year growth 2023-2028 (%)
    • 6.7 Others - Market size and forecast 2023-2028
      • Chart on Others - Market size and forecast 2023-2028 ($ million)
      • Data Table on Others - Market size and forecast 2023-2028 ($ million)
      • Chart on Others - Year-over-year growth 2023-2028 (%)
      • Data Table on Others - Year-over-year growth 2023-2028 (%)
    • 6.8 Market opportunity by End-user
      • Market opportunity by End-user ($ million)
      • Data Table on Market opportunity by End-user ($ million)

    7 Customer Landscape

    • 7.1 Customer landscape overview
      • Analysis of price sensitivity, lifecycle, customer purchase basket, adoption rates, and purchase criteria

    8 Geographic Landscape

    • 8.1 Geographic segmentation
      • Chart on Market share by geography 2023-2028 (%)
      • Data Table on Market share by geography 2023-2028 (%)
    • 8.2 Geographic comparison
      • Chart on Geographic comparison
      • Data Table on Geographic comparison
    • 8.3 APAC - Market size and forecast 2023-2028
      • Chart on APAC - Market size and forecast 2023-2028 ($ million)
      • Data Table on APAC - Market size and forecast 2023-2028 ($ million)
      • Chart on APAC - Year-over-year growth 2023-2028 (%)
      • Data Table on APAC - Year-over-year growth 2023-2028 (%)
    • 8.4 North America - Market size and forecast 2023-2028
      • Chart on North America - Market size and forecast 2023-2028 ($ million)
      • Data Table on North America - Market size and forecast 2023-2028 ($ million)
      • Chart on North America - Year-over-year growth 2023-2028 (%)
      • Data Table on North America - Year-over-year growth 2023-2028 (%)
    • 8.5 Europe - Market size and forecast 2023-2028
      • Chart on Europe - Market size and forecast 2023-2028 ($ million)
      • Data Table on Europe - Market size and forecast 2023-2028 ($ million)
      • Chart on Europe - Year-over-year growth 2023-2028 (%)
      • Data Table on Europe - Year-over-year growth 2023-2028 (%)
    • 8.6 Middle East and Africa - Market size and forecast 2023-2028
      • Chart on Middle East and Africa - Market size and forecast 2023-2028 ($ million)
      • Data Table on Middle East and Africa - Market size and forecast 2023-2028 ($ million)
      • Chart on Middle East and Africa - Year-over-year growth 2023-2028 (%)
      • Data Table on Middle East and Africa - Year-over-year growth 2023-2028 (%)
    • 8.7 South America - Market size and forecast 2023-2028
      • Chart on South America - Market size and forecast 2023-2028 ($ million)
      • Data Table on South America - Market size and forecast 2023-2028 ($ million)
      • Chart on South America - Year-over-year growth 2023-2028 (%)
      • Data Table on South America - Year-over-year growth 2023-2028 (%)
    • 8.8 China - Market size and forecast 2023-2028
      • Chart on China - Market size and forecast 2023-2028 ($ million)
      • Data Table on China - Market size and forecast 2023-2028 ($ million)
      • Chart on China - Year-over-year growth 2023-2028 (%)
      • Data Table on China - Year-over-year growth 2023-2028 (%)
    • 8.9 US - Market size and forecast 2023-2028
      • Chart on US - Market size and forecast 2023-2028 ($ million)
      • Data Table on US - Market size and forecast 2023-2028 ($ million)
      • Chart on US - Year-over-year growth 2023-2028 (%)
      • Data Table on US - Year-over-year growth 2023-2028 (%)
    • 8.10 Japan - Market size and forecast 2023-2028
      • Chart on Japan - Market size and forecast 2023-2028 ($ million)
      • Data Table on Japan - Market size and forecast 2023-2028 ($ million)
      • Chart on Japan - Year-over-year growth 2023-2028 (%)
      • Data Table on Japan - Year-over-year growth 2023-2028 (%)
    • 8.11 Germany - Market size and forecast 2023-2028
      • Chart on Germany - Market size and forecast 2023-2028 ($ million)
      • Data Table on Germany - Market size and forecast 2023-2028 ($ million)
      • Chart on Germany - Year-over-year growth 2023-2028 (%)
      • Data Table on Germany - Year-over-year growth 2023-2028 (%)
    • 8.12 UK - Market size and forecast 2023-2028
      • Chart on UK - Market size and forecast 2023-2028 ($ million)
      • Data Table on UK - Market size and forecast 2023-2028 ($ million)
      • Chart on UK - Year-over-year growth 2023-2028 (%)
      • Data Table on UK - Year-over-year growth 2023-2028 (%)
    • 8.13 Market opportunity by geography
      • Market opportunity by geography ($ million)
      • Data Tables on Market opportunity by geography ($ million)

    9 Drivers, Challenges, and Opportunity/Restraints

    • 9.1 Market drivers
      • 9.2 Market challenges
        • 9.3 Impact of drivers and challenges
          • Impact of drivers and challenges in 2023 and 2028
        • 9.4 Market opportunities/restraints

          10 Competitive Landscape

          • 10.1 Overview
            • 10.2 Competitive Landscape
              • Overview on criticality of inputs and factors of differentiation
            • 10.3 Landscape disruption
              • Overview on factors of disruption
            • 10.4 Industry risks
              • Impact of key risks on business

            11 Competitive Analysis

            • 11.1 Companies profiled
              • Companies covered
            • 11.2 Market positioning of companies
              • Matrix on companies position and classification
            • 11.3 ABB Ltd.
              • ABB Ltd. - Overview
              • ABB Ltd. - Business segments
              • ABB Ltd. - Key news
              • ABB Ltd. - Key offerings
              • ABB Ltd. - Segment focus
            • 11.4 Agilent Technologies Inc.
              • Agilent Technologies Inc. - Overview
              • Agilent Technologies Inc. - Business segments
              • Agilent Technologies Inc. - Key news
              • Agilent Technologies Inc. - Key offerings
              • Agilent Technologies Inc. - Segment focus
            • 11.5 AMETEK Inc.
              • AMETEK Inc. - Overview
              • AMETEK Inc. - Business segments
              • AMETEK Inc. - Key news
              • AMETEK Inc. - Key offerings
              • AMETEK Inc. - Segment focus
            • 11.6 Aneolia SARL
              • Aneolia SARL - Overview
              • Aneolia SARL - Product / Service
              • Aneolia SARL - Key offerings
            • 11.7 Bruker Corp.
              • Bruker Corp. - Overview
              • Bruker Corp. - Business segments
              • Bruker Corp. - Key news
              • Bruker Corp. - Key offerings
              • Bruker Corp. - Segment focus
            • 11.8 Danaher Corp.
              • Danaher Corp. - Overview
              • Danaher Corp. - Business segments
              • Danaher Corp. - Key news
              • Danaher Corp. - Key offerings
              • Danaher Corp. - Segment focus
            • 11.9 Emerson Electric Co.
              • Emerson Electric Co. - Overview
              • Emerson Electric Co. - Business segments
              • Emerson Electric Co. - Key news
              • Emerson Electric Co. - Key offerings
              • Emerson Electric Co. - Segment focus
            • 11.10 Endress Hauser Group Services AG
              • Endress Hauser Group Services AG - Overview
              • Endress Hauser Group Services AG - Product / Service
              • Endress Hauser Group Services AG - Key news
              • Endress Hauser Group Services AG - Key offerings
            • 11.11 Honeywell International Inc.
              • Honeywell International Inc. - Overview
              • Honeywell International Inc. - Business segments
              • Honeywell International Inc. - Key news
              • Honeywell International Inc. - Key offerings
              • Honeywell International Inc. - Segment focus
            • 11.12 KROHNE Messtechnik GmbH
              • KROHNE Messtechnik GmbH - Overview
              • KROHNE Messtechnik GmbH - Product / Service
              • KROHNE Messtechnik GmbH - Key news
              • KROHNE Messtechnik GmbH - Key offerings

            12 Appendix

            • 12.1 Scope of the report
              • 12.2 Inclusions and exclusions checklist
                • Inclusions checklist
                • Exclusions checklist
              • 12.3 Currency conversion rates for US$
                • Currency conversion rates for US$
              • 12.4 Research methodology
                • Research methodology
              • 12.5 Data procurement
                • Information sources
              • 12.6 Data validation
                • Data validation
              • 12.7 Validation techniques employed for market sizing
                • Validation techniques employed for market sizing
              • 12.8 Data synthesis
                • Data synthesis
              • 12.9 360 degree market analysis
                • 360 degree market analysis
              • 12.10 List of abbreviations
                • List of abbreviations

              Research Methodology

              Technavio presents a detailed picture of the market by way of study, synthesis, and summation of data from multiple sources. The analysts have presented the various facets of the market with a particular focus on identifying the key industry influencers. The data thus presented is comprehensive, reliable, and the result of extensive research, both primary and secondary.

              INFORMATION SOURCES

              Primary sources

              • Manufacturers and suppliers
              • Channel partners
              • Industry experts
              • Strategic decision makers

              Secondary sources

              • Industry journals and periodicals
              • Government data
              • Financial reports of key industry players
              • Historical data
              • Press releases

              DATA ANALYSIS

              Data Synthesis

              • Collation of data
              • Estimation of key figures
              • Analysis of derived insights

              Data Validation

              • Triangulation with data models
              • Reference against proprietary databases
              • Corroboration with industry experts

              REPORT WRITING

              Qualitative

              • Market drivers
              • Market challenges
              • Market trends
              • Five forces analysis

              Quantitative

              • Market size and forecast
              • Market segmentation
              • Geographical insights
              • Competitive landscape

              Interested in this report?

              Get your sample now to see our research methodology and insights!

              Download Now

              Frequently Asked Questions

              Process Analyzer market growth will increase by $ 2077.9 mn during 2024-2028.

              The Process Analyzer market is expected to grow at a CAGR of 4.5% during 2024-2028.

              Process Analyzer market is segmented by End-user( Oil and gas, Chemical and petrochemical, Healthcare, Water and wastewater treatment, Others)

              ABB Ltd., Agilent Technologies Inc., AMETEK Inc., Aneolia SARL, Bruker Corp., Danaher Corp., Emerson Electric Co., Endress Hauser Group Services AG, Honeywell International Inc., KROHNE Messtechnik GmbH, Metrohm AG, Mettler Toledo International Inc., Modcon Systems Ltd., Perkin Elmer Inc., Schneider Electric SE, Siemens AG, Spectris Plc, Teledyne Analytical Instruments, Testo SE and Co. KGaA, Thermo Fisher Scientific Inc., Yokogawa Electric Corp. are a few of the key vendors in the Process Analyzer market.

              APAC will register the highest growth rate of 51% among the other regions. Therefore, the Process Analyzer market in APAC is expected to garner significant business opportunities for the vendors during the forecast period.

              China, US, Japan, Germany, UK

              • Capacity additions in major end-user industriesProcess industries such as petrochemicals is the driving factor this market.
              • food and beverages is the driving factor this market.
              • and healthcare is the driving factor this market.
              • including pharmaceuticals and biotech is the driving factor this market.
              • are among the major end-user industries of process analyzers. Thus is the driving factor this market.
              • capacity additions in these industries are driving the demand for process analyzers.Petrochemicals: They are derived from fossil fuels such as crude oil is the driving factor this market.
              • natural gas is the driving factor this market.
              • and coal. Agricultural produce such as corn and sugarcane are also used to produce petrochemicals. Olefins and aromatics are the two major petrochemical classes. Olefins include petrochemicals such as ethylene is the driving factor this market.
              • propylene is the driving factor this market.
              • and methane is the driving factor this market.
              • and aromatics include benzene is the driving factor this market.
              • toluene is the driving factor this market.
              • and xylene. Petrochemicals are used to manufacture a range of industrial and consumer products such as fertilizers is the driving factor this market.
              • dyes is the driving factor this market.
              • paints is the driving factor this market.
              • solvents is the driving factor this market.
              • auto parts is the driving factor this market.
              • home appliances is the driving factor this market.
              • and detergents.The growing demand for industrial and consumer products results in capacity additions in the global petrochemical industry. For instance is the driving factor this market.
              • there is an increasing demand for fertilizers is the driving factor this market.
              • especially from China is the driving factor this market.
              • India is the driving factor this market.
              • and Brazil. The arable land is limited is the driving factor this market.
              • but the demand for food grains continues to grow. Similarly is the driving factor this market.
              • the growing focus on blending ethanol with gasoline or petrol is increasing the harvesting of crops such as corn and sugar cane. These crops are used to produce ethanol.Similarly is the driving factor this market.
              • increasing disposable household incomes in developing countries and resultant strengthening demand for automobiles is the driving factor this market.
              • home appliances is the driving factor this market.
              • and construction materials such as paints and dyes are augmenting investments in the petrochemical sector. The abundance of natural gas is the driving factor this market.
              • which is a cheap feedstock for the production of ethylene in North America is the driving factor this market.
              • and the ongoing economic transformation of the Middle East is the driving factor this market.
              • to reduce its economic dependence on crude oil export are also driving investments in petrochemical plants in North America and the Middle East.China and India is the driving factor this market.
              • to support their large manufacturing sector is the driving factor this market.
              • are also building their petrochemicals manufacturing capacities. A petrochemical production plant requires gas chromatographs is the driving factor this market.
              • spectrometers is the driving factor this market.
              • and thermal conductivity analyzers is the driving factor this market.
              • to name a few is the driving factor this market.
              • to monitor the chemical composition of the feedstock is the driving factor this market.
              • intermediate products is the driving factor this market.
              • and final products. The analyzers are also used to measure the concentration of carbon dioxide is the driving factor this market.
              • hydrogen is the driving factor this market.
              • and carbon monoxide during cracking and de-coke cycle processes.Food and beverages and healthcare: The food and beverages industry use oxygen and moisture process analyzers to ensure consistent quality is the driving factor this market.
              • taste is the driving factor this market.
              • and texture of processed food and beverages products. In addition is the driving factor this market.
              • high compliance with defined standards for chemical composition and physical properties also increases the shelf life of processed food and beverages. This drives the demand for process analyzers from the food and beverages industry. A secular trend of regulations for food safety is becoming increasingly stringent. This is also driving the adoption rate of process analyzers in the food and beverage industry. The industry is recording rapid expansion in developing countries wherein the growing disposable income and low penetration of processed food and beverages products are augmenting the demand for processed food and beverages.Most of the pharmaceutical and biotech facilities are heavily regulated to ensure the safety and efficacy of drugs and vaccines administered to patients. Thus is the driving factor this market.
              • process analysis methods such as ion chromatography is the driving factor this market.
              • near-infrared and Raman spectroscopy (NIRS) is the driving factor this market.
              • and photometry are used in the healthcare sector. The growing expenditure on health and wellness products and increasing incidences of lifestyle health conditions such as blood pressure and diabetes and epidemics such as swine flu and Ebola are driving investments in the pharmaceutical and biotech sectors.The growing demand for generic or over-the-counter (OTC) drugs across the globe are also driving investments in the pharmaceutical sector of China and India. The countries are generic drugs manufacturing hubs of the world. Thus is the driving factor this market.
              • capacity additions in major end-user industries will drive the market in forecast period. is the driving factor this market.

              The Process Analyzer market vendors should focus on grabbing business opportunities from the Oil and gas segment as it accounted for the largest market share in the base year.