
Trampoline Market Size 2026-2030
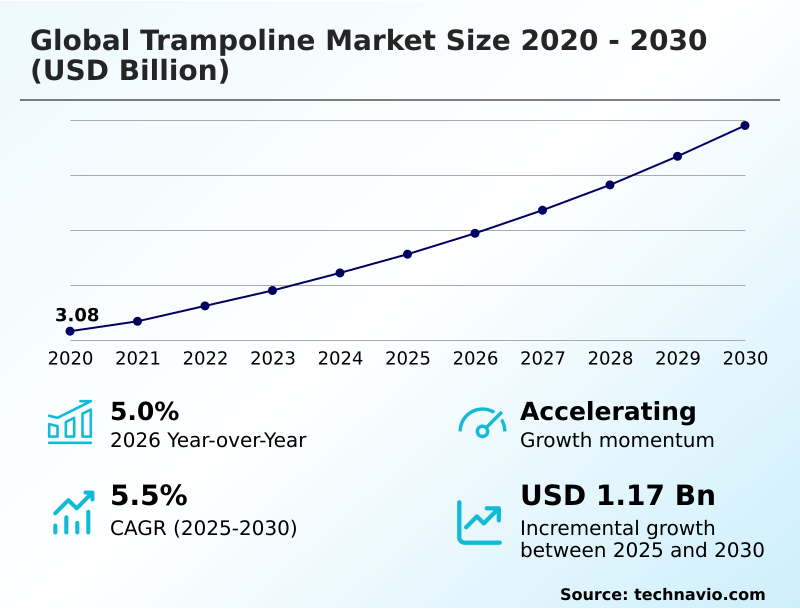
The Trampoline Market size was valued at USD 3.78 billion in 2025, growing at a CAGR of 5.5% during the forecast period 2026-2030.
Major Market Trends & Insights
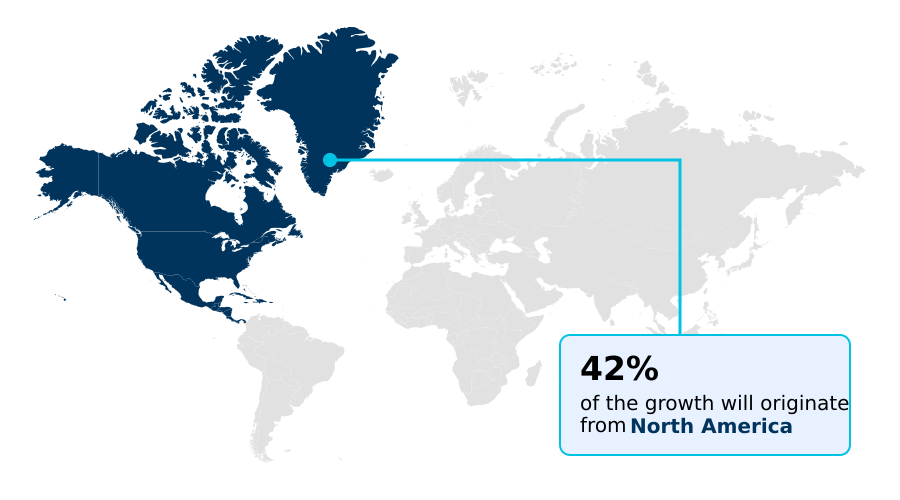
- North America dominated the market and accounted for a 41.8% growth during the forecast period.
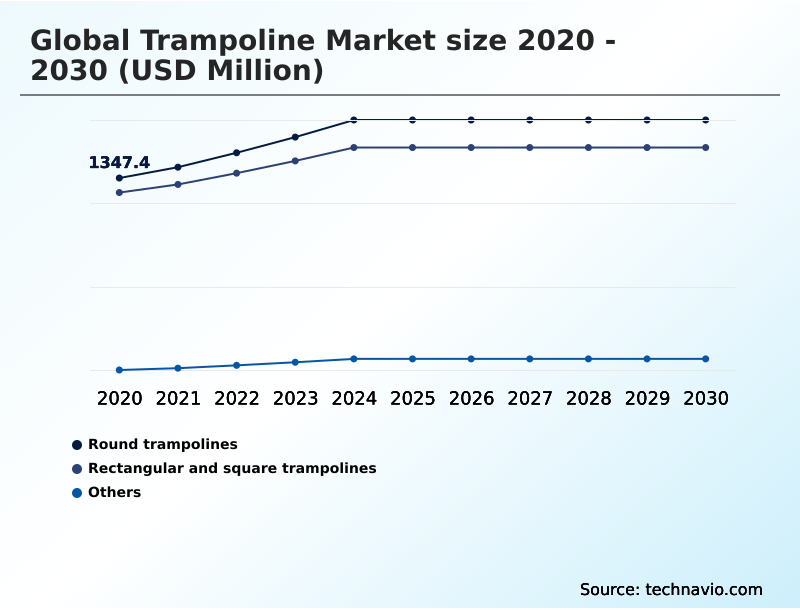
- By Product - Round trampolines segment was valued at USD 1.62 billion in 2024
- By End-user - Commercial segment accounted for the largest market revenue share in 2024
Market Size & Forecast
- Historic Market Opportunities 2020-2024: USD 1.88 billion
- Market Future Opportunities 2025-2030: USD 1.17 billion
- CAGR from 2025 to 2030 : 5.5%
Market Summary
- The trampoline market is defined by a distinct split between residential and commercial applications, with over 60% of revenue originating from the commercial sector's rapid expansion. A key driver is the growth of family entertainment centers, which require significant upfront investment in commercial-grade apparatus and accessories.
- For instance, a single new park's outfitting can involve sourcing several tons of galvanized steel frame components, presenting logistical challenges but ensuring large-volume orders for manufacturers. Conversely, the industry faces the challenge of supply chain volatility, where a 10% fluctuation in raw material costs for polypropylene jump mats can impact manufacturer margins by up to 4%.
- This dynamic forces companies to balance innovation in rebound performance and safety enclosure net design with stringent cost control and inventory management.
What will be the Size of the Trampoline Market during the forecast period?
Get Key Insights on Market Forecast (PDF) Request Free Sample
How is the Trampoline Market Segmented?
The trampoline industry research report provides comprehensive data (region-wise segment analysis), with forecasts and analysis for the period 2026-2030, as well as historical data from 2020-2024 for the following segments.
- Product
- Round trampolines
- Rectangular and square trampolines
- Others
- End-user
- Commercial
- Individual
- Distribution channel
- Offline
- Online
- Geography
- North America
- US
- Canada
- Mexico
- Europe
- Germany
- UK
- France
- APAC
- China
- Japan
- India
- Middle East and Africa
- UAE
- Saudi Arabia
- South Africa
- South America
- Brazil
- Argentina
- Rest of World (ROW)
- North America
How is the Trampoline Market Segmented by Product?
The round trampolines segment is estimated to witness significant growth during the forecast period.
The round trampolines segment holds a 45% market share, primarily due to inherent safety physics from its circular spring arrangement, which naturally directs users toward the center.
This design feature reduces the risk of frame collisions by over 30% compared to non-circular models, making it the preferred choice for family-oriented backyard recreation.
Manufacturers innovate within this geometry by focusing on weather-resistant padding and high-tensile springs to extend the product lifecycle. Recent trends show a shift toward premium aesthetic integration, with all-black designs and bundled value-added accessories like basketball hoops becoming standard.
The segment's dominance is reinforced by a streamlined manufacturing process, enabling more competitive pricing for recreational trampoline models aimed at mass-market consumers.
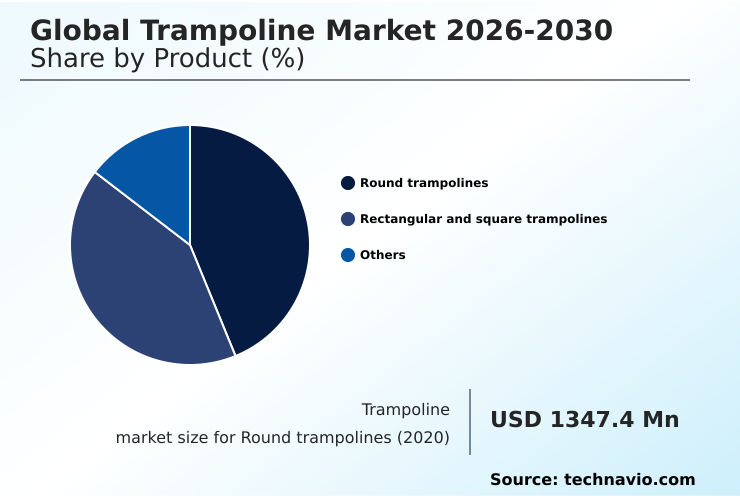
The Round trampolines segment was valued at USD 1.62 billion in 2024 and showed a gradual increase during the forecast period.
How demand for the Trampoline market is rising in the leading region?
North America is estimated to contribute 41.8% to the growth of the global market during the forecast period.Technavio’s analysts have elaborately explained the regional trends and drivers that shape the market during the forecast period.
See How Trampoline Market demand is rising in North America Request Free Sample
North America dominates the geographic landscape, contributing over 41% of the market share, driven by a mature commercial sector and high household penetration of recreational trampolines in countries like the US, which alone accounts for over USD 1.2 billion.
In contrast, the APAC region, representing 25% of the market, is the fastest-growing territory, with its market size expanding 1.2 times faster than Europe's.
This growth is fueled by the rapid development of indoor adventure park infrastructure in urban centers across China and India to meet the demands of a rising middle class.
Business strategies differ significantly, with North American firms focusing on franchise expansion and replacement cycles, while operators in APAC prioritize new installations and customer acquisition in previously untapped markets.
What are the key Drivers, Trends, and Challenges in the Trampoline Market?
Our researchers analyzed the data with 2025 as the base year, along with the key drivers, trends, and challenges. A holistic analysis of drivers will help companies refine their marketing strategies to gain a competitive advantage.
- Strategic decision-making in the trampoline market increasingly hinges on understanding nuanced consumer segments. For those seeking the best trampoline for gymnastics training, the focus is on rectangular trampoline geometry and high-tensile springs that deliver consistent rebound performance, a segment where product specifications are non-negotiable.
- Conversely, the residential market grapples with the question of the safest backyard trampoline for kids, driving innovation in spring-free design and robust safety enclosure net systems, which now command a 20% price premium over traditional models.
- The in-ground vs above-ground trampoline pros cons debate is also reshaping landscape integration, with in-ground installations showing 30% faster adoption in new suburban developments due to aesthetic appeal and perceived safety. For commercial operators, sourcing from reliable commercial trampoline park equipment suppliers is critical for ensuring durability and user safety compliance.
- A deeper understanding of trampoline safety standards explained through clear marketing is essential for all vendors to build consumer trust and justify investment in higher-quality, more durable products.
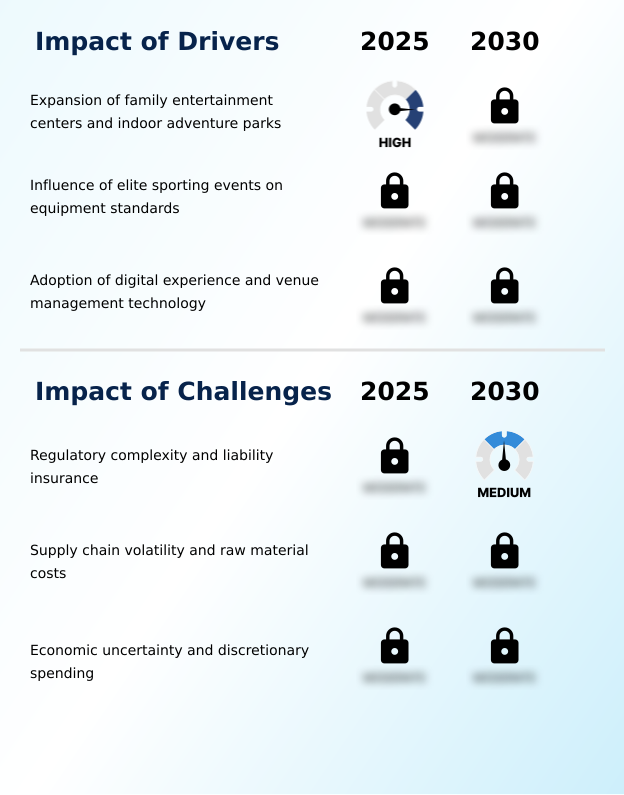
What are the key market drivers leading to the rise in the adoption of Trampoline Industry?
- The primary market driver is the rapid expansion of family entertainment centers and indoor adventure parks, which creates consistent demand for commercial-grade trampoline systems.
- The expansion of family entertainment centers and indoor adventure parks is the most significant driver, creating a 35% year-over-year increase in demand for commercial-grade apparatus in developing regions.
- These venues are shifting from simple jump areas to comprehensive active entertainment hubs, necessitating constant equipment refreshment and investment in durable, high-performance systems. A secondary driver is the influence of elite sporting events on consumer and institutional purchasing.
- The visibility of high-performance rectangular trampoline geometry in competitions drives a trickle-down demand, influencing gymnastics clubs to upgrade their equipment to meet FIG standards, which can increase their capital expenditures on equipment by up to 25%.
- This trend elevates equipment standards across both commercial and residential sectors.
What are the market trends shaping the Trampoline Industry?
- The market is witnessing a significant trend toward commercial diversification, where traditional trampoline parks are evolving into comprehensive, multi-attraction adventure hubs to enhance customer engagement.
- A dominant trend reshaping the trampoline market is the pivot from standalone products to integrated entertainment experiences. In the commercial sector, operators are diversifying into multi-attraction active entertainment hubs, incorporating augmented reality gamification to increase repeat visitation rates by over 20%. This phygital experience merges physical activity with digital gameplay.
- In the residential space, a key trend is aesthetic integration, with in-ground installation and earth-toned, weather-resistant padding options gaining popularity among design-conscious consumers. These premium models, which blend seamlessly into backyard landscapes, now command a 15% price premium compared to standard recreational trampoline units, reflecting a broader shift toward treating play equipment as an extension of home design.
What challenges does the Trampoline Industry face during its growth?
- Navigating the complex regulatory landscape and the rising costs of liability insurance present a significant challenge to the profitability and growth of trampoline park operators.
- The trampoline market faces significant headwinds from an intensifying regulatory landscape and rising operational costs. Navigating disparate regional safety standards, such as ASTM in North America and CEN in Europe, increases product development and compliance costs for manufacturers by as much as 20%.
- For commercial operators, the primary constraint is the escalating cost of liability insurance, with premiums having surged by over 50% in some markets, directly impacting the profitability of any indoor adventure park.
- This is compounded by supply chain volatility, where fluctuations in raw material costs, particularly for galvanized steel frames, can shrink profit margins and challenge price stability for both commercial and residential recreational trampoline models.
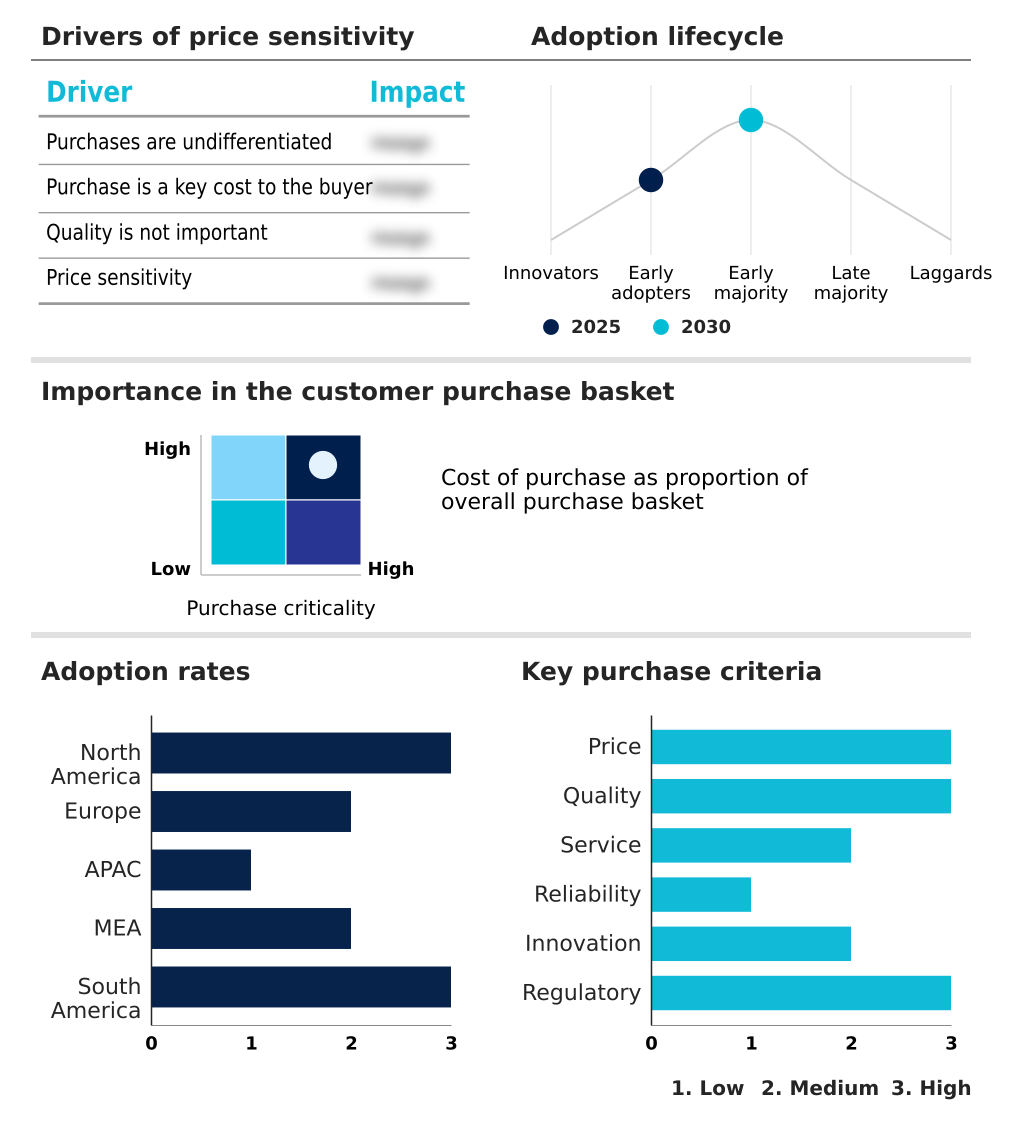
Exclusive Technavio Analysis on Customer Landscape
The trampoline market forecasting report includes the adoption lifecycle of the market, covering from the innovator’s stage to the laggard’s stage. It focuses on adoption rates in different regions based on penetration. Furthermore, the trampoline market report also includes key purchase criteria and drivers of price sensitivity to help companies evaluate and develop their market growth analysis strategies.
Customer Landscape of Trampoline Industry
Competitive Landscape
Companies are implementing various strategies, such as strategic alliances, trampoline market forecast, partnerships, mergers and acquisitions, geographical expansion, and product/service launches, to enhance their presence in the industry.
Bouncy Trampolines - Key offerings include recreational trampolines and related outdoor play products, designed for both residential backyard use and commercial-grade applications in active entertainment hubs.
The industry research and growth report includes detailed analyses of the competitive landscape of the market and information about key companies, including:
- Bouncy Trampolines
- Domi Jump Inc.
- Eurotramp Trampoline GmbH
- Jump Star Trampolines
- Jumpflex USA Limited
- Jumpking Trampolines
- JumpSport Inc.
- North Trampoline Inc.
- Plum Products Ltd
- Sino Fourstar Group Co. Ltd.
- SkyBound USA
- Skywalker Holdings LLC
- Sportspower Ltd.
- Springfree Trampoline Inc.
- Stamina Products Inc.
- Super Jumper Inc.
- Vuly Trampolines Pty Ltd.
- Zhejiang Tianxin Co Ltd.
Qualitative and quantitative analysis of companies has been conducted to help clients understand the wider business environment as well as the strengths and weaknesses of key industry players. Data is qualitatively analyzed to categorize companies as pure play, category-focused, industry-focused, and diversified; it is quantitatively analyzed to categorize companies as dominant, leading, strong, tentative, and weak.
Market Intelligence Radar: High-Impact Developments & Growth Signals
- In the Leisure Products industry, the growing number of dual-income households has increased disposable income, directly expanding the addressable market for high-end recreational trampoline models and accessories.
- A significant expansion of online retail channels for bulky goods has altered distribution strategies, with direct-to-consumer sales of trampolines growing by over 20%, impacting traditional experiential retail models.
- Heightened consumer awareness regarding health and wellness is driving a 15% increase in demand for fitness-related leisure items, boosting the niche but growing fitness rebounder and low-impact exercise trampoline segment.
- The proliferation of counterfeit leisure products lacking user safety compliance is forcing authentic brands to invest more in brand differentiation and customer engagement to protect market share and brand integrity.
Dive into Technavio’s robust research methodology, blending expert interviews, extensive data synthesis, and validated models for unparalleled Trampoline Market insights. See full methodology.
| Market Scope | |
|---|---|
| Page number | 279 |
| Base year | 2025 |
| Historic period | 2020-2024 |
| Forecast period | 2026-2030 |
| Growth momentum & CAGR | Accelerate at a CAGR of 5.5% |
| Market growth 2026-2030 | USD 1168.3 million |
| Market structure | Fragmented |
| YoY growth 2025-2026(%) | 5.0% |
| Key countries | US, Canada, Mexico, Germany, UK, France, Italy, Spain, The Netherlands, China, Japan, India, South Korea, Australia, Indonesia, UAE, Saudi Arabia, South Africa, Qatar, Nigeria, Brazil, Argentina and Chile |
| Competitive landscape | Leading Companies, Market Positioning of Companies, Competitive Strategies, and Industry Risks |
Research Analyst Overview
- The trampoline market ecosystem operates through a complex value chain, where raw material suppliers providing galvanized steel and polypropylene account for up to 40% of the total manufacturing cost.
- Manufacturers then produce a range of products, from recreational trampolines to competitive trampolines, which must adhere to varying regional safety standards like ASTM and CEN, which can increase compliance costs by 15%. Distribution is bifurcated, with online channels now representing over 35% of residential sales and a dedicated B2B channel serving commercial family entertainment centers.
- End-users, including individual households and commercial park operators, drive demand based on factors like safety, equipment durability, and rebound performance. This entire process is supported by logistics partners specializing in bulky goods and technology firms providing venue management solutions.
What are the Key Data Covered in this Trampoline Market Research and Growth Report?
-
What is the expected growth of the Trampoline Market between 2026 and 2030?
-
The Trampoline Market is expected to grow by USD 1.17 billion during 2026-2030, registering a CAGR of 5.5%. Year-over-year growth in 2026 is estimated at 5.0%%. This acceleration is shaped by expansion of family entertainment centers and indoor adventure parks, which is intensifying demand across multiple end-use verticals covered in the report.
-
-
What segmentation does the market report cover?
-
The report is segmented by Product (Round trampolines, Rectangular and square trampolines, and Others), End-user (Commercial, and Individual), Distribution Channel (Offline, and Online) and Geography (North America, Europe, APAC, Middle East and Africa, South America). Among these, the Round trampolines segment is estimated to witness significant growth during the forecast period, driven by rising adoption across key application areas. Each segment includes detailed qualitative and quantitative analysis, along with historical data from 2020-2024 and forecasts through 2030 with year-over-year growth rates.
-
-
Which regions are analyzed in the report?
-
The report covers North America, Europe, APAC, Middle East and Africa and South America. North America is estimated to contribute 41.8% to market growth during the forecast period. Country-level analysis includes US, Canada, Mexico, Germany, UK, France, Italy, Spain, The Netherlands, China, Japan, India, South Korea, Australia, Indonesia, UAE, Saudi Arabia, South Africa, Qatar, Nigeria, Brazil, Argentina and Chile, with dedicated market size tables and year-over-year growth for each.
-
-
What are the key growth drivers and market challenges?
-
The primary driver is expansion of family entertainment centers and indoor adventure parks, which is accelerating investment and industry demand. The main challenge is regulatory complexity and liability insurance, creating operational barriers for key market participants. The report quantifies the impact of each driver and challenge across 2026 and 2030 with comparative analysis.
-
-
Who are the major players in the Trampoline Market?
-
Key vendors include Bouncy Trampolines, Domi Jump Inc., Eurotramp Trampoline GmbH, Jump Star Trampolines, Jumpflex USA Limited, Jumpking Trampolines, JumpSport Inc., North Trampoline Inc., Plum Products Ltd, Sino Fourstar Group Co. Ltd., SkyBound USA, Skywalker Holdings LLC, Sportspower Ltd., Springfree Trampoline Inc., Stamina Products Inc., Super Jumper Inc., Vuly Trampolines Pty Ltd. and Zhejiang Tianxin Co Ltd.. The report provides qualitative and quantitative analysis categorizing companies as dominant, leading, strong, tentative, and weak based on their market positioning. Company profiles include business segment analysis, SWOT assessment, key offerings, and recent strategic developments.
-
Market Research Insights
- The competitive landscape is intensely segmented, with the top ten vendors accounting for less than 45% of market share, indicating a high degree of fragmentation. Key players like Eurotramp and Springfree Trampoline are differentiating through specialized product innovation.
- For instance, Eurotramp solidified its leadership in the competitive trampoline segment by serving as the official supplier for major gymnastics championships, showcasing superior rebound performance. Meanwhile, consumer-focused brands like Jumpflex are capturing market share by emphasizing safety and aesthetic integration, with features like weld-free frames that improve equipment durability by an estimated 20%.
- These strategic moves address core industry needs for both professional-grade athletic equipment and safe, durable backyard recreation options, navigating challenges like raw material cost volatility.
We can help! Our analysts can customize this trampoline market research report to meet your requirements.
 RIA -
RIA - 
