Ultraviolet (UV) Sensor Market Analysis, Size, and Forecast 2026-2030: APAC (China, Japan, and South Korea), North America (US, Canada, and Mexico), Europe (Germany, UK, and France), South America (Brazil and Argentina), Middle East and Africa (UAE, Saudi Arabia, and South Africa), and Rest of World (ROW)

Ultraviolet (UV) Sensor Market Analysis, Size, and Forecast 2026-2030:
APAC (China, Japan, and South Korea), North America (US, Canada, and Mexico), Europe (Germany, UK, and France), South America (Brazil and Argentina), Middle East and Africa (UAE, Saudi Arabia, and South Africa), and Rest of World (ROW)

Published: Mar 2026 305 Pages SKU: IRTNTR45401

Market Overview at a Glance

$8.54 B
Market Opportunity
25%
CAGR 2025 - 2030
42.4%
APAC Growth
$1.60 B
UV phototubes segment 2024

Ultraviolet (UV) Sensor Market Size 2026-2030

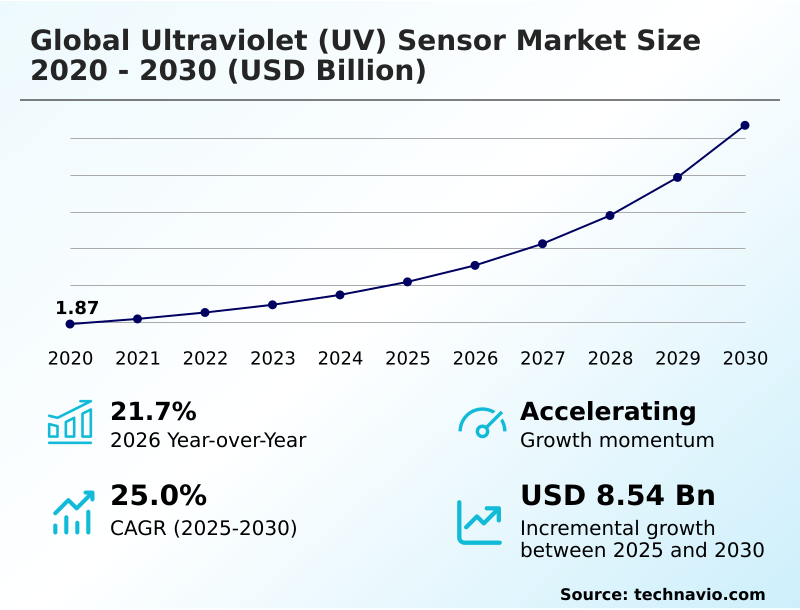
The ultraviolet (uv) sensor market size is valued to increase by USD 8.54 billion, at a CAGR of 25% from 2025 to 2030. Increasing adoption of wearable health technology for preventative care will drive the ultraviolet (uv) sensor market.

Major Market Trends & Insights

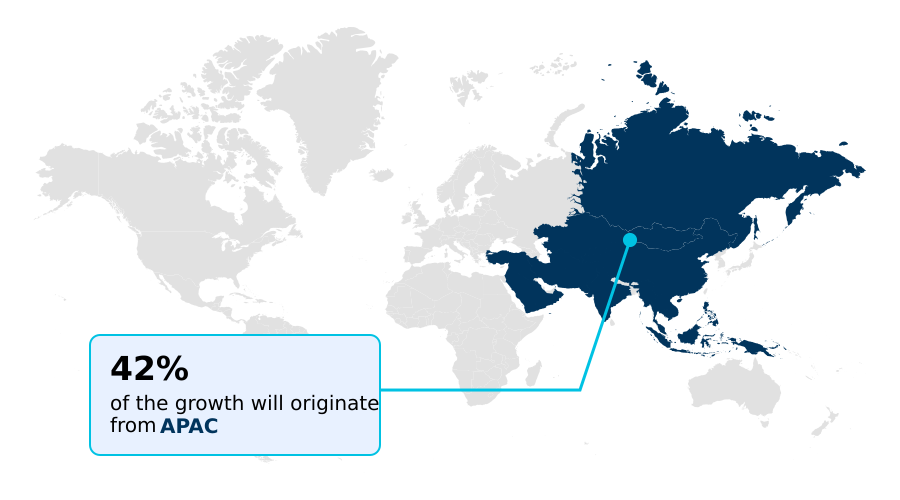
  • APAC dominated the market and accounted for a 42.4% growth during the forecast period.
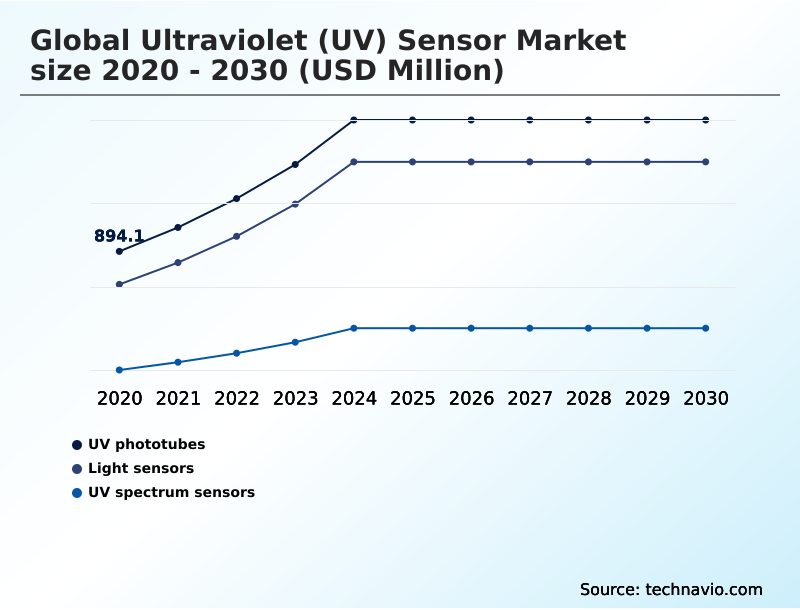
  • By Type - UV phototubes segment was valued at USD 1.60 billion in 2024
  • By End-user - Industrial segment accounted for the largest market revenue share in 2024

Market Size & Forecast

  • Market Opportunities: USD 10.84 billion
  • Market Future Opportunities: USD 8.54 billion
  • CAGR from 2025 to 2030 : 25%

Market Summary

  • The Ultraviolet (UV) Sensor Market is expanding, driven by heightened demand for safety, health, and process automation. The integration of photodiodes into consumer wearables enables real-time skin health monitoring, while industrial sectors depend on these components for precise UV curing processes.
  • A key trend involves the development of transparent and flexible sensors, allowing for unobtrusive integration into smart devices and textiles. However, technical hurdles persist, including the challenge of achieving true solar blindness without costly filters and managing thermal instability in high-throughput manufacturing.
  • In a smart factory scenario, UV spectrum sensors embedded within a high-speed printing line provide continuous data on curing intensity. This allows for automated adjustments that ensure consistent ink adhesion, reducing product defects by over 20% and enabling predictive maintenance of UV lamps.
  • This highlights the industry's shift toward using wide-bandgap materials like Indium Aluminum Gallium Nitride (InAlGaN) to enhance sensor performance and reliability in demanding operational environments.

What will be the Size of the Ultraviolet (UV) Sensor Market during the forecast period?

Get Key Insights on Market Forecast (PDF) Request Free Sample

How is the Ultraviolet (UV) Sensor Market Segmented?

The ultraviolet (uv) sensor industry research report provides comprehensive data (region-wise segment analysis), with forecasts and estimates in "USD million" for the period 2026-2030, as well as historical data from 2020-2024 for the following segments.

  • Type
    • UV phototubes
    • Light sensors
    • UV spectrum sensors
  • End-user
    • Industrial
    • Automotive
    • Medical
    • Consumer electronics
    • Others
  • Application
    • 1-5 watt
    • Less than 1 watt
    • More than 5 watt
  • Geography
    • APAC
      • China
      • Japan
      • South Korea
    • North America
      • US
      • Canada
      • Mexico
    • Europe
      • Germany
      • UK
      • France
    • South America
      • Brazil
      • Argentina
    • Middle East and Africa
      • UAE
      • Saudi Arabia
      • South Africa
    • Rest of World (ROW)

By Type Insights

The uv phototubes segment is estimated to witness significant growth during the forecast period.

The UV phototubes segment remains critical for high-reliability industrial safety applications, operating on photoelectric and gas discharge principles.

Unlike modern photodiode-based sensors or CMOS image sensors with UV sensitivity, these devices offer inherent solar-blindness, which is essential for flame detection sensors in environments with intense thermal radiation.

Their robust construction, often using specialized UV transmitting optical materials, ensures rapid response times and durability under harsh conditions where solid-state components may falter.

This technology is indispensable for applications ranging from germicidal irradiation monitoring to precise UVA UVB UVC sensing, complementing other instruments like pyranometers and radiometers.

In industrial settings, phototubes achieve a 99.9% reliability rate in high-stress tests, validating their continued use for critical safety systems.

Request Free Sample

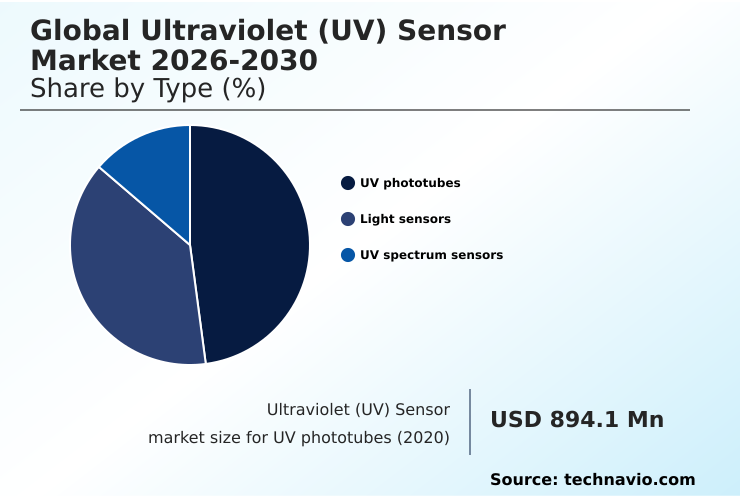
The UV phototubes segment was valued at USD 1.60 billion in 2024 and showed a gradual increase during the forecast period.

Request Free Sample

Regional Analysis

APAC is estimated to contribute 42.4% to the growth of the global market during the forecast period.Technavio’s analysts have elaborately explained the regional trends and drivers that shape the market during the forecast period.

See How Ultraviolet (UV) Sensor Market Demand is Rising in APAC Request Free Sample

APAC commands over 42% of the market's incremental growth, fueled by its leadership in semiconductor fabrication monitoring and consumer electronics. The use of ultraviolet photodetectors for photolithography exposure control is fundamental to the region's opto-semiconductor component manufacturing.

Concurrently, rapid urbanization necessitates advanced water quality monitoring sensors to ensure public health standards.

In industrial UV curing process control, innovations are driving demand for high-temperature stability sensors capable of operating in environments exceeding 250 degrees Celsius, a 150% improvement over standard silicon-based components.

These smart factory feedback loops are often managed via a digital output I2C interface, enabling precise industrial process control sensing and contributing to the region's dominance in fire safety suppression systems and solar irradiance measurement.

Market Dynamics

Our researchers analyzed the data with 2025 as the base year, along with the key drivers, trends, and challenges. A holistic analysis of drivers will help companies refine their marketing strategies to gain a competitive advantage.

  • The application landscape for ultraviolet sensors is rapidly diversifying, driven by distinct needs across multiple high-value sectors. The demand for a UV sensor for wearable health is fueling the development of the wearable UV patch for skin and the skin health UV exposure tracker, offering personalized health data.
  • In the automotive sector, automotive smart cockpit UV sensing and the smart glass UV blocking sensor are becoming standard for enhancing passenger comfort and safety. Industrial applications are advancing with the industrial high-temperature UV sensor, which is crucial for UV curing process quality control, while UV flame detection safety systems protect critical infrastructure.
  • For environmental and public health, the UV sensor for environmental monitoring and the water purification UVC monitoring device are indispensable. Specialized use cases include the solar blind missile warning sensor for defense and the UV sensor for precision agriculture.
  • The transition to solid-state disinfection is defined by the UVC LED disinfection validation sensor and the establishment of UV-C LED calibration standards, with far-UVC human safe disinfection creating new opportunities.
  • This progress is built on foundational GaN based UV sensor technology and SiC based UV sensor durability, with supply chains integrating industrial UV curing process control reporting defect reductions upwards of 30% compared to manual inspection methods, directly impacting operational planning.

What are the key market drivers leading to the rise in the adoption of Ultraviolet (UV) Sensor Industry?

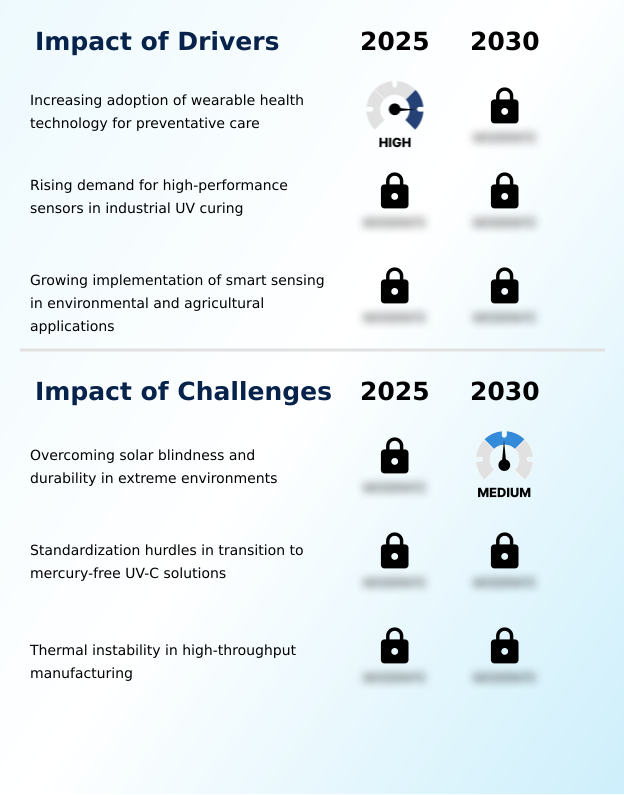
  • The increasing adoption of wearable health technology for preventative care is a key driver of market growth.

  • Growth is significantly driven by the increasing adoption of preventative skin health technology, which relies on miniaturized UV sensors embedded in wearable health monitoring sensors and other personal devices.
  • These environmental sensing modules, often combined with low-power ambient light sensors, facilitate real-time process adjustment of user behavior.
  • In controlled environment agriculture, precision agriculture light recipes utilizing the far-UVC spectral range for pathogen control in horticulture are increasing crop nutritional value by up to 10%.
  • This push for laboratory-grade spectral analysis extends to smart city infrastructure sensing and building automation systems, where sensors provide critical data for optimizing public health and energy efficiency across urban landscapes.

What are the market trends shaping the Ultraviolet (UV) Sensor Industry?

  • Advancements in transparent and flexible sensor technology represent a key market trend. These innovations are enabling seamless integration into next-generation wearable devices.

  • A defining market trend is the development of transparent flexible sensors based on nanostructured semiconductor materials and oxide semiconductor heterostructure technology, enabling seamless consumer electronics integration. This allows for personal sun safety monitoring capabilities to be embedded directly into smartwatch displays, which has been shown to improve user engagement by over 40%.
  • In the automotive sector, smart cockpit sensor integration is advancing with AEC-Q100 automotive grade sensors. These multi-functional sensor packages, which include proximity detection sensors, are key to advanced driver-assistance systems and smart glass radiation blocking. For electric vehicle energy optimization, these sensors help refine automotive cabin comfort systems, reducing HVAC energy consumption by up to 15%.

What challenges does the Ultraviolet (UV) Sensor Industry face during its growth?

  • A key challenge affecting industry growth is the need to overcome technical limitations related to solar blindness and enhance sensor durability in extreme environments.

  • A primary challenge is achieving true solar-blind UV sensors without costly spectral selectivity filtering, a limitation that wide-bandgap semiconductor materials like silicon carbide photodiodes and gallium nitride detectors aim to overcome. The transition to mercury-free UV-C solutions for UVC disinfection system validation faces standardization hurdles, as ensuring NIST traceable UV calibration for LEDs is complex.
  • In high-throughput manufacturing automation, thermal drift and degradation of sensors can lead to dosage inaccuracies of up to 25%, compromising efficacy. This necessitates robust closed-loop control systems and predictive maintenance of UV lamps. Furthermore, ensuring radiation hardness in aerospace applications remains a persistent material science challenge.

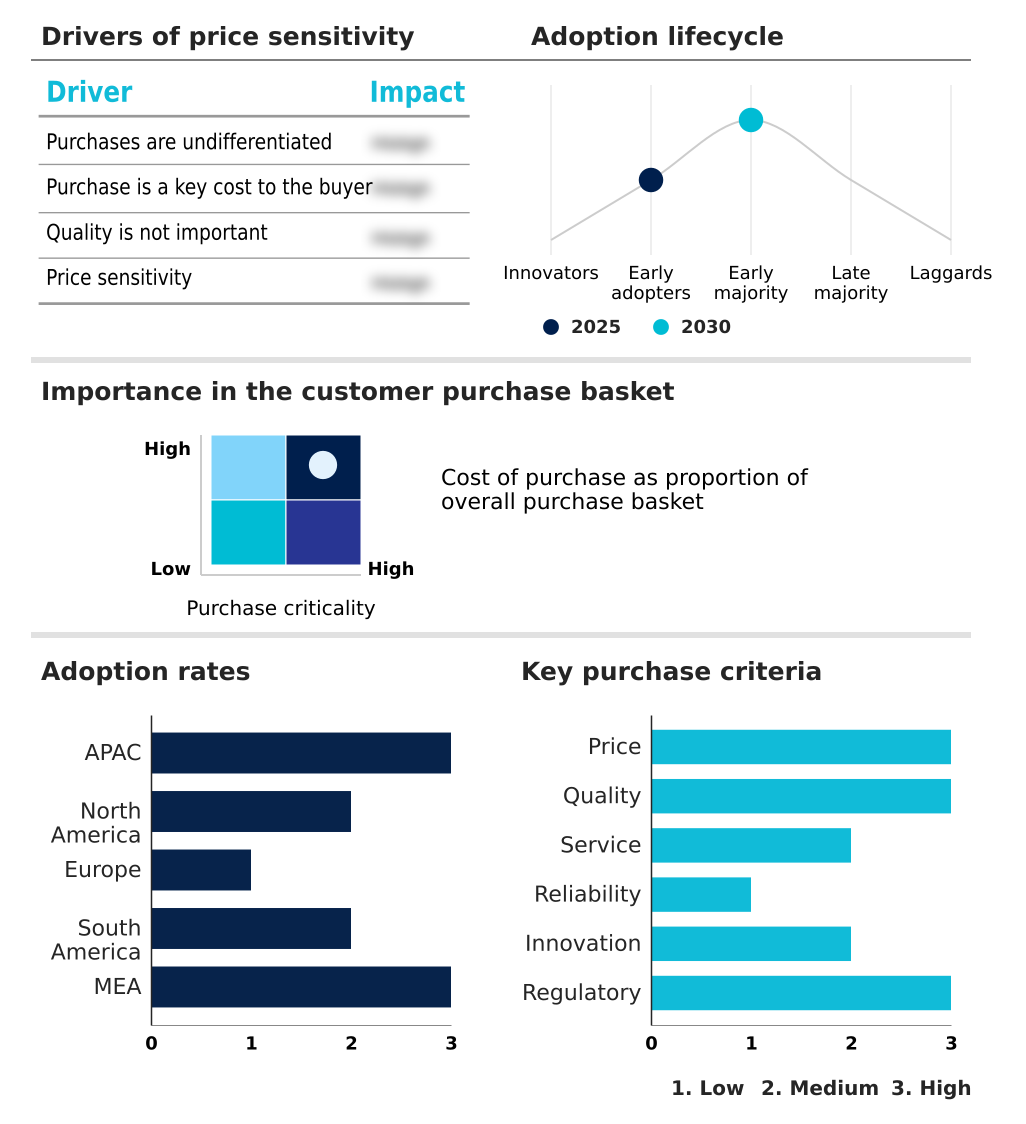
Exclusive Technavio Analysis on Customer Landscape

The ultraviolet (uv) sensor market forecasting report includes the adoption lifecycle of the market, covering from the innovator’s stage to the laggard’s stage. It focuses on adoption rates in different regions based on penetration. Furthermore, the ultraviolet (uv) sensor market report also includes key purchase criteria and drivers of price sensitivity to help companies evaluate and develop their market growth analysis strategies.

Customer Landscape of Ultraviolet (UV) Sensor Industry

Competitive Landscape

Companies are implementing various strategies, such as strategic alliances, ultraviolet (uv) sensor market forecast, partnerships, mergers and acquisitions, geographical expansion, and product/service launches, to enhance their presence in the industry.

ams OSRAM AG - Key offerings encompass advanced optical semiconductors and integrated sensor solutions, providing high-performance emitters and detectors for industrial, automotive, and consumer technology sectors.

The industry research and growth report includes detailed analyses of the competitive landscape of the market and information about key companies, including:

  • ams OSRAM AG
  • Apogee Instruments Inc.
  • Broadcom Inc.
  • Davis Instruments Corp.
  • Endress Hauser Grp Services
  • GaNo Optoelectronics Inc.
  • Genicom Co. Ltd.
  • Hamamatsu Photonics KK
  • Honeywell International Inc.
  • METER Group Inc.
  • ROHM Co. Ltd.
  • Scott Technical Instruments Ltd.
  • sglux GmbH
  • Silicon Laboratories Inc.
  • Solar Light Co. Inc.
  • Sony Semiconductor Solutions
  • STMicroelectronics NV
  • Sumita Optical Glass Inc.
  • Vernier Science Education
  • Vishay Intertechnology Inc.

Qualitative and quantitative analysis of companies has been conducted to help clients understand the wider business environment as well as the strengths and weaknesses of key industry players. Data is qualitatively analyzed to categorize companies as pure play, category-focused, industry-focused, and diversified; it is quantitatively analyzed to categorize companies as dominant, leading, strong, tentative, and weak.

Recent Development and News in Ultraviolet (uv) sensor market

  • In October 2024, ams OSRAM announced a breakthrough in UV-C LED efficiency, with performance metrics validated by Germany's national metrology institute, PTB.
  • In January 2025, ams OSRAM introduced a new multi-channel spectral sensor for mobile devices, featuring enhanced UV monitoring for skin health applications.
  • In February 2025, UV Medico confirmed its UV222 disinfection booths, utilizing Far-UVC technology, passed factory acceptance tests and were shipping to pharmaceutical clients.
  • In April 2025, ams OSRAM showcased its latest horticulture sensing solutions, demonstrating spectral sensors for optimizing crop growth and quality.

Dive into Technavio’s robust research methodology, blending expert interviews, extensive data synthesis, and validated models for unparalleled Ultraviolet (UV) Sensor Market insights. See full methodology.

Market Scope
Page number 305
Base year 2025
Historic period 2020-2024
Forecast period 2026-2030
Growth momentum & CAGR Accelerate at a CAGR of 25%
Market growth 2026-2030 USD 8541.5 million
Market structure Fragmented
YoY growth 2025-2026(%) 21.7%
Key countries China, Japan, South Korea, India, Australia, Indonesia, US, Canada, Mexico, Germany, UK, France, Italy, Spain, The Netherlands, Brazil, Argentina, Chile, UAE, Saudi Arabia, South Africa, Egypt and Israel
Competitive landscape Leading Companies, Market Positioning of Companies, Competitive Strategies, and Industry Risks

Request Free Sample

Research Analyst Overview

  • The market has evolved from niche industrial applications to a mainstream technology integrated into everyday devices. This shift is powered by innovations in opto-semiconductor components and nanostructured semiconductor materials, including advanced ultraviolet photodetectors. Key applications such as germicidal irradiation monitoring and flame detection sensors remain critical, while new uses in wearable health monitoring sensors are expanding the market's reach.
  • The development of wide-bandgap semiconductor materials like silicon carbide photodiodes has been pivotal, with some advanced sensors demonstrating a 100,000-fold improvement in visible light rejection compared to traditional silicon. This technical superiority is crucial for solar-blind UV sensors used in high-stakes environments.
  • This performance leap compels boardroom-level decisions on product strategy, as incorporating UVC disinfection system validation capabilities, backed by NIST traceable UV calibration, is now a compliance and competitive necessity, influencing everything from photolithography exposure control to consumer product design.

What are the Key Data Covered in this Ultraviolet (UV) Sensor Market Research and Growth Report?

  • What is the expected growth of the Ultraviolet (UV) Sensor Market between 2026 and 2030?

    • USD 8.54 billion, at a CAGR of 25%

  • What segmentation does the market report cover?

    • The report is segmented by Type (UV phototubes, Light sensors, and UV spectrum sensors), End-user (Industrial, Automotive, Medical, Consumer electronics, and Others), Application (1- 5 watt, Less than 1 watt, and More than 5 watt) and Geography (APAC, North America, Europe, South America, Middle East and Africa)

  • Which regions are analyzed in the report?

    • APAC, North America, Europe, South America and Middle East and Africa

  • What are the key growth drivers and market challenges?

    • Increasing adoption of wearable health technology for preventative care, Overcoming solar blindness and durability in extreme environments

  • Who are the major players in the Ultraviolet (UV) Sensor Market?

    • ams OSRAM AG, Apogee Instruments Inc., Broadcom Inc., Davis Instruments Corp., Endress Hauser Grp Services, GaNo Optoelectronics Inc., Genicom Co. Ltd., Hamamatsu Photonics KK, Honeywell International Inc., METER Group Inc., ROHM Co. Ltd., Scott Technical Instruments Ltd., sglux GmbH, Silicon Laboratories Inc., Solar Light Co. Inc., Sony Semiconductor Solutions, STMicroelectronics NV, Sumita Optical Glass Inc., Vernier Science Education and Vishay Intertechnology Inc.

Market Research Insights

  • Market dynamics are shaped by a convergence of industrial automation needs and sophisticated consumer applications. In industrial settings, the integration of real-time monitoring for UV curing processes has reduced material waste by 15%. For automotive smart cockpit systems, advanced sensors improve climate control efficiency in electric vehicles by up to 25%, enhancing passenger comfort.
  • The need for stringent environmental monitoring and public safety is another significant factor. In water purification monitoring, new systems featuring high spectral accuracy achieve a 99.9% pathogen detection rate, ensuring regulatory compliance. This demand for precision is driving innovation in sensor technology across all key segments, from smart factory feedback loops to preventative skin health technology.

We can help! Our analysts can customize this ultraviolet (uv) sensor market research report to meet your requirements.

Get in touch

1. Executive Summary

1.1 Market overview

Executive Summary - Chart on Market Overview
Executive Summary - Data Table on Market Overview
Executive Summary - Chart on Global Market Characteristics
Executive Summary - Chart on Market by Geography
Executive Summary - Chart on Market Segmentation by Type
Executive Summary - Chart on Market Segmentation by End-user
Executive Summary - Chart on Market Segmentation by Application
Executive Summary - Chart on Incremental Growth
Executive Summary - Data Table on Incremental Growth
Executive Summary - Chart on Company Market Positioning

2. Technavio Analysis

2.1 Analysis of price sensitivity, lifecycle, customer purchase basket, adoption rates, and purchase criteria

2.2 Criticality of inputs and Factors of differentiation

Chart on Overview on criticality of inputs and factors of differentiation

2.3 Factors of disruption

Chart on Overview on factors of disruption

2.4 Impact of drivers and challenges

Chart on Impact of drivers and challenges in 2025 and 2030

3. Market Landscape

3.1 Market ecosystem

Chart on Parent Market
Data Table on - Parent Market

3.2 Market characteristics

Chart on Market characteristics analysis

3.3 Value chain analysis

Chart on Value chain analysis

4. Market Sizing

4.1 Market definition

Data Table on Offerings of companies included in the market definition

4.2 Market segment analysis

Market segments

4.3 Market size 2025

4.4 Market outlook: Forecast for 2025-2030

Chart on Global - Market size and forecast 2025-2030 ($ million)
Data Table on Global - Market size and forecast 2025-2030 ($ million)
Chart on Global Market: Year-over-year growth 2025-2030 (%)
Data Table on Global Market: Year-over-year growth 2025-2030 (%)

5. Historic Market Size

5.1 Global Ultraviolet (UV) Sensor Market 2020 - 2024

Historic Market Size - Data Table on Global Ultraviolet (UV) Sensor Market 2020 - 2024 ($ million)

5.2 Type segment analysis 2020 - 2024

Historic Market Size - Type Segment 2020 - 2024 ($ million)

5.3 End-user segment analysis 2020 - 2024

Historic Market Size - End-user Segment 2020 - 2024 ($ million)

5.4 Application segment analysis 2020 - 2024

Historic Market Size - Application Segment 2020 - 2024 ($ million)

5.5 Geography segment analysis 2020 - 2024

Historic Market Size - Geography Segment 2020 - 2024 ($ million)

5.6 Country segment analysis 2020 - 2024

Historic Market Size - Country Segment 2020 - 2024 ($ million)

6. Qualitative Analysis

6.1 Impact of AI on Global Ultraviolet (UV) Sensor Market

7. Five Forces Analysis

7.1 Five forces summary

Five forces analysis - Comparison between 2025 and 2030

7.2 Bargaining power of buyers

Bargaining power of buyers - Impact of key factors 2025 and 2030

7.3 Bargaining power of suppliers

Bargaining power of suppliers - Impact of key factors in 2025 and 2030

7.4 Threat of new entrants

Threat of new entrants - Impact of key factors in 2025 and 2030

7.5 Threat of substitutes

Threat of substitutes - Impact of key factors in 2025 and 2030

7.6 Threat of rivalry

Threat of rivalry - Impact of key factors in 2025 and 2030

7.7 Market condition

Chart on Market condition - Five forces 2025 and 2030

8. Market Segmentation by Type

8.1 Market segments

Chart on Type - Market share 2025-2030 (%)
Data Table on Type - Market share 2025-2030 (%)

8.2 Comparison by Type

Chart on Comparison by Type
Data Table on Comparison by Type

8.3 UV phototubes - Market size and forecast 2025-2030

Chart on UV phototubes - Market size and forecast 2025-2030 ($ million)
Data Table on UV phototubes - Market size and forecast 2025-2030 ($ million)
Chart on UV phototubes - Year-over-year growth 2025-2030 (%)
Data Table on UV phototubes - Year-over-year growth 2025-2030 (%)

8.4 Light sensors - Market size and forecast 2025-2030

Chart on Light sensors - Market size and forecast 2025-2030 ($ million)
Data Table on Light sensors - Market size and forecast 2025-2030 ($ million)
Chart on Light sensors - Year-over-year growth 2025-2030 (%)
Data Table on Light sensors - Year-over-year growth 2025-2030 (%)

8.5 UV spectrum sensors - Market size and forecast 2025-2030

Chart on UV spectrum sensors - Market size and forecast 2025-2030 ($ million)
Data Table on UV spectrum sensors - Market size and forecast 2025-2030 ($ million)
Chart on UV spectrum sensors - Year-over-year growth 2025-2030 (%)
Data Table on UV spectrum sensors - Year-over-year growth 2025-2030 (%)

8.6 Market opportunity by Type

Market opportunity by Type ($ million)
Data Table on Market opportunity by Type ($ million)

9. Market Segmentation by End-user

9.1 Market segments

Chart on End-user - Market share 2025-2030 (%)
Data Table on End-user - Market share 2025-2030 (%)

9.2 Comparison by End-user

Chart on Comparison by End-user
Data Table on Comparison by End-user

9.3 Industrial - Market size and forecast 2025-2030

Chart on Industrial - Market size and forecast 2025-2030 ($ million)
Data Table on Industrial - Market size and forecast 2025-2030 ($ million)
Chart on Industrial - Year-over-year growth 2025-2030 (%)
Data Table on Industrial - Year-over-year growth 2025-2030 (%)

9.4 Automotive - Market size and forecast 2025-2030

Chart on Automotive - Market size and forecast 2025-2030 ($ million)
Data Table on Automotive - Market size and forecast 2025-2030 ($ million)
Chart on Automotive - Year-over-year growth 2025-2030 (%)
Data Table on Automotive - Year-over-year growth 2025-2030 (%)

9.5 Medical - Market size and forecast 2025-2030

Chart on Medical - Market size and forecast 2025-2030 ($ million)
Data Table on Medical - Market size and forecast 2025-2030 ($ million)
Chart on Medical - Year-over-year growth 2025-2030 (%)
Data Table on Medical - Year-over-year growth 2025-2030 (%)

9.6 Consumer electronics - Market size and forecast 2025-2030

Chart on Consumer electronics - Market size and forecast 2025-2030 ($ million)
Data Table on Consumer electronics - Market size and forecast 2025-2030 ($ million)
Chart on Consumer electronics - Year-over-year growth 2025-2030 (%)
Data Table on Consumer electronics - Year-over-year growth 2025-2030 (%)

9.7 Others - Market size and forecast 2025-2030

Chart on Others - Market size and forecast 2025-2030 ($ million)
Data Table on Others - Market size and forecast 2025-2030 ($ million)
Chart on Others - Year-over-year growth 2025-2030 (%)
Data Table on Others - Year-over-year growth 2025-2030 (%)

9.8 Market opportunity by End-user

Market opportunity by End-user ($ million)
Data Table on Market opportunity by End-user ($ million)

10. Market Segmentation by Application

10.1 Market segments

Chart on Application - Market share 2025-2030 (%)
Data Table on Application - Market share 2025-2030 (%)

10.2 Comparison by Application

Chart on Comparison by Application
Data Table on Comparison by Application

10.3 1-5 watt - Market size and forecast 2025-2030

Chart on 1-5 watt - Market size and forecast 2025-2030 ($ million)
Data Table on 1-5 watt - Market size and forecast 2025-2030 ($ million)
Chart on 1-5 watt - Year-over-year growth 2025-2030 (%)
Data Table on 1-5 watt - Year-over-year growth 2025-2030 (%)

10.4 Less than 1 watt - Market size and forecast 2025-2030

Chart on Less than 1 watt - Market size and forecast 2025-2030 ($ million)
Data Table on Less than 1 watt - Market size and forecast 2025-2030 ($ million)
Chart on Less than 1 watt - Year-over-year growth 2025-2030 (%)
Data Table on Less than 1 watt - Year-over-year growth 2025-2030 (%)

10.5 More than 5 watt - Market size and forecast 2025-2030

Chart on More than 5 watt - Market size and forecast 2025-2030 ($ million)
Data Table on More than 5 watt - Market size and forecast 2025-2030 ($ million)
Chart on More than 5 watt - Year-over-year growth 2025-2030 (%)
Data Table on More than 5 watt - Year-over-year growth 2025-2030 (%)

10.6 Market opportunity by Application

Market opportunity by Application ($ million)
Data Table on Market opportunity by Application ($ million)

11. Customer Landscape

11.1 Customer landscape overview

Analysis of price sensitivity, lifecycle, customer purchase basket, adoption rates, and purchase criteria

12. Geographic Landscape

12.1 Geographic segmentation

Chart on Market share by geography 2025-2030 (%)
Data Table on Market share by geography 2025-2030 (%)

12.2 Geographic comparison

Chart on Geographic comparison
Data Table on Geographic comparison

12.3 APAC - Market size and forecast 2025-2030

Chart on APAC - Market size and forecast 2025-2030 ($ million)
Data Table on APAC - Market size and forecast 2025-2030 ($ million)
Chart on APAC - Year-over-year growth 2025-2030 (%)
Data Table on APAC - Year-over-year growth 2025-2030 (%)
Chart on Regional Comparison - APAC
Data Table on Regional Comparison - APAC

12.3.1 China - Market size and forecast 2025-2030

Chart on China - Market size and forecast 2025-2030 ($ million)
Data Table on China - Market size and forecast 2025-2030 ($ million)
Chart on China - Year-over-year growth 2025-2030 (%)
Data Table on China - Year-over-year growth 2025-2030 (%)

12.3.2 Japan - Market size and forecast 2025-2030

Chart on Japan - Market size and forecast 2025-2030 ($ million)
Data Table on Japan - Market size and forecast 2025-2030 ($ million)
Chart on Japan - Year-over-year growth 2025-2030 (%)
Data Table on Japan - Year-over-year growth 2025-2030 (%)

12.3.3 South Korea - Market size and forecast 2025-2030

Chart on South Korea - Market size and forecast 2025-2030 ($ million)
Data Table on South Korea - Market size and forecast 2025-2030 ($ million)
Chart on South Korea - Year-over-year growth 2025-2030 (%)
Data Table on South Korea - Year-over-year growth 2025-2030 (%)

12.3.4 India - Market size and forecast 2025-2030

Chart on India - Market size and forecast 2025-2030 ($ million)
Data Table on India - Market size and forecast 2025-2030 ($ million)
Chart on India - Year-over-year growth 2025-2030 (%)
Data Table on India - Year-over-year growth 2025-2030 (%)

12.3.5 Australia - Market size and forecast 2025-2030

Chart on Australia - Market size and forecast 2025-2030 ($ million)
Data Table on Australia - Market size and forecast 2025-2030 ($ million)
Chart on Australia - Year-over-year growth 2025-2030 (%)
Data Table on Australia - Year-over-year growth 2025-2030 (%)

12.3.6 Indonesia - Market size and forecast 2025-2030

Chart on Indonesia - Market size and forecast 2025-2030 ($ million)
Data Table on Indonesia - Market size and forecast 2025-2030 ($ million)
Chart on Indonesia - Year-over-year growth 2025-2030 (%)
Data Table on Indonesia - Year-over-year growth 2025-2030 (%)

12.4 North America - Market size and forecast 2025-2030

Chart on North America - Market size and forecast 2025-2030 ($ million)
Data Table on North America - Market size and forecast 2025-2030 ($ million)
Chart on North America - Year-over-year growth 2025-2030 (%)
Data Table on North America - Year-over-year growth 2025-2030 (%)
Chart on Regional Comparison - North America
Data Table on Regional Comparison - North America

12.4.1 US - Market size and forecast 2025-2030

Chart on US - Market size and forecast 2025-2030 ($ million)
Data Table on US - Market size and forecast 2025-2030 ($ million)
Chart on US - Year-over-year growth 2025-2030 (%)
Data Table on US - Year-over-year growth 2025-2030 (%)

12.4.2 Canada - Market size and forecast 2025-2030

Chart on Canada - Market size and forecast 2025-2030 ($ million)
Data Table on Canada - Market size and forecast 2025-2030 ($ million)
Chart on Canada - Year-over-year growth 2025-2030 (%)
Data Table on Canada - Year-over-year growth 2025-2030 (%)

12.4.3 Mexico - Market size and forecast 2025-2030

Chart on Mexico - Market size and forecast 2025-2030 ($ million)
Data Table on Mexico - Market size and forecast 2025-2030 ($ million)
Chart on Mexico - Year-over-year growth 2025-2030 (%)
Data Table on Mexico - Year-over-year growth 2025-2030 (%)

12.5 Europe - Market size and forecast 2025-2030

Chart on Europe - Market size and forecast 2025-2030 ($ million)
Data Table on Europe - Market size and forecast 2025-2030 ($ million)
Chart on Europe - Year-over-year growth 2025-2030 (%)
Data Table on Europe - Year-over-year growth 2025-2030 (%)
Chart on Regional Comparison - Europe
Data Table on Regional Comparison - Europe

12.5.1 Germany - Market size and forecast 2025-2030

Chart on Germany - Market size and forecast 2025-2030 ($ million)
Data Table on Germany - Market size and forecast 2025-2030 ($ million)
Chart on Germany - Year-over-year growth 2025-2030 (%)
Data Table on Germany - Year-over-year growth 2025-2030 (%)

12.5.2 UK - Market size and forecast 2025-2030

Chart on UK - Market size and forecast 2025-2030 ($ million)
Data Table on UK - Market size and forecast 2025-2030 ($ million)
Chart on UK - Year-over-year growth 2025-2030 (%)
Data Table on UK - Year-over-year growth 2025-2030 (%)

12.5.3 France - Market size and forecast 2025-2030

Chart on France - Market size and forecast 2025-2030 ($ million)
Data Table on France - Market size and forecast 2025-2030 ($ million)
Chart on France - Year-over-year growth 2025-2030 (%)
Data Table on France - Year-over-year growth 2025-2030 (%)

12.5.4 Italy - Market size and forecast 2025-2030

Chart on Italy - Market size and forecast 2025-2030 ($ million)
Data Table on Italy - Market size and forecast 2025-2030 ($ million)
Chart on Italy - Year-over-year growth 2025-2030 (%)
Data Table on Italy - Year-over-year growth 2025-2030 (%)

12.5.5 Spain - Market size and forecast 2025-2030

Chart on Spain - Market size and forecast 2025-2030 ($ million)
Data Table on Spain - Market size and forecast 2025-2030 ($ million)
Chart on Spain - Year-over-year growth 2025-2030 (%)
Data Table on Spain - Year-over-year growth 2025-2030 (%)

12.5.6 The Netherlands - Market size and forecast 2025-2030

Chart on The Netherlands - Market size and forecast 2025-2030 ($ million)
Data Table on The Netherlands - Market size and forecast 2025-2030 ($ million)
Chart on The Netherlands - Year-over-year growth 2025-2030 (%)
Data Table on The Netherlands - Year-over-year growth 2025-2030 (%)

12.6 South America - Market size and forecast 2025-2030

Chart on South America - Market size and forecast 2025-2030 ($ million)
Data Table on South America - Market size and forecast 2025-2030 ($ million)
Chart on South America - Year-over-year growth 2025-2030 (%)
Data Table on South America - Year-over-year growth 2025-2030 (%)
Chart on Regional Comparison - South America
Data Table on Regional Comparison - South America

12.6.1 Brazil - Market size and forecast 2025-2030

Chart on Brazil - Market size and forecast 2025-2030 ($ million)
Data Table on Brazil - Market size and forecast 2025-2030 ($ million)
Chart on Brazil - Year-over-year growth 2025-2030 (%)
Data Table on Brazil - Year-over-year growth 2025-2030 (%)

12.6.2 Argentina - Market size and forecast 2025-2030

Chart on Argentina - Market size and forecast 2025-2030 ($ million)
Data Table on Argentina - Market size and forecast 2025-2030 ($ million)
Chart on Argentina - Year-over-year growth 2025-2030 (%)
Data Table on Argentina - Year-over-year growth 2025-2030 (%)

12.6.3 Chile - Market size and forecast 2025-2030

Chart on Chile - Market size and forecast 2025-2030 ($ million)
Data Table on Chile - Market size and forecast 2025-2030 ($ million)
Chart on Chile - Year-over-year growth 2025-2030 (%)
Data Table on Chile - Year-over-year growth 2025-2030 (%)

12.7 Middle East and Africa - Market size and forecast 2025-2030

Chart on Middle East and Africa - Market size and forecast 2025-2030 ($ million)
Data Table on Middle East and Africa - Market size and forecast 2025-2030 ($ million)
Chart on Middle East and Africa - Year-over-year growth 2025-2030 (%)
Data Table on Middle East and Africa - Year-over-year growth 2025-2030 (%)
Chart on Regional Comparison - Middle East and Africa
Data Table on Regional Comparison - Middle East and Africa

12.7.1 UAE - Market size and forecast 2025-2030

Chart on UAE - Market size and forecast 2025-2030 ($ million)
Data Table on UAE - Market size and forecast 2025-2030 ($ million)
Chart on UAE - Year-over-year growth 2025-2030 (%)
Data Table on UAE - Year-over-year growth 2025-2030 (%)

12.7.2 Saudi Arabia - Market size and forecast 2025-2030

Chart on Saudi Arabia - Market size and forecast 2025-2030 ($ million)
Data Table on Saudi Arabia - Market size and forecast 2025-2030 ($ million)
Chart on Saudi Arabia - Year-over-year growth 2025-2030 (%)
Data Table on Saudi Arabia - Year-over-year growth 2025-2030 (%)

12.7.3 South Africa - Market size and forecast 2025-2030

Chart on South Africa - Market size and forecast 2025-2030 ($ million)
Data Table on South Africa - Market size and forecast 2025-2030 ($ million)
Chart on South Africa - Year-over-year growth 2025-2030 (%)
Data Table on South Africa - Year-over-year growth 2025-2030 (%)

12.7.4 Egypt - Market size and forecast 2025-2030

Chart on Egypt - Market size and forecast 2025-2030 ($ million)
Data Table on Egypt - Market size and forecast 2025-2030 ($ million)
Chart on Egypt - Year-over-year growth 2025-2030 (%)
Data Table on Egypt - Year-over-year growth 2025-2030 (%)

12.7.5 Israel - Market size and forecast 2025-2030

Chart on Israel - Market size and forecast 2025-2030 ($ million)
Data Table on Israel - Market size and forecast 2025-2030 ($ million)
Chart on Israel - Year-over-year growth 2025-2030 (%)
Data Table on Israel - Year-over-year growth 2025-2030 (%)

12.8 Market opportunity by geography

Market opportunity by geography ($ million)
Data Tables on Market opportunity by geography ($ million)

13. Drivers, Challenges, and Opportunity

13.1 Market drivers

Increasing adoption of wearable health technology for preventative care
Rising demand for high-performance sensors in industrial UV curing
Growing implementation of smart sensing in environmental and agricultural applications

13.2 Market challenges

Overcoming solar blindness and durability in extreme environments
Standardization hurdles in transition to mercury-free UV-C solutions
Thermal instability in high-throughput manufacturing

13.3 Impact of drivers and challenges

Impact of drivers and challenges in 2025 and 2030

13.4 Market opportunities

Advancements in transparent and flexible wearable sensor technology
Innovations in high-temperature stability for industrial automation
Integration of environmental sensing in automotive smart cockpits

14. Competitive Landscape

14.1 Overview

14.2

Overview on criticality of inputs and factors of differentiation

14.3 Landscape disruption

Overview on factors of disruption

14.4 Industry risks

Impact of key risks on business

15. Competitive Analysis

15.1 Companies profiled

Companies covered

15.2 Company ranking index

15.3 Market positioning of companies

Matrix on companies position and classification

15.4 ams OSRAM AG

ams OSRAM AG - Overview
ams OSRAM AG - Business segments
ams OSRAM AG - Key news
ams OSRAM AG - Key offerings
ams OSRAM AG - Segment focus
SWOT

15.5 Broadcom Inc.

Broadcom Inc. - Overview
Broadcom Inc. - Business segments
Broadcom Inc. - Key news
Broadcom Inc. - Key offerings
Broadcom Inc. - Segment focus
SWOT

15.6 Genicom Co. Ltd.

Genicom Co. Ltd. - Overview
Genicom Co. Ltd. - Product / Service
Genicom Co. Ltd. - Key offerings
SWOT

15.7 Hamamatsu Photonics KK

Hamamatsu Photonics KK - Overview
Hamamatsu Photonics KK - Business segments
Hamamatsu Photonics KK - Key offerings
Hamamatsu Photonics KK - Segment focus
SWOT

15.8 Honeywell International Inc.

Honeywell International Inc. - Overview
Honeywell International Inc. - Business segments
Honeywell International Inc. - Key news
Honeywell International Inc. - Key offerings
Honeywell International Inc. - Segment focus
SWOT

15.9 METER Group Inc.

METER Group Inc. - Overview
METER Group Inc. - Product / Service
METER Group Inc. - Key offerings
SWOT

15.10 ROHM Co. Ltd.

ROHM Co. Ltd. - Overview
ROHM Co. Ltd. - Business segments
ROHM Co. Ltd. - Key news
ROHM Co. Ltd. - Key offerings
ROHM Co. Ltd. - Segment focus
SWOT

15.11 Scott Technical Instruments Ltd.

Scott Technical Instruments Ltd. - Overview
Scott Technical Instruments Ltd. - Product / Service
Scott Technical Instruments Ltd. - Key offerings
SWOT

15.12 sglux GmbH

sglux GmbH - Overview
sglux GmbH - Product / Service
sglux GmbH - Key offerings
SWOT

15.13 Silicon Laboratories Inc.

Silicon Laboratories Inc. - Overview
Silicon Laboratories Inc. - Product / Service
Silicon Laboratories Inc. - Key news
Silicon Laboratories Inc. - Key offerings
SWOT

15.14 Sony Semiconductor Solutions

Sony Semiconductor Solutions - Overview
Sony Semiconductor Solutions - Product / Service
Sony Semiconductor Solutions - Key offerings
SWOT

15.15 STMicroelectronics NV

STMicroelectronics NV - Overview
STMicroelectronics NV - Business segments
STMicroelectronics NV - Key news
STMicroelectronics NV - Key offerings
STMicroelectronics NV - Segment focus
SWOT

15.16 Sumita Optical Glass Inc.

Sumita Optical Glass Inc. - Overview
Sumita Optical Glass Inc. - Product / Service
Sumita Optical Glass Inc. - Key offerings
SWOT

15.17 Vernier Science Education

Vernier Science Education - Overview
Vernier Science Education - Product / Service
Vernier Science Education - Key offerings
SWOT

15.18 Vishay Intertechnology Inc.

Vishay Intertechnology Inc. - Overview
Vishay Intertechnology Inc. - Business segments
Vishay Intertechnology Inc. - Key offerings
Vishay Intertechnology Inc. - Segment focus
SWOT

16. Appendix

16.1 Scope of the report

Market definition
Objectives
Notes and caveats

16.2 Inclusions and exclusions checklist

Inclusions checklist
Exclusions checklist

16.3 Currency conversion rates for US$

16.4 Research methodology

16.5 Data procurement

Information sources

16.6 Data validation

16.7 Validation techniques employed for market sizing

16.8 Data synthesis

16.9 360 degree market analysis

16.10 List of abbreviations

Research Methodology

Technavio presents a detailed picture of the market by way of study, synthesis, and summation of data from multiple sources. The analysts have presented the various facets of the market with a particular focus on identifying the key industry influencers. The data thus presented is comprehensive, reliable, and the result of extensive research, both primary and secondary.

INFORMATION SOURCES

Primary sources

  • Manufacturers and suppliers
  • Channel partners
  • Industry experts
  • Strategic decision makers

Secondary sources

  • Industry journals and periodicals
  • Government data
  • Financial reports of key industry players
  • Historical data
  • Press releases

DATA ANALYSIS

Data Synthesis

  • Collation of data
  • Estimation of key figures
  • Analysis of derived insights

Data Validation

  • Triangulation with data models
  • Reference against proprietary databases
  • Corroboration with industry experts

REPORT WRITING

Qualitative

  • Market drivers
  • Market challenges
  • Market trends
  • Five forces analysis

Quantitative

  • Market size and forecast
  • Market segmentation
  • Geographical insights
  • Competitive landscape

Interested in this report?

Get your sample now to see our research methodology and insights!

Download Now

Frequently Asked Questions

Ultraviolet (UV) Sensor market growth will increase by USD 8541.5 million during 2026-2030.

The Ultraviolet (UV) Sensor market is expected to grow at a CAGR of 25% during 2026-2030.

Ultraviolet (UV) Sensor market is segmented by Type (UV phototubes, Light sensors, UV spectrum sensors) End-user (Industrial, Automotive, Medical, Consumer electronics, Others) Application (1-5 watt, Less than 1 watt, More than 5 watt)

ams OSRAM AG, Apogee Instruments Inc., Broadcom Inc., Davis Instruments Corp., Endress Hauser Grp Services, GaNo Optoelectronics Inc., Genicom Co. Ltd., Hamamatsu Photonics KK, Honeywell International Inc., METER Group Inc., ROHM Co. Ltd., Scott Technical Instruments Ltd., sglux GmbH, Silicon Laboratories Inc., Solar Light Co. Inc., Sony Semiconductor Solutions, STMicroelectronics NV, Sumita Optical Glass Inc., Vernier Science Education, Vishay Intertechnology Inc. are a few of the key vendors in the Ultraviolet (UV) Sensor market.

APAC will register the highest growth rate of 42.4% among the other regions. Therefore, the Ultraviolet (UV) Sensor market in APAC is expected to garner significant business opportunities for the vendors during the forecast period.

China, Japan, South Korea, India, Australia, Indonesia, US, Canada, Mexico, Germany, UK, France, Italy, Spain, The Netherlands, Brazil, Argentina, Chile, UAE, Saudi Arabia, South Africa, Egypt, Israel

  • Increasing adoption of wearable health technology for preventative care is the driving factor this market.

The Ultraviolet (UV) Sensor market vendors should focus on grabbing business opportunities from the Type segment as it accounted for the largest market share in the base year.
RIA - Research AI Assistant
Ask RIA