Treasury Automation For Smes Market Analysis, Size, and Forecast 2026-2030: North America (US, Canada, and Mexico), Europe (Germany, UK, and France), APAC (China, India, and Japan), Middle East and Africa (Saudi Arabia, UAE, and South Africa), South America (Brazil, Argentina, and Colombia), and Rest of World (ROW)

Treasury Automation For Smes Market Analysis, Size, and Forecast 2026-2030:
North America (US, Canada, and Mexico), Europe (Germany, UK, and France), APAC (China, India, and Japan), Middle East and Africa (Saudi Arabia, UAE, and South Africa), South America (Brazil, Argentina, and Colombia), and Rest of World (ROW)

Published: May 2026 299 Pages SKU: IRTNTR81331

Market Overview at a Glance

$785.6 Mn
Market Opportunity
9.9%
CAGR 2025 - 2030
39.1%
North America Growth
$682.2 Mn
Cloud based segment 2024

Treasury Automation For Smes Market Size and Growth Forecast 2026-2030

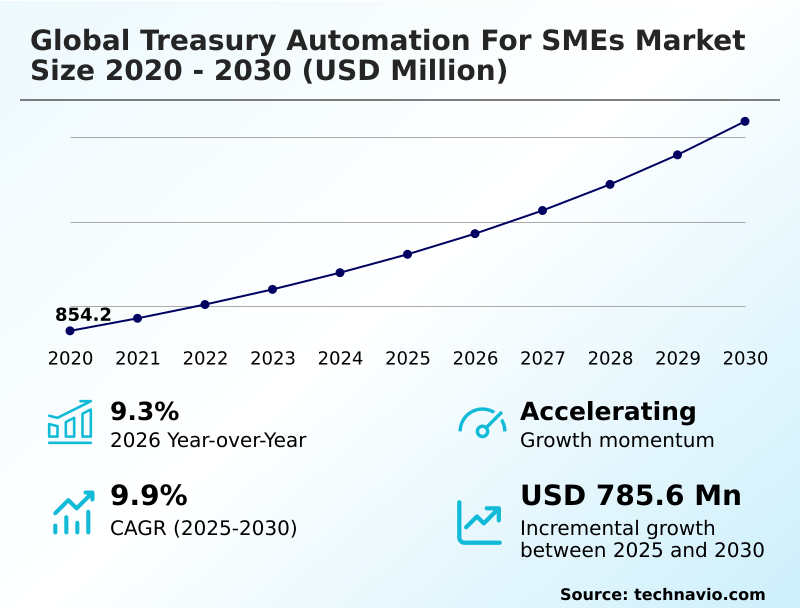
The Treasury Automation For Smes Market size was valued at USD 1.31 billion in 2025 growing at a CAGR of 9.9% during the forecast period 2026-2030.

North America accounts for 39.1% of incremental growth during the forecast period. The Cloud based segment by Deployment was valued at USD 682.2 million in 2024, while the Cash management segment holds the largest revenue share by Application.

The market is projected to grow by USD 1.24 billion from 2020 to 2030, with USD 785.6 million of the growth expected during the forecast period of 2025 to 2030.

Get Key Insights on Market Forecast (PDF) Request Free Sample

Treasury Automation For Smes Market Overview

The treasury automation for smes market is defined by a strategic shift from manual financial processes to integrated digital ecosystems. This transition is driven by the need for enhanced working capital optimization and the complexities of multi-currency management in an interconnected economy. Adherence to evolving financial reporting standards and the necessity for a clear automated audit trail are compelling smaller firms to adopt solutions that provide real-time cash visibility. In a typical scenario, a mid-market manufacturing firm implements an AI-powered treasury module integrated with its enterprise resource planning system. This allows for predictive cash flow forecasting, which anticipates a seasonal 15% dip in liquidity, prompting proactive credit line adjustments and preventing operational disruptions. Despite the efficiency gains from payment automation, significant cybersecurity risks and challenges with legacy system integration persist. With North America representing over 39% of the growth opportunity, the region's focus on digital transformation initiatives shapes vendor innovation in fraud detection modules and API-first architectures.

Drivers, Trends, and Challenges in the Treasury Automation For Smes Market

The strategic imperative for automating treasury for mid-market firms is increasingly clear as they expand into complex global markets. The necessity for treasury automation for international trade, for example, is highlighted when a mid-sized agricultural exporter faces significant foreign exchange exposure.

By leveraging cloud based treasury solutions for smes, this firm can move beyond manual spreadsheets to automate hedging strategies, protecting profit margins against currency fluctuations. The open banking impact on treasury automation has been profound, facilitating the secure, real-time data aggregation required for such strategies.

This connectivity, governed by standards like the UK's Open Banking Implementation Entity, allows platforms to provide a consolidated view of cash across multiple international banks, a task that previously consumed significant administrative resources.

Furthermore, the role of AI in treasury and risk management is pivotal; machine learning algorithms can now analyze transaction patterns to flag potential fraud with an accuracy that is several orders of magnitude greater than manual review.

This is crucial for maintaining compliance with regulations like GDPR, which impose severe penalties for data mismanagement, making robust security a non-negotiable aspect of treasury systems.

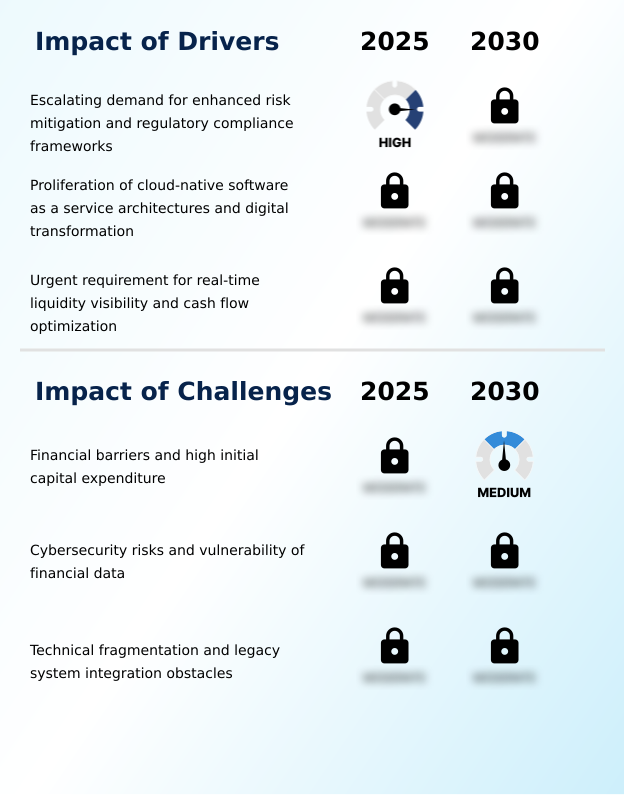
Primary Growth Driver: The escalating demand for enhanced risk mitigation and robust regulatory compliance frameworks is a primary driver compelling small and medium-sized enterprises to adopt automated treasury solutions.

A critical driver for the market is the increasing stringency of regulatory compliance frameworks worldwide, which mandates a level of financial transparency that manual processes cannot provide.

This, coupled with the urgent need for real-time liquidity visibility in a volatile economic climate, is compelling SMEs to adopt automated solutions.

The proliferation of accessible cloud-native SaaS platforms has democratized advanced treasury tools, eliminating the barrier of high initial capital expenditure.

This is particularly evident in the APAC region, which is experiencing growth of 10.6%, fueled by government-backed digital transformation initiatives and a surge in cross-border trade.

These platforms offer the scalability and security necessary for smaller firms to optimize working capital and make data-driven decisions.

Emerging Market Trend: The integration of artificial intelligence and machine learning is shifting treasury functions from descriptive analysis to predictive cash management. This enables finance leaders to anticipate liquidity fluctuations with greater precision.

A primary trend shaping the market is the integration of artificial intelligence, transitioning firms from reactive to predictive cash management. While cash management applications still command the largest market share, AI-driven forecasting tools are enhancing their strategic value.

The proliferation of open banking APIs is another key development, enabling seamless, real-time connectivity between corporate systems and financial institutions, which is critical for accurate liquidity monitoring. This API-first architecture dismantles data silos and reduces reliance on manual processes. Simultaneously, a strategic incorporation of ESG metrics integration is emerging, compelling vendors to develop modules that support sustainable finance initiatives.

This allows treasurers to track the environmental impact of investments and align financial workflows with corporate responsibility goals under frameworks like the TCFD recommendations.

Key Industry Challenge: Significant financial barriers, including high initial capital expenditure for software and implementation, remain a key challenge hindering widespread adoption within the small and medium-sized enterprise sector.

Despite clear benefits, significant financial barriers, including high upfront software and consulting costs, continue to restrain market adoption for many SMEs. Beyond cost, escalating cybersecurity risks present a major deterrent. As firms connect their financial operations to cloud platforms, their digital attack surface expands, creating vulnerabilities that smaller organizations often lack the resources to mitigate effectively.

In Europe, the stringent penalties associated with GDPR for data breaches amplify these concerns. A further obstacle is the technical challenge of legacy system integration. Many SMEs rely on disparate, older accounting systems that were not designed to communicate with modern application programming interfaces, leading to data fragmentation and hampering the full potential of automation.

Explore Full Market Dynamics Analysis Request Free Sample

Treasury Automation For Smes Market Segmentation

The treasury automation for smes industry research report provides comprehensive data including region-wise segment analysis, with forecasts and analysis for the period 2026-2030, as well as historical data from 2020-2024 for the following segments.

Market Segment by Deployment
  • Cloud based
  • On premises
Market Segment by Application
  • Cash management
  • Liquidity management
  • Payment processing
  • Risk management
  • Others
Market Segment by Business segment
  • Medium enterprises
  • Small enterprises
Market Segment by Geography
North America
US, Canada, Mexico
Europe
Germany, UK, France, Italy, Spain, The Netherlands
APAC
China, India, Japan, South Korea, Australia, Indonesia
Middle East and Africa
Saudi Arabia, UAE, South Africa, Israel, Turkey
South America
Brazil, Argentina, Colombia

Deployment Segment Analysis

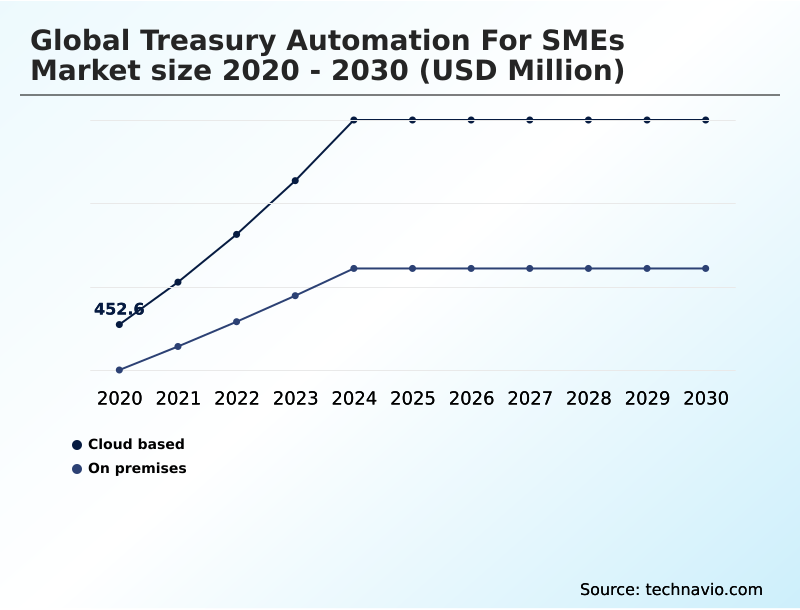
The cloud based segment is estimated to witness significant growth during the forecast period.

Cloud-based deployment models are the primary catalyst for adoption, representing a significant portion of the market at approximately 58%.

These cloud-native SaaS platforms democratize access to sophisticated financial tools, enabling small and medium-sized enterprises to achieve real-time cash visibility without prohibitive upfront capital expenditure.

The model's scalability allows for seamless integration with banking partners via standardized application programming interfaces, ensuring direct bank connectivity and enhanced working capital optimization.

By outsourcing infrastructure management, cybersecurity, and software updates to the provider, internal IT resources are freed, allowing financial teams to focus on strategic treasury management.

This agility and remote accessibility are critical for businesses adopting hybrid work models and expanding across multiple geographic regions, making it the dominant deployment choice.

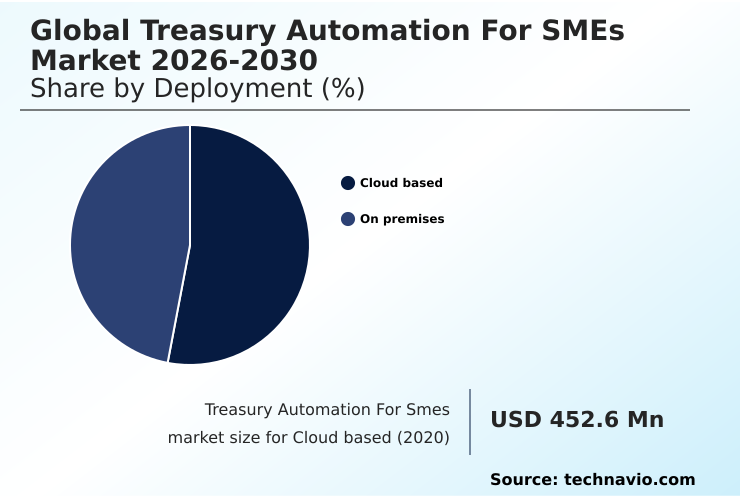
The Cloud based segment was valued at USD 682.2 million in 2024 and showed a gradual increase during the forecast period.

Treasury Automation For Smes Market by Region: North America Leads with 39.1% Growth Share

North America is estimated to contribute 39.1% to the growth of the global market during the forecast period.

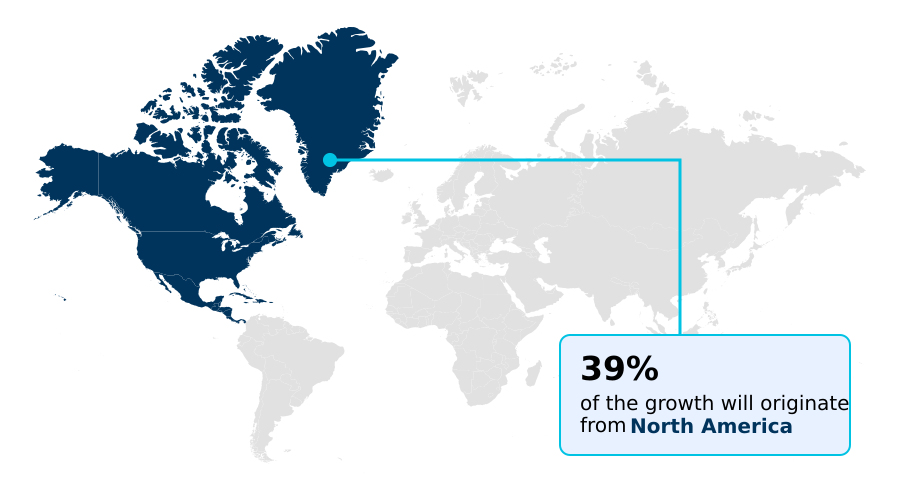
The geographic landscape is led by North America, which accounts for over 39% of the market opportunity, driven by mature financial infrastructure and high adoption of cloud technologies.

In contrast, the APAC region, representing over 26% of the opportunity, is the fastest-growing market, fueled by government-led digital transformation initiatives and the expansion of cross-border payments.

Europe’s market is heavily influenced by stringent regulatory compliance frameworks, such as the Payment Services Directive, which standardizes bank connectivity through open banking APIs. This has spurred innovation in treasury platforms that handle multi-entity and multi-currency configurations.

Meanwhile, markets in South America and the Middle East are accelerating adoption due to mandatory digital tax reporting and the need for agile financial management amid economic volatility.

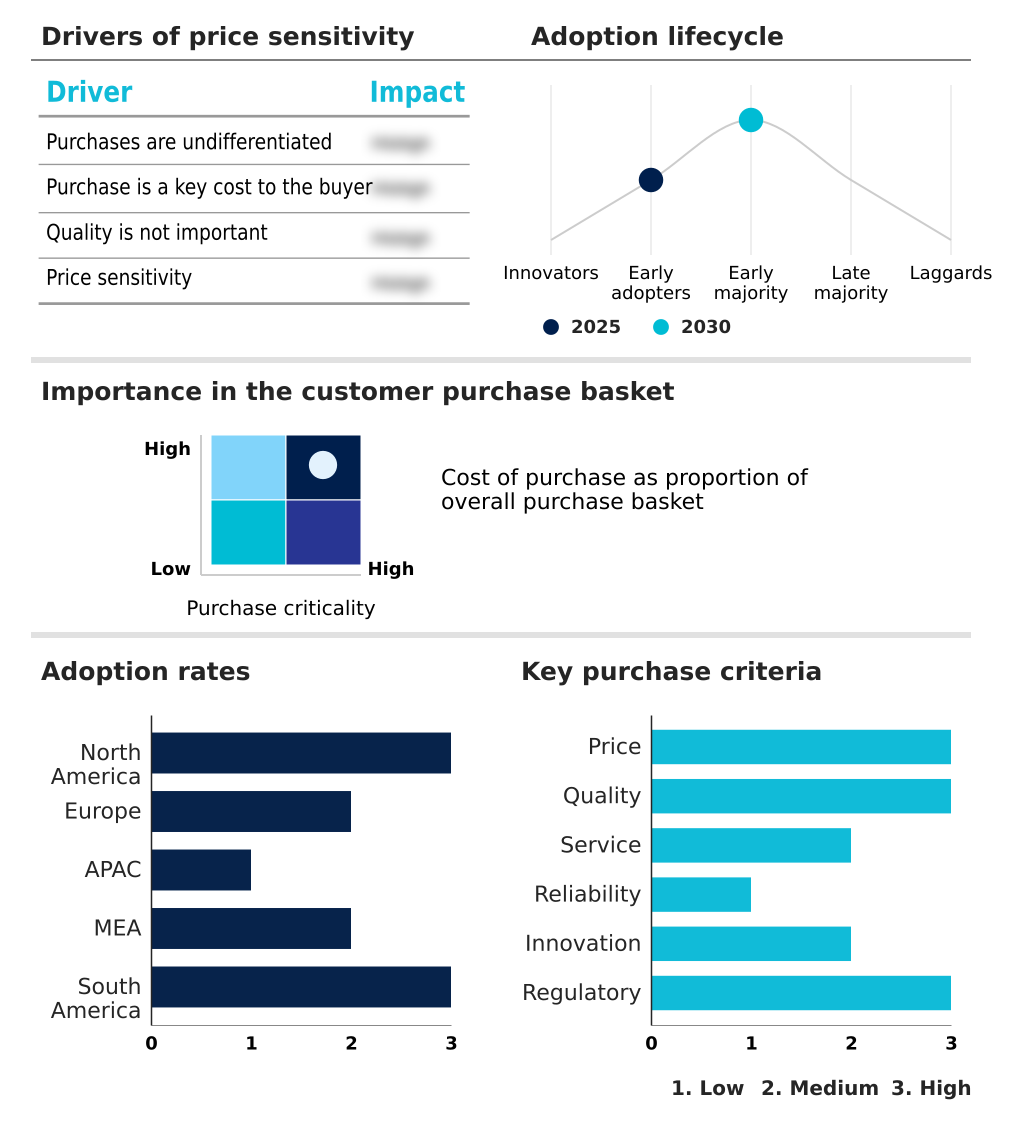
Customer Landscape Analysis for the Treasury Automation For Smes Market

The treasury automation for smes market forecasting report includes the adoption lifecycle of the market, covering from the innovator’s stage to the laggard’s stage. It focuses on adoption rates in different regions based on penetration. Furthermore, the treasury automation for smes market report also includes key purchase criteria and drivers of price sensitivity to help companies evaluate and develop their market growth analysis strategies.

Competitive Landscape of the Treasury Automation For Smes Market

Companies are implementing various strategies, such as strategic alliances, partnerships, mergers and acquisitions, geographical expansion, and product/service launches, to enhance their presence in the treasury automation for smes market industry.

Access Workspace Australia Ltd. - Core offerings center on cloud-based platforms that automate liquidity management, payment execution, and risk mitigation, providing SMEs with tools for comprehensive financial oversight and operational efficiency.

The industry research and growth report includes detailed analyses of the competitive landscape of the market and information about key companies, including:

  • Access Workspace Australia Ltd.
  • Bottomline Technologies Inc.
  • Commitly GmbH
  • Coupa Software Inc.
  • Fidelity National Information.
  • Finastra
  • GTreasury
  • HazelTree Fund Services Inc.
  • HighRadius Corp.
  • ION Group.
  • Kantox Ltd.
  • Kyriba Corp.
  • Nomentia Oy.
  • Oracle Corp.
  • Sage Group Plc
  • Salmon Software Ltd.
  • Serrala Group GmbH.
  • Treasury Systems Sweden AB.
  • Trovata Inc.
  • ZenTreasury Ltd.

Qualitative and quantitative analysis of companies has been conducted to help clients understand the wider business environment as well as the strengths and weaknesses of key industry players. Data is qualitatively analyzed to categorize companies as pure play, category-focused, industry-focused, and diversified; it is quantitatively analyzed to categorize companies as dominant, leading, strong, tentative, and weak.

Recent Developments in the Treasury Automation For Smes Market

  • In May, 2025, HighRadius introduced a suite of autonomous treasury functions that utilize generative AI to deliver predictive cash flow insights for mid-market firms, enhancing liquidity trend identification.
  • In September, 2025, a prominent North American financial technology consortium launched the Unified Cloud Treasury Initiative, which provides a standardized set of integration protocols for small enterprises to link cloud-based accounting software with regional banking networks.
  • In November, 2025, the Reserve Bank of India expanded its digital payment infrastructure to include a dedicated liquidity sweeping module for small businesses, automating the movement of surplus funds into interest-bearing accounts.
  • In March, 2025, a UK-based financial technology group expanded its open banking network to several nations in Southeast Asia, providing direct bank connectivity for mid-market corporate treasurers to automate cross-border transaction reconciliation.

Research Analyst Overview: Treasury Automation For Smes Market

The treasury automation for smes market is expanding at a steady 9.3% year-over-year, driven not by choice but by operational necessity. Boardroom-level decisions are now directly tied to the adoption of these platforms, as the failure to achieve real-time cash visibility presents a material risk in volatile economic conditions.

The strategic focus has shifted from simple payment automation to sophisticated cash flow forecasting and multi-currency management, essential for any SME participating in global trade.

For instance, the integration of automated reconciliation tools is no longer just an efficiency play; it is a core component of maintaining accurate financial records for audits and ensuring adherence to stringent regulatory compliance frameworks, including international Know Your Customer (KYC) protocols.

The decision to invest in a modern treasury management system is now a fundamental aspect of corporate governance, directly impacting a firm’s ability to manage liquidity, mitigate risk, and scale operations securely.

Dive into Technavio’s robust research methodology, blending expert interviews, extensive data synthesis, and validated models for unparalleled Treasury Automation For Smes Market insights. See full methodology.

Request Free Sample

Market Scope
Page number 299
Base year 2025
Historic period 2020-2024
Forecast period 2026-2030
Growth momentum & CAGR Accelerate at a CAGR of 9.9%
Market growth 2026-2030 USD 785.6 million
Market structure Fragmented
YoY growth 2025-2026(%) 9.3%
Key countries US, Canada, Mexico, Germany, UK, France, Italy, Spain, The Netherlands, China, India, Japan, South Korea, Australia, Indonesia, Saudi Arabia, UAE, South Africa, Israel, Turkey, Brazil, Argentina and Colombia
Competitive landscape Leading Companies, Market Positioning of Companies, Competitive Strategies, and Industry Risks

Treasury Automation For Smes Market: Key Questions Answered in This Report

  • What is the expected growth of the Treasury Automation For Smes Market between 2026 and 2030?

    • The Treasury Automation For Smes Market is expected to grow by USD 785.6 million during 2026-2030, registering a CAGR of 9.9%. Year-over-year growth in 2026 is estimated at 9.3%%. This acceleration is shaped by escalating demand for enhanced risk mitigation and regulatory compliance frameworks, which is intensifying demand across multiple end-use verticals covered in the report.

  • What segmentation does the market report cover?

    • The report is segmented by Deployment (Cloud based, and On premises), Application (Cash management, Liquidity management, Payment processing, Risk management, and Others), Business Segment (Medium enterprises, and Small enterprises) and Geography (North America, Europe, APAC, Middle East and Africa, South America). Among these, the Cloud based segment is estimated to witness significant growth during the forecast period, driven by rising adoption across key application areas. Each segment includes detailed qualitative and quantitative analysis, along with historical data from 2020-2024 and forecasts through 2030 with year-over-year growth rates.

  • Which regions are analyzed in the report?

    • The report covers North America, Europe, APAC, Middle East and Africa and South America. North America is estimated to contribute 39.1% to market growth during the forecast period. Country-level analysis includes US, Canada, Mexico, Germany, UK, France, Italy, Spain, The Netherlands, China, India, Japan, South Korea, Australia, Indonesia, Saudi Arabia, UAE, South Africa, Israel, Turkey, Brazil, Argentina and Colombia, with dedicated market size tables and year-over-year growth for each.

  • What are the key growth drivers and market challenges?

    • The primary driver is escalating demand for enhanced risk mitigation and regulatory compliance frameworks, which is accelerating investment and industry demand. The main challenge is financial barriers and high initial capital expenditure, creating operational barriers for key market participants. The report quantifies the impact of each driver and challenge across 2026 and 2030 with comparative analysis.

  • Who are the major players in the Treasury Automation For Smes Market?

    • Key vendors include Access Workspace Australia Ltd., Bottomline Technologies Inc., Commitly GmbH, Coupa Software Inc., Fidelity National Information., Finastra, GTreasury, HazelTree Fund Services Inc., HighRadius Corp., ION Group., Kantox Ltd., Kyriba Corp., Nomentia Oy., Oracle Corp., Sage Group Plc, Salmon Software Ltd., Serrala Group GmbH., Treasury Systems Sweden AB., Trovata Inc. and ZenTreasury Ltd.. The report provides qualitative and quantitative analysis categorizing companies as dominant, leading, strong, tentative, and weak based on their market positioning. Company profiles include business segment analysis, SWOT assessment, key offerings, and recent strategic developments.

Treasury Automation For Smes Market Research Insights

Market dynamics are increasingly shaped by the demand for real-time liquidity visibility, compelling a definitive shift from on-premise systems to more agile cloud-based platforms, which have historically shown a significantly higher adoption rate. This transition is amplified by the rise of AI-powered treasury solutions that offer predictive insights and automate complex workflows.

As open banking protocols mature, the trend toward embedded finance accelerates, integrating treasury functions directly into enterprise workflows. This facilitates more efficient management of cross-border payments and foreign exchange exposure.

Concurrently, a growing focus on sustainable finance is driving the need for ESG metrics integration within treasury platforms, allowing firms to align financial operations with corporate responsibility goals and satisfy investor requirements under frameworks like the EU's SFDR.

We can help! Our analysts can customize this treasury automation for smes market research report to meet your requirements.

Get in touch

1. Executive Summary

1.1 Market overview

Executive Summary - Chart on Market Overview
Executive Summary - Data Table on Market Overview
Executive Summary - Chart on Global Market Characteristics
Executive Summary - Chart on Market by Geography
Executive Summary - Chart on Market Segmentation by Deployment
Executive Summary - Chart on Market Segmentation by Application
Executive Summary - Chart on Market Segmentation by Business Segment
Executive Summary - Chart on Incremental Growth
Executive Summary - Data Table on Incremental Growth
Executive Summary - Chart on Company Market Positioning

2. Technavio Analysis

2.1 Analysis of price sensitivity, lifecycle, customer purchase basket, adoption rates, and purchase criteria

2.2 Criticality of inputs and Factors of differentiation

Chart on Overview on criticality of inputs and factors of differentiation

2.3 Factors of disruption

Chart on Overview on factors of disruption

2.4 Impact of drivers and challenges

Chart on Impact of drivers and challenges in 2025 and 2030

3. Market Landscape

3.1 Market ecosystem

Chart on Parent Market
Data Table on - Parent Market

3.2 Market characteristics

Chart on Market characteristics analysis

3.3 Value chain analysis

Chart on Value chain analysis

4. Market Sizing

4.1 Market definition

Data Table on Offerings of companies included in the market definition

4.2 Market segment analysis

Market segments

4.3 Market size 2025

4.4 Market outlook: Forecast for 2025-2030

Chart on Global - Market size and forecast 2025-2030 ($ million)
Data Table on Global - Market size and forecast 2025-2030 ($ million)
Chart on Global Market: Year-over-year growth 2025-2030 (%)
Data Table on Global Market: Year-over-year growth 2025-2030 (%)

5. Historic Market Size

5.1 Global Treasury Automation For SMEs Market 2020 - 2024

Historic Market Size - Data Table on Global Treasury Automation For SMEs Market 2020 - 2024 ($ million)

5.2 Deployment segment analysis 2020 - 2024

Historic Market Size - Deployment Segment 2020 - 2024 ($ million)

5.3 Application segment analysis 2020 - 2024

Historic Market Size - Application Segment 2020 - 2024 ($ million)

5.4 Business segment analysis 2020 - 2024

Historic Market Size - Business Segment 2020 - 2024 ($ million)

5.5 Geography segment analysis 2020 - 2024

Historic Market Size - Geography Segment 2020 - 2024 ($ million)

5.6 Country segment analysis 2020 - 2024

Historic Market Size - Country Segment 2020 - 2024 ($ million)

6. Qualitative Analysis

6.1 The AI impact on Global Treasury Automation for SMEs Market

7. Five Forces Analysis

7.1 Five forces summary

Five forces analysis - Comparison between 2025 and 2030

7.2 Bargaining power of buyers

Bargaining power of buyers - Impact of key factors 2025 and 2030

7.3 Bargaining power of suppliers

Bargaining power of suppliers - Impact of key factors in 2025 and 2030

7.4 Threat of new entrants

Threat of new entrants - Impact of key factors in 2025 and 2030

7.5 Threat of substitutes

Threat of substitutes - Impact of key factors in 2025 and 2030

7.6 Threat of rivalry

Threat of rivalry - Impact of key factors in 2025 and 2030

7.7 Market condition

Chart on Market condition - Five forces 2025 and 2030

8. Market Segmentation by Deployment

8.1 Market segments

Chart on Deployment - Market share 2025-2030 (%)
Data Table on Deployment - Market share 2025-2030 (%)

8.2 Comparison by Deployment

Chart on Comparison by Deployment
Data Table on Comparison by Deployment

8.3 Cloud based - Market size and forecast 2025-2030

Chart on Cloud based - Market size and forecast 2025-2030 ($ million)
Data Table on Cloud based - Market size and forecast 2025-2030 ($ million)
Chart on Cloud based - Year-over-year growth 2025-2030 (%)
Data Table on Cloud based - Year-over-year growth 2025-2030 (%)

8.4 On premises - Market size and forecast 2025-2030

Chart on On premises - Market size and forecast 2025-2030 ($ million)
Data Table on On premises - Market size and forecast 2025-2030 ($ million)
Chart on On premises - Year-over-year growth 2025-2030 (%)
Data Table on On premises - Year-over-year growth 2025-2030 (%)

8.5 Market opportunity by Deployment

Market opportunity by Deployment ($ million)
Data Table on Market opportunity by Deployment ($ million)

9. Market Segmentation by Application

9.1 Market segments

Chart on Application - Market share 2025-2030 (%)
Data Table on Application - Market share 2025-2030 (%)

9.2 Comparison by Application

Chart on Comparison by Application
Data Table on Comparison by Application

9.3 Cash management - Market size and forecast 2025-2030

Chart on Cash management - Market size and forecast 2025-2030 ($ million)
Data Table on Cash management - Market size and forecast 2025-2030 ($ million)
Chart on Cash management - Year-over-year growth 2025-2030 (%)
Data Table on Cash management - Year-over-year growth 2025-2030 (%)

9.4 Liquidity management - Market size and forecast 2025-2030

Chart on Liquidity management - Market size and forecast 2025-2030 ($ million)
Data Table on Liquidity management - Market size and forecast 2025-2030 ($ million)
Chart on Liquidity management - Year-over-year growth 2025-2030 (%)
Data Table on Liquidity management - Year-over-year growth 2025-2030 (%)

9.5 Payment processing - Market size and forecast 2025-2030

Chart on Payment processing - Market size and forecast 2025-2030 ($ million)
Data Table on Payment processing - Market size and forecast 2025-2030 ($ million)
Chart on Payment processing - Year-over-year growth 2025-2030 (%)
Data Table on Payment processing - Year-over-year growth 2025-2030 (%)

9.6 Risk management - Market size and forecast 2025-2030

Chart on Risk management - Market size and forecast 2025-2030 ($ million)
Data Table on Risk management - Market size and forecast 2025-2030 ($ million)
Chart on Risk management - Year-over-year growth 2025-2030 (%)
Data Table on Risk management - Year-over-year growth 2025-2030 (%)

9.7 Others - Market size and forecast 2025-2030

Chart on Others - Market size and forecast 2025-2030 ($ million)
Data Table on Others - Market size and forecast 2025-2030 ($ million)
Chart on Others - Year-over-year growth 2025-2030 (%)
Data Table on Others - Year-over-year growth 2025-2030 (%)

9.8 Market opportunity by Application

Market opportunity by Application ($ million)
Data Table on Market opportunity by Application ($ million)

10. Market Segmentation by Business Segment

10.1 Market segments

Chart on Market Segmentation by Business Segment - Market share 2025-2030 (%)
Data Table on Market Segmentation by Business Segment - Market share 2025-2030 (%)

10.2 Comparison by Market Segmentation by Business Segment

Chart on Comparison by Market Segmentation by Business Segment
Data Table on Comparison by Market Segmentation by Business Segment

10.3 Medium enterprises - Market size and forecast 2025-2030

Chart on Medium enterprises - Market size and forecast 2025-2030 ($ million)
Data Table on Medium enterprises - Market size and forecast 2025-2030 ($ million)
Chart on Medium enterprises - Year-over-year growth 2025-2030 (%)
Data Table on Medium enterprises - Year-over-year growth 2025-2030 (%)

10.4 Small enterprises - Market size and forecast 2025-2030

Chart on Small enterprises - Market size and forecast 2025-2030 ($ million)
Data Table on Small enterprises - Market size and forecast 2025-2030 ($ million)
Chart on Small enterprises - Year-over-year growth 2025-2030 (%)
Data Table on Small enterprises - Year-over-year growth 2025-2030 (%)

10.5 Market opportunity by Market Segmentation by Business Segment

Market opportunity by Market Segmentation by Business Segment ($ million)
Data Table on Market opportunity by Market Segmentation by Business Segment ($ million)

11. Customer Landscape

11.1 Customer landscape overview

Analysis of price sensitivity, lifecycle, customer purchase basket, adoption rates, and purchase criteria

12. Geographic Landscape

12.1 Geographic segmentation

Chart on Market share by geography 2025-2030 (%)
Data Table on Market share by geography 2025-2030 (%)

12.2 Geographic comparison

Chart on Geographic comparison
Data Table on Geographic comparison

12.3 North America - Market size and forecast 2025-2030

Chart on North America - Market size and forecast 2025-2030 ($ million)
Data Table on North America - Market size and forecast 2025-2030 ($ million)
Chart on North America - Year-over-year growth 2025-2030 (%)
Data Table on North America - Year-over-year growth 2025-2030 (%)
Chart on Regional Comparison - North America
Data Table on Regional Comparison - North America

12.3.1 US - Market size and forecast 2025-2030

Chart on US - Market size and forecast 2025-2030 ($ million)
Data Table on US - Market size and forecast 2025-2030 ($ million)
Chart on US - Year-over-year growth 2025-2030 (%)
Data Table on US - Year-over-year growth 2025-2030 (%)

12.3.2 Canada - Market size and forecast 2025-2030

Chart on Canada - Market size and forecast 2025-2030 ($ million)
Data Table on Canada - Market size and forecast 2025-2030 ($ million)
Chart on Canada - Year-over-year growth 2025-2030 (%)
Data Table on Canada - Year-over-year growth 2025-2030 (%)

12.3.3 Mexico - Market size and forecast 2025-2030

Chart on Mexico - Market size and forecast 2025-2030 ($ million)
Data Table on Mexico - Market size and forecast 2025-2030 ($ million)
Chart on Mexico - Year-over-year growth 2025-2030 (%)
Data Table on Mexico - Year-over-year growth 2025-2030 (%)

12.4 Europe - Market size and forecast 2025-2030

Chart on Europe - Market size and forecast 2025-2030 ($ million)
Data Table on Europe - Market size and forecast 2025-2030 ($ million)
Chart on Europe - Year-over-year growth 2025-2030 (%)
Data Table on Europe - Year-over-year growth 2025-2030 (%)
Chart on Regional Comparison - Europe
Data Table on Regional Comparison - Europe

12.4.1 Germany - Market size and forecast 2025-2030

Chart on Germany - Market size and forecast 2025-2030 ($ million)
Data Table on Germany - Market size and forecast 2025-2030 ($ million)
Chart on Germany - Year-over-year growth 2025-2030 (%)
Data Table on Germany - Year-over-year growth 2025-2030 (%)

12.4.2 UK - Market size and forecast 2025-2030

Chart on UK - Market size and forecast 2025-2030 ($ million)
Data Table on UK - Market size and forecast 2025-2030 ($ million)
Chart on UK - Year-over-year growth 2025-2030 (%)
Data Table on UK - Year-over-year growth 2025-2030 (%)

12.4.3 France - Market size and forecast 2025-2030

Chart on France - Market size and forecast 2025-2030 ($ million)
Data Table on France - Market size and forecast 2025-2030 ($ million)
Chart on France - Year-over-year growth 2025-2030 (%)
Data Table on France - Year-over-year growth 2025-2030 (%)

12.4.4 Italy - Market size and forecast 2025-2030

Chart on Italy - Market size and forecast 2025-2030 ($ million)
Data Table on Italy - Market size and forecast 2025-2030 ($ million)
Chart on Italy - Year-over-year growth 2025-2030 (%)
Data Table on Italy - Year-over-year growth 2025-2030 (%)

12.4.5 Spain - Market size and forecast 2025-2030

Chart on Spain - Market size and forecast 2025-2030 ($ million)
Data Table on Spain - Market size and forecast 2025-2030 ($ million)
Chart on Spain - Year-over-year growth 2025-2030 (%)
Data Table on Spain - Year-over-year growth 2025-2030 (%)

12.4.6 The Netherlands - Market size and forecast 2025-2030

Chart on The Netherlands - Market size and forecast 2025-2030 ($ million)
Data Table on The Netherlands - Market size and forecast 2025-2030 ($ million)
Chart on The Netherlands - Year-over-year growth 2025-2030 (%)
Data Table on The Netherlands - Year-over-year growth 2025-2030 (%)

12.5 APAC - Market size and forecast 2025-2030

Chart on APAC - Market size and forecast 2025-2030 ($ million)
Data Table on APAC - Market size and forecast 2025-2030 ($ million)
Chart on APAC - Year-over-year growth 2025-2030 (%)
Data Table on APAC - Year-over-year growth 2025-2030 (%)
Chart on Regional Comparison - APAC
Data Table on Regional Comparison - APAC

12.5.1 China - Market size and forecast 2025-2030

Chart on China - Market size and forecast 2025-2030 ($ million)
Data Table on China - Market size and forecast 2025-2030 ($ million)
Chart on China - Year-over-year growth 2025-2030 (%)
Data Table on China - Year-over-year growth 2025-2030 (%)

12.5.2 India - Market size and forecast 2025-2030

Chart on India - Market size and forecast 2025-2030 ($ million)
Data Table on India - Market size and forecast 2025-2030 ($ million)
Chart on India - Year-over-year growth 2025-2030 (%)
Data Table on India - Year-over-year growth 2025-2030 (%)

12.5.3 Japan - Market size and forecast 2025-2030

Chart on Japan - Market size and forecast 2025-2030 ($ million)
Data Table on Japan - Market size and forecast 2025-2030 ($ million)
Chart on Japan - Year-over-year growth 2025-2030 (%)
Data Table on Japan - Year-over-year growth 2025-2030 (%)

12.5.4 South Korea - Market size and forecast 2025-2030

Chart on South Korea - Market size and forecast 2025-2030 ($ million)
Data Table on South Korea - Market size and forecast 2025-2030 ($ million)
Chart on South Korea - Year-over-year growth 2025-2030 (%)
Data Table on South Korea - Year-over-year growth 2025-2030 (%)

12.5.5 Australia - Market size and forecast 2025-2030

Chart on Australia - Market size and forecast 2025-2030 ($ million)
Data Table on Australia - Market size and forecast 2025-2030 ($ million)
Chart on Australia - Year-over-year growth 2025-2030 (%)
Data Table on Australia - Year-over-year growth 2025-2030 (%)

12.5.6 Indonesia - Market size and forecast 2025-2030

Chart on Indonesia - Market size and forecast 2025-2030 ($ million)
Data Table on Indonesia - Market size and forecast 2025-2030 ($ million)
Chart on Indonesia - Year-over-year growth 2025-2030 (%)
Data Table on Indonesia - Year-over-year growth 2025-2030 (%)

12.6 Middle East and Africa - Market size and forecast 2025-2030

Chart on Middle East and Africa - Market size and forecast 2025-2030 ($ million)
Data Table on Middle East and Africa - Market size and forecast 2025-2030 ($ million)
Chart on Middle East and Africa - Year-over-year growth 2025-2030 (%)
Data Table on Middle East and Africa - Year-over-year growth 2025-2030 (%)
Chart on Regional Comparison - Middle East and Africa
Data Table on Regional Comparison - Middle East and Africa

12.6.1 Saudi Arabia - Market size and forecast 2025-2030

Chart on Saudi Arabia - Market size and forecast 2025-2030 ($ million)
Data Table on Saudi Arabia - Market size and forecast 2025-2030 ($ million)
Chart on Saudi Arabia - Year-over-year growth 2025-2030 (%)
Data Table on Saudi Arabia - Year-over-year growth 2025-2030 (%)

12.6.2 UAE - Market size and forecast 2025-2030

Chart on UAE - Market size and forecast 2025-2030 ($ million)
Data Table on UAE - Market size and forecast 2025-2030 ($ million)
Chart on UAE - Year-over-year growth 2025-2030 (%)
Data Table on UAE - Year-over-year growth 2025-2030 (%)

12.6.3 South Africa - Market size and forecast 2025-2030

Chart on South Africa - Market size and forecast 2025-2030 ($ million)
Data Table on South Africa - Market size and forecast 2025-2030 ($ million)
Chart on South Africa - Year-over-year growth 2025-2030 (%)
Data Table on South Africa - Year-over-year growth 2025-2030 (%)

12.6.4 Israel - Market size and forecast 2025-2030

Chart on Israel - Market size and forecast 2025-2030 ($ million)
Data Table on Israel - Market size and forecast 2025-2030 ($ million)
Chart on Israel - Year-over-year growth 2025-2030 (%)
Data Table on Israel - Year-over-year growth 2025-2030 (%)

12.6.5 Turkey - Market size and forecast 2025-2030

Chart on Turkey - Market size and forecast 2025-2030 ($ million)
Data Table on Turkey - Market size and forecast 2025-2030 ($ million)
Chart on Turkey - Year-over-year growth 2025-2030 (%)
Data Table on Turkey - Year-over-year growth 2025-2030 (%)

12.7 South America - Market size and forecast 2025-2030

Chart on South America - Market size and forecast 2025-2030 ($ million)
Data Table on South America - Market size and forecast 2025-2030 ($ million)
Chart on South America - Year-over-year growth 2025-2030 (%)
Data Table on South America - Year-over-year growth 2025-2030 (%)
Chart on Regional Comparison - South America
Data Table on Regional Comparison - South America

12.7.1 Brazil - Market size and forecast 2025-2030

Chart on Brazil - Market size and forecast 2025-2030 ($ million)
Data Table on Brazil - Market size and forecast 2025-2030 ($ million)
Chart on Brazil - Year-over-year growth 2025-2030 (%)
Data Table on Brazil - Year-over-year growth 2025-2030 (%)

12.7.2 Argentina - Market size and forecast 2025-2030

Chart on Argentina - Market size and forecast 2025-2030 ($ million)
Data Table on Argentina - Market size and forecast 2025-2030 ($ million)
Chart on Argentina - Year-over-year growth 2025-2030 (%)
Data Table on Argentina - Year-over-year growth 2025-2030 (%)

12.7.3 Colombia - Market size and forecast 2025-2030

Chart on Colombia - Market size and forecast 2025-2030 ($ million)
Data Table on Colombia - Market size and forecast 2025-2030 ($ million)
Chart on Colombia - Year-over-year growth 2025-2030 (%)
Data Table on Colombia - Year-over-year growth 2025-2030 (%)

12.8 Market opportunity by geography

Market opportunity by geography ($ million)
Data Tables on Market opportunity by geography ($ million)

13. Drivers, Challenges, and Opportunity

13.1 Market drivers

Escalating demand for enhanced risk mitigation and regulatory compliance frameworks
Proliferation of cloud-native software as a service architectures and digital transformation
Urgent requirement for real-time liquidity visibility and cash flow optimization

13.2 Market challenges

Financial barriers and high initial capital expenditure
Cybersecurity risks and vulnerability of financial data
Technical fragmentation and legacy system integration obstacles

13.3 Impact of drivers and challenges

Impact of drivers and challenges in 2025 and 2030

13.4 Market opportunities

Integration of AI and ML for predictive cash management
Expansion of open banking and API-first architectures for real-time financial connectivity
Strategic incorporation of ESG metrics and sustainable finance into treasury workflows

14. Competitive Landscape

14.1 Overview

14.2

Overview on criticality of inputs and factors of differentiation

14.3 Landscape disruption

Overview on factors of disruption

14.4 Industry risks

Impact of key risks on business

15. Competitive Analysis

15.1 Companies profiled

Companies covered

15.2 Company ranking index

15.3 Market positioning of companies

Matrix on companies position and classification

15.4 Access Workspace Australia Ltd.

Access Workspace Australia Ltd. - Overview
Access Workspace Australia Ltd. - Product / Service
Access Workspace Australia Ltd. - Key offerings
SWOT

15.5 Bottomline Technologies Inc.

Bottomline Technologies Inc. - Overview
Bottomline Technologies Inc. - Product / Service
Bottomline Technologies Inc. - Key offerings
SWOT

15.6 Commitly GmbH

Commitly GmbH - Overview
Commitly GmbH - Product / Service
Commitly GmbH - Key offerings
SWOT

15.7 Coupa Software Inc.

Coupa Software Inc. - Overview
Coupa Software Inc. - Product / Service
Coupa Software Inc. - Key offerings
SWOT

15.8 Fidelity National Information.

Fidelity National Information. - Overview
Fidelity National Information. - Business segments
Fidelity National Information. - Key news
Fidelity National Information. - Key offerings
Fidelity National Information. - Segment focus
SWOT

15.9 Finastra

Finastra - Overview
Finastra - Product / Service
Finastra - Key offerings
SWOT

15.10 GTreasury

GTreasury - Overview
GTreasury - Product / Service
GTreasury - Key offerings
SWOT

15.11 HazelTree Fund Services Inc.

HazelTree Fund Services Inc. - Overview
HazelTree Fund Services Inc. - Product / Service
HazelTree Fund Services Inc. - Key offerings
SWOT

15.12 HighRadius Corp.

HighRadius Corp. - Overview
HighRadius Corp. - Product / Service
HighRadius Corp. - Key offerings
SWOT

15.13 ION Group.

ION Group. - Overview
ION Group. - Product / Service
ION Group. - Key offerings
SWOT

15.14 Kantox Ltd.

Kantox Ltd. - Overview
Kantox Ltd. - Product / Service
Kantox Ltd. - Key offerings
SWOT

15.15 Kyriba Corp.

Kyriba Corp. - Overview
Kyriba Corp. - Product / Service
Kyriba Corp. - Key offerings
SWOT

15.16 Nomentia Oy.

Nomentia Oy. - Overview
Nomentia Oy. - Product / Service
Nomentia Oy. - Key offerings
SWOT

15.17 Oracle Corp.

Oracle Corp. - Overview
Oracle Corp. - Business segments
Oracle Corp. - Key news
Oracle Corp. - Key offerings
Oracle Corp. - Segment focus
SWOT

15.18 Sage Group Plc

Sage Group Plc - Overview
Sage Group Plc - Business segments
Sage Group Plc - Key news
Sage Group Plc - Key offerings
Sage Group Plc - Segment focus
SWOT

16. Appendix

16.1 Scope of the report

Market definition
Objectives
Notes and caveats

16.2 Inclusions and exclusions checklist

Inclusions checklist
Exclusions checklist

16.3 Currency conversion rates for US$

16.4 Research methodology

16.5 Data procurement

Information sources

16.6 Data validation

16.7 Validation techniques employed for market sizing

16.8 Data synthesis

16.9 360 degree market analysis

16.10 List of abbreviations

Research Methodology

Technavio presents a detailed picture of the market by way of study, synthesis, and summation of data from multiple sources. The analysts have presented the various facets of the market with a particular focus on identifying the key industry influencers. The data thus presented is comprehensive, reliable, and the result of extensive research, both primary and secondary.

INFORMATION SOURCES

Primary sources

  • Manufacturers and suppliers
  • Channel partners
  • Industry experts
  • Strategic decision makers

Secondary sources

  • Industry journals and periodicals
  • Government data
  • Financial reports of key industry players
  • Historical data
  • Press releases

DATA ANALYSIS

Data Synthesis

  • Collation of data
  • Estimation of key figures
  • Analysis of derived insights

Data Validation

  • Triangulation with data models
  • Reference against proprietary databases
  • Corroboration with industry experts

REPORT WRITING

Qualitative

  • Market drivers
  • Market challenges
  • Market trends
  • Five forces analysis

Quantitative

  • Market size and forecast
  • Market segmentation
  • Geographical insights
  • Competitive landscape

Interested in this report?

Get your sample now to see our research methodology and insights!

Download Now

Frequently Asked Questions

Treasury Automation For Smes market growth will increase by USD 785.6 million during 2026-2030.

The Treasury Automation For Smes market is expected to grow at a CAGR of 9.9% during 2026-2030.

Treasury Automation For Smes market is segmented by Deployment (Cloud based, On premises) Application (Cash management, Liquidity management, Payment processing, Risk management, Others) Business segment (Medium enterprises, Small enterprises)

Access Workspace Australia Ltd., Bottomline Technologies Inc., Commitly GmbH, Coupa Software Inc., Fidelity National Information., Finastra, GTreasury, HazelTree Fund Services Inc., HighRadius Corp., ION Group., Kantox Ltd., Kyriba Corp., Nomentia Oy., Oracle Corp., Sage Group Plc, Salmon Software Ltd., Serrala Group GmbH., Treasury Systems Sweden AB., Trovata Inc., ZenTreasury Ltd. are a few of the key vendors in the Treasury Automation For Smes market.

North America will register the highest growth rate of 39.1% among the other regions. Therefore, the Treasury Automation For Smes market in North America is expected to garner significant business opportunities for the vendors during the forecast period.

US, Canada, Mexico, Germany, UK, France, Italy, Spain, The Netherlands, China, India, Japan, South Korea, Australia, Indonesia, Saudi Arabia, UAE, South Africa, Israel, Turkey, Brazil, Argentina, Colombia

  • Escalating demand for enhanced risk mitigation and regulatory compliance frameworks is the driving factor this market.

The Treasury Automation For Smes market vendors should focus on grabbing business opportunities from the Deployment segment as it accounted for the largest market share in the base year.
RIA - Research AI Assistant
Ask RIA