Turbine Oil Market Analysis APAC, Europe, North America, Middle East and Africa, South America - US, Saudi Arabia, China, India, Germany - Size and Forecast 2024-2028

Turbine Oil Market Analysis APAC, Europe, North America, Middle East and Africa, South America - US, Saudi Arabia, China, India, Germany - Size and Forecast 2024-2028

Published: Jan 2024 164 Pages SKU: IRTNTR44849

Market Overview at a Glance

$630.89 Mn
Market Opportunity
8%
CAGR
6.8
YoY growth 2023-2024(%)

Turbine Oil Market Size 2024-2028

The turbine oil market size is forecast to increase by USD 630.89 million at a CAGR of 8% between 2023 and 2028.

  • The market is witnessing significant growth due to the surge in global electricity demand, driving the need for efficient power generation. The growth of combined-cycle power plants (CCPPs) is another key factor fueling market expansion. However, the marine industry's slowdown is posing a challenge to market growth. Increasingly stringent regulations on emissions and the shift towards low-emission fuels are compelling marine industries to adopt new technologies, which may impact the demand for turbine oil. Additionally, the increasing adoption of renewable energy sources and advancements in alternative lubricants are potential threats to the market. Nevertheless, the market's growth prospects remain promising, given the ongoing global electrification trend and the continuous demand for reliable and efficient power generation solutions.

What will be the Size of the Turbine Oil Market During the Forecast Period?

Turbine Oil Market Size

 Request Free Sample

  • The market is a critical segment of the global lubricants industry, primarily serving the energy sector. This market is driven by the increasing economies of scale in energy consumption and the expansion of renewable energy sources, such as wind and hydroelectric power generation. Turbine lubricating oils, including mineral-based and biobased varieties, play a vital role in ensuring the efficient operation of turbines in power generation and various industrial applications. External contamination and oxidation are significant challenges In the turbine oil industry. To address these issues, manufacturers continue to innovate, developing advanced lubrication solutions with oxidation inhibitors, corrosion inhibitors, defoamants, and demulsifiers.
  • The market is also influenced by trends in wind energy investment, policy interventions, and the growing adoption of hybrid vehicles, electric motors, and battery parity. As the demand for cleaner and more sustainable energy sources increases, the role of turbine oils in wind turbines, hydroelectric power generation, tidal power generation, and other renewable energy applications will continue to evolve.

How is this Turbine Oil Industry segmented and which is the largest segment?

The turbine oil industry research report provides comprehensive data (region-wise segment analysis), with forecasts and estimates in "USD million" for the period 2024-2028, as well as historical data from 2018-2022 for the following segments.

  • Product Type
    • Mineral oil
    • Synthetic oil
  • Application
    • Steam turbine
    • Gas turbine
    • Others
  • Geography
    • APAC
      • China
      • India
    • Europe
      • Germany
    • North America
      • US
    • Middle East and Africa
    • South America

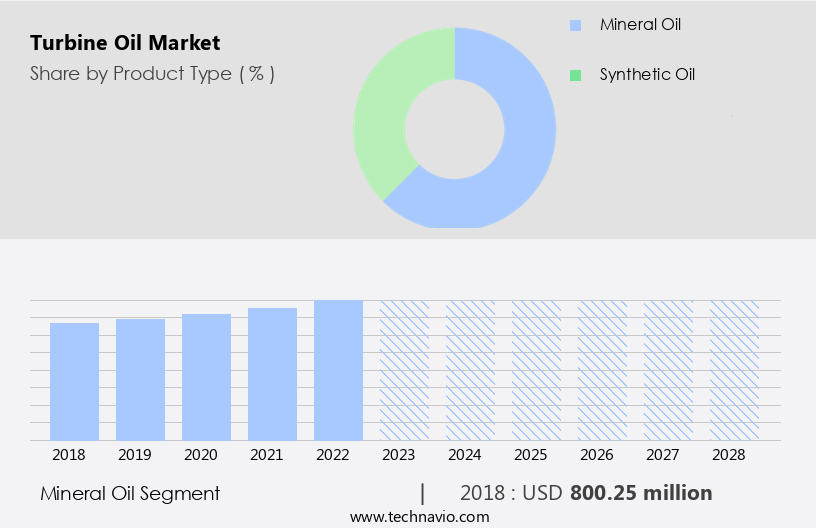
By Product Type Insights

  • The mineral oil segment is estimated to witness significant growth during the forecast period.

The market is primarily driven by the economies with high energy consumption and the increasing investment in renewable energy sources. Turbine lubricating oils, including mineral-based and synthetic types, play a crucial role In the efficient operation of turbines in various industries, such as energy generation from wind, hydroelectric power, and tidal power. Mineral oil segment dominates the turbine oil industry due to its affordability and wide applicability in different turbine types and operational conditions. However, external contamination and oxidation products pose significant challenges to the performance and longevity of turbine oils. To address these issues, manufacturers develop advanced formulations with oxidation inhibitors, corrosion inhibitors, defoamants, demulsifiers, and other additives.

The market is expected to grow due to the rising demand for renewable energy sources, particularly in wind energy, and the increasing adoption of advanced lubrication technologies. The major end-use sectors include automotive, energy generation, aviation, and manufacturing. The increasing income levels and the expanding airline sector, including commercial airplanes and military aeronautics, are also contributing to the market growth. The high heat temperature and operational costs In these sectors necessitate the use of high-performance turbine oils with excellent viscosity, anti-corrosion, anti-rust, stability against oxidation, filterability, and water-separating properties. The transition to new energy vehicles, such as electric motor and hybrid vehicles, and the implementation of battery parity are also expected to impact the market.

The lack of technologies and the high-cost capital required for direct-drive technology and slowdown In the wind turbine market may pose challenges to the market growth.

Turbine Oil Market Size

Get a glance at the  Turbine Oil Industry report of share of various segments Request Free Sample

The Mineral oil segment was valued at USD 800.25 million in 2018 and showed a gradual increase during the forecast period.

Regional Analysis

  • APAC is estimated to contribute 57% to the growth of the global market during the forecast period.

Technavio's analysts have elaborately explained the regional trends and drivers that shape the market during the forecast period.

Turbine Oil Market Share by Geography

For more insights on the market share of various regions, Request Free Sample

The market in APAC is experiencing significant growth due to the increasing demand for efficient and cleaner energy sources in developing economies, particularly in India and China. To reduce carbon emissions and promote sustainable energy production, these countries are investing in advanced technologies such as combined-cycle gas turbines (CCGT). The rising adoption of CCGTs is anticipated to fuel the demand for turbine oils in APAC. Additionally, the region's investment in renewable energy sources, including wind and solar power, presents another lucrative market for turbine oils. As wind turbines and other renewable energy systems rely on turbines for operation, the market is poised for expansion.

The turbine oil industry caters to various end-use sectors, including energy generation, automotive, aviation, and hydroelectric power generation. Turbine lubricating oils offer essential properties such as oxidation inhibitors, corrosion inhibitors, defoamants, demulsifiers, and base oil with water-separating properties. Manufacturers focus on formulating high-performance turbine oils to cater to diverse applications and meet the evolving industry demands. The market is driven by factors such as the increasing use of renewable energy sources, policy interventions, and the growing popularity of new energy vehicles like electric and hybrid vehicles. The high-cost capital requirements and slowdown in some industries, such as aviation, may present challenges to market growth.

However, the potential for technological advancements, such as direct-drive technology and high-temperature formulations, offers opportunities for market expansion.

Market Dynamics

Our  researchers analyzed the data with 2023 as the base year, along with the key drivers, trends, and challenges. A holistic analysis of drivers will help companies refine their marketing strategies to gain a competitive advantage.

What are the key market drivers leading to the rise In the adoption of Turbine Oil Industry?

Increase in global electricity demand is the key driver of the market.

  • The market plays a crucial role In the Economies' Energy Consumption as turbine lubricating oils are essential for the smooth operation and longevity of turbines used in various industries, including power generation and aerospace. Gas turbines, such as those used in combined cycle power plants, require high-quality turbine oils for electricity generation. Steam turbines, on the other hand, are commonly employed In thermal power plants. Proper lubrication with advanced turbine oils, including oxidation inhibitors, corrosion inhibitors, defoamants, demulsifiers, and base oils with water-separating properties, is vital for maintaining the efficiency and reliability of these systems. The expansion of economies and infrastructure worldwide will fuel the growth of the Turbine oil industry.
  • The increasing demand for electricity due to rising income levels and the shift towards renewable energy sources, such as wind, hydroelectric power generation, and tidal power generation, will drive the need for more power generation, leading to an increase In the number of new installations and the maintenance of existing turbines. Moreover, the market will also benefit from the Wind energy investment and Policy interventions, including incentives for renewable energy sources, as wind turbines require specialized turbine oils for their operation. The market will also experience growth due to the increasing adoption of hybrid vehicles, electric motor-driven systems, and new energy vehicles, such as passenger cars and commercial airplanes, which use turbine oils In their propulsion systems, bearings, and engines.
  • However, the market faces challenges such as the high heat temperature, formulation complexities, and the high-cost capital required for the production of advanced turbine oils. Additionally, the lack of technologies for VR solution placement and the slowdown in some industries, such as the aviation sector due to the COVID-19 pandemic, may impact the market's growth. In conclusion, the market will continue to grow as the demand for electricity and the adoption of renewable energy sources increase. Proper maintenance, inspection, and operational costs will remain crucial factors in ensuring the efficient and reliable operation of turbines, driving the need for high-quality turbine oils.

What are the market trends shaping the Turbine Oil Industry?

Growth of combined-cycle power plant (CCPP) is the upcoming market trend.

  • The market is experiencing significant growth due to the increasing demand for energy consumption and the expansion of various economies. The energy generation sector, particularly Combined Cycle Power Plants (CPPs), is a major end-use sector driving the market. CPPs utilize both gas and steam turbines for electricity generation, with gas turbines serving as the primary power source. These turbines operate under high temperatures and speeds, necessitating the use of specialized turbine oils for lubrication and cooling. The growing number of CPP installations increases the demand for turbine oils to support these gas turbine systems. In CPPs, steam turbines are also employed to utilize the waste heat generated by the gas turbines.
  • Turbine lubricating oils, including mineral-based lubricants and synthetic oil types, play a crucial role in ensuring the efficient operation of turbines. They provide essential properties such as oxidation inhibitors, corrosion inhibitors, defoamants, demulsifiers, and base oil with water-separating properties. Advanced lubrication technologies, such as high-cost capital direct-drive technology, are also contributing to the market's growth. The increasing popularity of renewable energy sources, including wind energy investment and hydroelectric power generation, is another significant factor. However, challenges such as external contamination, high heat temperature, and the lack of technologies for hybrid vehicles, electric motor lubricants, and battery parity are hindering market growth.
  • Despite these challenges, the turbine oil industry is expected to continue growing due to the rising income levels and the increasing demand for maintenance, inspection, and operational costs in various industries, including aerospace, aviation, and automotive. The market is also expected to benefit from the slowdown In the wind turbine industry due to VR solution placement and the lack of technologies for high-cost capital projects.

What challenges does the Turbine Oil Industry face during its growth?

Slowdown of the marine industry is a key challenge affecting the industry growth.

  • The market is significantly influenced by economies and energy consumption. As economies grow, the demand for energy increases, leading to a higher requirement for turbine oil in various industries, particularly energy generation. Turbine lubricating oils, including mineral-based and biobased types, play a crucial role in ensuring the efficient operation of wind turbines, hydroelectric power generation systems, and gas turbine engines in aerospace and power generation sectors. External contamination and oxidation are major challenges In the turbine oil industry. To mitigate these issues, manufacturers incorporate oxidation inhibitors, corrosion inhibitors, defoamants, demulsifiers, and other additives In the base oil. The formulation of advanced lubrication solutions is essential to meet the evolving needs of various end-use sectors, such as wind energy, automotive, aviation, and hydroelectric power generation.
  • Wind energy investment and policy interventions are driving factors for the growth of the market. The increasing adoption of renewable energy sources, such as wind energy, and the development of new energy vehicles, including hybrid vehicles and electric motor-driven systems, are expected to boost the demand for turbine oils. However, operational costs, shortage of capacity, and the lack of technologies for VR solution placement and high heat temperature are some challenges that need to be addressed. The mineral oil segment dominates the market due to its widespread use in various applications. Synthetic oil types, such as polyalphaolefin (PAO) and ester-based oils, are gaining popularity due to their superior performance in extreme operating conditions.
  • The rising income levels and the increasing demand for passenger cars and commercial airplanes In the automotive and aviation sectors, respectively, are expected to fuel the growth of the market. In conclusion, the market is a critical component of various industries, including energy generation, automotive, aviation, and aerospace. The market dynamics are influenced by factors such as economies, energy consumption, technological advancements, and regulatory policies. Manufacturers are focusing on developing advanced lubrication solutions to cater to the evolving needs of various end-use sectors and address the challenges of external contamination, oxidation, and high heat temperature.

Exclusive Customer Landscape

The turbine oil market forecasting report includes the adoption lifecycle of the market, covering from the innovator's stage to the laggard's stage. It focuses on adoption rates in different regions based on penetration. Furthermore, the turbine oil market report also includes key purchase criteria and drivers of price sensitivity to help companies evaluate and develop their market growth analysis strategies.

Turbine Oil Market Share by Geography

 Customer Landscape

Key Companies & Market Insights

Companies are implementing various strategies, such as strategic alliances, turbine oil market forecast, partnerships, mergers and acquisitions, geographical expansion, and product/service launches, to enhance their presence In the industry.

Apar Industries Ltd. - The company provides a range of turbine oils, including POWEROIL Turbo AW and POWEROIL Turbo Super AW, catering to the demands of various industries. These high-performance turbine oils ensure optimal machinery efficiency and reliability, meeting international standards for turbine oil applications. The company's offerings are designed to protect against oxidation, corrosion, and foaming, ensuring extended equipment life and reduced maintenance costs.

The industry research and growth report includes detailed analyses of the competitive landscape of the market and information about key companies, including:

  • Apar Industries Ltd.
  • Axel Christiernsson International AB
  • Behran Oil Co.
  • Castrol Ltd.
  • Chevron Corp.
  • CHS Inc.
  • Eastman Chemical Co.
  • Eni SpA
  • FUCHS PETROLUB SE
  • Growmark Inc.
  • Hindustan Petroleum Corp. Ltd.
  • Lubrication Engineers Inc.
  • Matrix Specialty Lubricants BV
  • Miguez Fuel and Lubricants
  • Petroleos de Venezuela SA
  • Phillips 66
  • Pure Lubricants Chennai Pvt. Ltd.
  • Savita Oil Technologies Ltd.
  • Shell plc
  • Sinopec Shanghai Petrochemical Co. Ltd.
  • Tide Water Oil Co. India Ltd.
  • Valvoline Inc.

Qualitative and quantitative analysis of companies has been conducted to help clients understand the wider business environment as well as the strengths and weaknesses of key industry players. Data is qualitatively analyzed to categorize companies as pure play, category-focused, industry-focused, and diversified; it is quantitatively analyzed to categorize companies as dominant, leading, strong, tentative, and weak.

Research Analyst Overview

The market encompasses a broad spectrum of lubricants designed specifically for use in turbine systems. These oils play a crucial role in ensuring the efficient operation and longevity of various turbine applications, including those in energy generation, aerospace, and automotive industries. Economies with increasing energy consumption continue to drive the demand for turbine oil. Renewable energy sources, such as wind, hydroelectric, and tidal power generation, are major end-use sectors for turbine oils. The growth In these sectors is attributed to various factors, including government incentives, technological advancements, and rising income levels. Turbine oil industry dynamics are influenced by several factors.

Mineral-based lubricants have long been the industry standard due to their cost-effectiveness and proven performance. However, the trend towards advanced lubrication technologies, such as synthetic oils, is gaining momentum. Synthetic oils offer enhanced properties, including better resistance to external contamination, oxidation products, and high heat temperatures. Biobased turbine oils are an emerging segment In the market. These oils offer sustainability benefits and are gaining popularity In the renewable energy sector. The wind energy industry, in particular, is witnessing significant investment, leading to increased demand for biobased turbine oils. Policy interventions and technological advancements are shaping the market. For instance, the shift towards electric vehicles and battery parity is impacting the demand for turbine oils In the automotive sector.

Similarly, the development of direct-drive technology and the slowdown In the aviation industry due to the COVID-19 pandemic are influencing the demand In the aerospace sector. Turbine oil manufacturers are focusing on formulating products with superior properties, such as high stability against oxidation, anti-corrosion, anti-rust, and filterability. These properties are essential for maintaining the efficiency and longevity of turbine systems. The market is characterized by high-cost capital and a lack of technologies to address the shortage of capacity. To address these challenges, virtual reality (VR) solution placement is gaining popularity. VR technology enables manufacturers to simulate turbine system conditions and optimize lubrication strategies, reducing operational costs and improving efficiency.

In conclusion, the market is a dynamic and evolving industry, influenced by various factors, including energy consumption trends, technological advancements, and policy interventions. The demand for turbine oils is driven by the need for efficient and reliable turbine systems in energy generation, aerospace, and automotive industries. Manufacturers are focusing on formulating products with superior properties to meet the evolving demands of the market.

Market Scope

Report Coverage

Details

Page number

164

Base year

2023

Historic period

2018-2022

Forecast period

2024-2028

Growth momentum & CAGR

Accelerate at a CAGR of 8%

Market growth 2024-2028

USD 630.89 million

Market structure

Fragmented

YoY growth 2023-2024(%)

6.8

Key countries

US, Saudi Arabia, China, India, and Germany

Competitive landscape

Leading Companies, Market Positioning of Companies, Competitive Strategies, and Industry Risks

Request Free Sample

What are the Key Data Covered in this Turbine Oil Market Research and Growth Report?

  • CAGR of the Turbine Oil industry during the forecast period
  • Detailed information on factors that will drive the growth and forecasting between 2024 and 2028
  • Precise estimation of the size of the market and its contribution of the industry in focus to the parent market
  • Accurate predictions about upcoming growth and trends and changes in consumer behaviour
  • Growth of the market across APAC, Europe, North America, Middle East and Africa, and South America
  • Thorough analysis of the market's competitive landscape and detailed information about companies
  • Comprehensive analysis of factors that will challenge the turbine oil market growth of industry companies

We can help! Our analysts can customize this turbine oil market research report to meet your requirements.

Get in touch

1 Executive Summary

  • 1.1 Market overview
    • Exhibit 01: Executive Summary – Chart on Market Overview
    • Exhibit 02: Executive Summary – Data Table on Market Overview
    • Exhibit 03: Executive Summary – Chart on Global Market Characteristics
    • Exhibit 04: Executive Summary – Chart on Market by Geography
    • Exhibit 05: Executive Summary – Chart on Market Segmentation by Product Type
    • Exhibit 06: Executive Summary – Chart on Market Segmentation by Application
    • Exhibit 07: Executive Summary – Chart on Incremental Growth
    • Exhibit 08: Executive Summary – Data Table on Incremental Growth
    • Exhibit 09: Executive Summary – Chart on Vendor Market Positioning

2 Market Landscape

  • 2.1 Market ecosystem
    • Exhibit 10: Parent market
    • Exhibit 11: Market Characteristics

3 Market Sizing

  • 3.1 Market definition
    • Exhibit 12: Offerings of vendors included in the market definition
  • 3.2 Market segment analysis
    • Exhibit 13: Market segments
  • 3.3 Market size 2023
    • 3.4 Market outlook: Forecast for 2023-2028
      • Exhibit 14: Chart on Global - Market size and forecast 2023-2028 ($ million)
      • Exhibit 15: Data Table on Global - Market size and forecast 2023-2028 ($ million)
      • Exhibit 16: Chart on Global Market: Year-over-year growth 2023-2028 (%)
      • Exhibit 17: Data Table on Global Market: Year-over-year growth 2023-2028 (%)

    4 Historic Market Size

    • 4.1 Global turbine oil market 2018 - 2022
      • Exhibit 18: Historic Market Size – Data Table on global turbine oil market 2018 - 2022 ($ million)
    • 4.2 Product Type Segment Analysis 2018 - 2022
      • Exhibit 19: Historic Market Size – Product Type Segment 2018 - 2022 ($ million)
    • 4.3 Application Segment Analysis 2018 - 2022
      • Exhibit 20: Historic Market Size – Application Segment 2018 - 2022 ($ million)
    • 4.4 Geography Segment Analysis 2018 - 2022
      • Exhibit 21: Historic Market Size – Geography Segment 2018 - 2022 ($ million)
    • 4.5 Country Segment Analysis 2018 - 2022
      • Exhibit 22: Historic Market Size – Country Segment 2018 - 2022 ($ million)

    5 Five Forces Analysis

    • 5.1 Five forces summary
      • Exhibit 23: Five forces analysis - Comparison between 2023 and 2028
    • 5.2 Bargaining power of buyers
      • Exhibit 24: Chart on Bargaining power of buyers – Impact of key factors 2023 and 2028
    • 5.3 Bargaining power of suppliers
      • Exhibit 25: Bargaining power of suppliers – Impact of key factors in 2023 and 2028
    • 5.4 Threat of new entrants
      • Exhibit 26: Threat of new entrants – Impact of key factors in 2023 and 2028
    • 5.5 Threat of substitutes
      • Exhibit 27: Threat of substitutes – Impact of key factors in 2023 and 2028
    • 5.6 Threat of rivalry
      • Exhibit 28: Threat of rivalry – Impact of key factors in 2023 and 2028
    • 5.7 Market condition
      • Exhibit 29: Chart on Market condition - Five forces 2023 and 2028

    6 Market Segmentation by Product Type

    • 6.1 Market segments
      • Exhibit 30: Chart on Product Type - Market share 2023-2028 (%)
      • Exhibit 31: Data Table on Product Type - Market share 2023-2028 (%)
    • 6.2 Comparison by Product Type
      • Exhibit 32: Chart on Comparison by Product Type
      • Exhibit 33: Data Table on Comparison by Product Type
    • 6.3 Mineral oil - Market size and forecast 2023-2028
      • Exhibit 34: Chart on Mineral oil - Market size and forecast 2023-2028 ($ million)
      • Exhibit 35: Data Table on Mineral oil - Market size and forecast 2023-2028 ($ million)
      • Exhibit 36: Chart on Mineral oil - Year-over-year growth 2023-2028 (%)
      • Exhibit 37: Data Table on Mineral oil - Year-over-year growth 2023-2028 (%)
    • 6.4 Synthetic oil - Market size and forecast 2023-2028
      • Exhibit 38: Chart on Synthetic oil - Market size and forecast 2023-2028 ($ million)
      • Exhibit 39: Data Table on Synthetic oil - Market size and forecast 2023-2028 ($ million)
      • Exhibit 40: Chart on Synthetic oil - Year-over-year growth 2023-2028 (%)
      • Exhibit 41: Data Table on Synthetic oil - Year-over-year growth 2023-2028 (%)
    • 6.5 Market opportunity by Product Type
      • Exhibit 42: Market opportunity by Product Type ($ million)
      • Exhibit 43: Data Table on Market opportunity by Product Type ($ million)

    7 Market Segmentation by Application

    • 7.1 Market segments
      • Exhibit 44: Chart on Application - Market share 2023-2028 (%)
      • Exhibit 45: Data Table on Application - Market share 2023-2028 (%)
    • 7.2 Comparison by Application
      • Exhibit 46: Chart on Comparison by Application
      • Exhibit 47: Data Table on Comparison by Application
    • 7.3 Steam turbine - Market size and forecast 2023-2028
      • Exhibit 48: Chart on Steam turbine - Market size and forecast 2023-2028 ($ million)
      • Exhibit 49: Data Table on Steam turbine - Market size and forecast 2023-2028 ($ million)
      • Exhibit 50: Chart on Steam turbine - Year-over-year growth 2023-2028 (%)
      • Exhibit 51: Data Table on Steam turbine - Year-over-year growth 2023-2028 (%)
    • 7.4 Gas turbine - Market size and forecast 2023-2028
      • Exhibit 52: Chart on Gas turbine - Market size and forecast 2023-2028 ($ million)
      • Exhibit 53: Data Table on Gas turbine - Market size and forecast 2023-2028 ($ million)
      • Exhibit 54: Chart on Gas turbine - Year-over-year growth 2023-2028 (%)
      • Exhibit 55: Data Table on Gas turbine - Year-over-year growth 2023-2028 (%)
    • 7.5 Others - Market size and forecast 2023-2028
      • Exhibit 56: Chart on Others - Market size and forecast 2023-2028 ($ million)
      • Exhibit 57: Data Table on Others - Market size and forecast 2023-2028 ($ million)
      • Exhibit 58: Chart on Others - Year-over-year growth 2023-2028 (%)
      • Exhibit 59: Data Table on Others - Year-over-year growth 2023-2028 (%)
    • 7.6 Market opportunity by Application
      • Exhibit 60: Market opportunity by Application ($ million)
      • Exhibit 61: Data Table on Market opportunity by Application ($ million)

    8 Customer Landscape

    • 8.1 Customer landscape overview
      • Exhibit 62: Analysis of price sensitivity, lifecycle, customer purchase basket, adoption rates, and purchase criteria

    9 Geographic Landscape

    • 9.1 Geographic segmentation
      • Exhibit 63: Chart on Market share by geography 2023-2028 (%)
      • Exhibit 64: Data Table on Market share by geography 2023-2028 (%)
    • 9.2 Geographic comparison
      • Exhibit 65: Chart on Geographic comparison
      • Exhibit 66: Data Table on Geographic comparison
    • 9.3 APAC - Market size and forecast 2023-2028
      • Exhibit 67: Chart on APAC - Market size and forecast 2023-2028 ($ million)
      • Exhibit 68: Data Table on APAC - Market size and forecast 2023-2028 ($ million)
      • Exhibit 69: Chart on APAC - Year-over-year growth 2023-2028 (%)
      • Exhibit 70: Data Table on APAC - Year-over-year growth 2023-2028 (%)
    • 9.4 Europe - Market size and forecast 2023-2028
      • Exhibit 71: Chart on Europe - Market size and forecast 2023-2028 ($ million)
      • Exhibit 72: Data Table on Europe - Market size and forecast 2023-2028 ($ million)
      • Exhibit 73: Chart on Europe - Year-over-year growth 2023-2028 (%)
      • Exhibit 74: Data Table on Europe - Year-over-year growth 2023-2028 (%)
    • 9.5 North America - Market size and forecast 2023-2028
      • Exhibit 75: Chart on North America - Market size and forecast 2023-2028 ($ million)
      • Exhibit 76: Data Table on North America - Market size and forecast 2023-2028 ($ million)
      • Exhibit 77: Chart on North America - Year-over-year growth 2023-2028 (%)
      • Exhibit 78: Data Table on North America - Year-over-year growth 2023-2028 (%)
    • 9.6 Middle East and Africa - Market size and forecast 2023-2028
      • Exhibit 79: Chart on Middle East and Africa - Market size and forecast 2023-2028 ($ million)
      • Exhibit 80: Data Table on Middle East and Africa - Market size and forecast 2023-2028 ($ million)
      • Exhibit 81: Chart on Middle East and Africa - Year-over-year growth 2023-2028 (%)
      • Exhibit 82: Data Table on Middle East and Africa - Year-over-year growth 2023-2028 (%)
    • 9.7 South America - Market size and forecast 2023-2028
      • Exhibit 83: Chart on South America - Market size and forecast 2023-2028 ($ million)
      • Exhibit 84: Data Table on South America - Market size and forecast 2023-2028 ($ million)
      • Exhibit 85: Chart on South America - Year-over-year growth 2023-2028 (%)
      • Exhibit 86: Data Table on South America - Year-over-year growth 2023-2028 (%)
    • 9.8 China - Market size and forecast 2023-2028
      • Exhibit 87: Chart on China - Market size and forecast 2023-2028 ($ million)
      • Exhibit 88: Data Table on China - Market size and forecast 2023-2028 ($ million)
      • Exhibit 89: Chart on China - Year-over-year growth 2023-2028 (%)
      • Exhibit 90: Data Table on China - Year-over-year growth 2023-2028 (%)
    • 9.9 India - Market size and forecast 2023-2028
      • Exhibit 91: Chart on India - Market size and forecast 2023-2028 ($ million)
      • Exhibit 92: Data Table on India - Market size and forecast 2023-2028 ($ million)
      • Exhibit 93: Chart on India - Year-over-year growth 2023-2028 (%)
      • Exhibit 94: Data Table on India - Year-over-year growth 2023-2028 (%)
    • 9.10 US - Market size and forecast 2023-2028
      • Exhibit 95: Chart on US - Market size and forecast 2023-2028 ($ million)
      • Exhibit 96: Data Table on US - Market size and forecast 2023-2028 ($ million)
      • Exhibit 97: Chart on US - Year-over-year growth 2023-2028 (%)
      • Exhibit 98: Data Table on US - Year-over-year growth 2023-2028 (%)
    • 9.11 Germany - Market size and forecast 2023-2028
      • Exhibit 99: Chart on Germany - Market size and forecast 2023-2028 ($ million)
      • Exhibit 100: Data Table on Germany - Market size and forecast 2023-2028 ($ million)
      • Exhibit 101: Chart on Germany - Year-over-year growth 2023-2028 (%)
      • Exhibit 102: Data Table on Germany - Year-over-year growth 2023-2028 (%)
    • 9.12 Saudi Arabia - Market size and forecast 2023-2028
      • Exhibit 103: Chart on Saudi Arabia - Market size and forecast 2023-2028 ($ million)
      • Exhibit 104: Data Table on Saudi Arabia - Market size and forecast 2023-2028 ($ million)
      • Exhibit 105: Chart on Saudi Arabia - Year-over-year growth 2023-2028 (%)
      • Exhibit 106: Data Table on Saudi Arabia - Year-over-year growth 2023-2028 (%)
    • 9.13 Market opportunity by geography
      • Exhibit 107: Market opportunity by geography ($ million)
      • Exhibit 108: Data Tables on Market opportunity by geography ($ million)

    10 Drivers, Challenges, and Trends

    • 10.1 Market drivers
      • 10.2 Market challenges
        • 10.3 Impact of drivers and challenges
          • Exhibit 109: Impact of drivers and challenges in 2023 and 2028
        • 10.4 Market trends

          11 Vendor Landscape

          • 11.1 Overview
            • 11.2 Vendor landscape
              • Exhibit 110: Overview on Criticality of inputs and Factors of differentiation
            • 11.3 Landscape disruption
              • Exhibit 111: Overview on factors of disruption
            • 11.4 Industry risks
              • Exhibit 112: Impact of key risks on business

            12 Vendor Analysis

            • 12.1 Vendors covered
              • Exhibit 113: Vendors covered
            • 12.2 Market positioning of vendors
              • Exhibit 114: Matrix on vendor position and classification
            • 12.3 Apar Industries Ltd.
              • Exhibit 115: Apar Industries Ltd. - Overview
              • Exhibit 116: Apar Industries Ltd. - Business segments
              • Exhibit 117: Apar Industries Ltd. - Key offerings
              • Exhibit 118: Apar Industries Ltd. - Segment focus
            • 12.4 Axel Christiernsson International AB
              • Exhibit 119: Axel Christiernsson International AB - Overview
              • Exhibit 120: Axel Christiernsson International AB - Product / Service
              • Exhibit 121: Axel Christiernsson International AB - Key offerings
            • 12.5 Castrol Ltd.
              • Exhibit 122: Castrol Ltd. - Overview
              • Exhibit 123: Castrol Ltd. - Product / Service
              • Exhibit 124: Castrol Ltd. - Key offerings
            • 12.6 Chevron Corp.
              • Exhibit 125: Chevron Corp. - Overview
              • Exhibit 126: Chevron Corp. - Business segments
              • Exhibit 127: Chevron Corp. - Key news
              • Exhibit 128: Chevron Corp. - Key offerings
              • Exhibit 129: Chevron Corp. - Segment focus
            • 12.7 CHS Inc.
              • Exhibit 130: CHS Inc. - Overview
              • Exhibit 131: CHS Inc. - Business segments
              • Exhibit 132: CHS Inc. - Key offerings
              • Exhibit 133: CHS Inc. - Segment focus
            • 12.8 Eastman Chemical Co.
              • Exhibit 134: Eastman Chemical Co. - Overview
              • Exhibit 135: Eastman Chemical Co. - Business segments
              • Exhibit 136: Eastman Chemical Co. - Key offerings
              • Exhibit 137: Eastman Chemical Co. - Segment focus
            • 12.9 Eni SpA
              • Exhibit 138: Eni SpA - Overview
              • Exhibit 139: Eni SpA - Business segments
              • Exhibit 140: Eni SpA - Key offerings
              • Exhibit 141: Eni SpA - Segment focus
            • 12.10 FUCHS PETROLUB SE
              • Exhibit 142: FUCHS PETROLUB SE - Overview
              • Exhibit 143: FUCHS PETROLUB SE - Business segments
              • Exhibit 144: FUCHS PETROLUB SE - Key news
              • Exhibit 145: FUCHS PETROLUB SE - Key offerings
              • Exhibit 146: FUCHS PETROLUB SE - Segment focus
            • 12.11 Growmark Inc.
              • Exhibit 147: Growmark Inc. - Overview
              • Exhibit 148: Growmark Inc. - Product / Service
              • Exhibit 149: Growmark Inc. - Key offerings
            • 12.12 Matrix Specialty Lubricants BV
              • Exhibit 150: Matrix Specialty Lubricants BV - Overview
              • Exhibit 151: Matrix Specialty Lubricants BV - Product / Service
              • Exhibit 152: Matrix Specialty Lubricants BV - Key offerings
            • 12.13 Petroleos de Venezuela SA
              • Exhibit 153: Petroleos de Venezuela SA - Overview
              • Exhibit 154: Petroleos de Venezuela SA - Product / Service
              • Exhibit 155: Petroleos de Venezuela SA - Key offerings
            • 12.14 Phillips 66
              • Exhibit 156: Phillips 66 - Overview
              • Exhibit 157: Phillips 66 - Business segments
              • Exhibit 158: Phillips 66 - Key offerings
              • Exhibit 159: Phillips 66 - Segment focus
            • 12.15 Shell plc
              • Exhibit 160: Shell plc - Overview
              • Exhibit 161: Shell plc - Business segments
              • Exhibit 162: Shell plc - Key offerings
              • Exhibit 163: Shell plc - Segment focus
            • 12.16 Sinopec Shanghai Petrochemical Co. Ltd.
              • Exhibit 164: Sinopec Shanghai Petrochemical Co. Ltd. - Overview
              • Exhibit 165: Sinopec Shanghai Petrochemical Co. Ltd. - Business segments
              • Exhibit 166: Sinopec Shanghai Petrochemical Co. Ltd. - Key news
              • Exhibit 167: Sinopec Shanghai Petrochemical Co. Ltd. - Key offerings
              • Exhibit 168: Sinopec Shanghai Petrochemical Co. Ltd. - Segment focus
            • 12.17 Valvoline Inc.
              • Exhibit 169: Valvoline Inc. - Overview
              • Exhibit 170: Valvoline Inc. - Product / Service
              • Exhibit 171: Valvoline Inc. - Key offerings

            13 Appendix

            • 13.1 Scope of the report
              • 13.2 Inclusions and exclusions checklist
                • Exhibit 172: Inclusions checklist
                • Exhibit 173: Exclusions checklist
              • 13.3 Currency conversion rates for US$
                • Exhibit 174: Currency conversion rates for US$
              • 13.4 Research methodology
                • Exhibit 175: Research methodology
                • Exhibit 176: Validation techniques employed for market sizing
                • Exhibit 177: Information sources
              • 13.5 List of abbreviations
                • Exhibit 178: List of abbreviations

              Research Methodology

              Technavio presents a detailed picture of the market by way of study, synthesis, and summation of data from multiple sources. The analysts have presented the various facets of the market with a particular focus on identifying the key industry influencers. The data thus presented is comprehensive, reliable, and the result of extensive research, both primary and secondary.

              INFORMATION SOURCES

              Primary sources

              • Manufacturers and suppliers
              • Channel partners
              • Industry experts
              • Strategic decision makers

              Secondary sources

              • Industry journals and periodicals
              • Government data
              • Financial reports of key industry players
              • Historical data
              • Press releases

              DATA ANALYSIS

              Data Synthesis

              • Collation of data
              • Estimation of key figures
              • Analysis of derived insights

              Data Validation

              • Triangulation with data models
              • Reference against proprietary databases
              • Corroboration with industry experts

              REPORT WRITING

              Qualitative

              • Market drivers
              • Market challenges
              • Market trends
              • Five forces analysis

              Quantitative

              • Market size and forecast
              • Market segmentation
              • Geographical insights
              • Competitive landscape

              Interested in this report?

              Get your sample now to see our research methodology and insights!

              Download Now

              Frequently Asked Questions

              Turbine Oil market growth will increase by $ 630.89 mn during 2024-2028.

              The Turbine Oil market is expected to grow at a CAGR of 8% during 2024-2028.

              Turbine Oil market is segmented by Product Type( Mineral oil, Synthetic oil) Application( Steam turbine, Gas turbine, Others, MEA, South America)

              Apar Industries Ltd., Axel Christiernsson International AB, Behran Oil Co., Castrol Ltd., Chevron Corp., CHS Inc., Eastman Chemical Co., Eni SpA, FUCHS PETROLUB SE, Growmark Inc., Hindustan Petroleum Corp. Ltd., Lubrication Engineers Inc., Matrix Specialty Lubricants BV, Miguez Fuel and Lubricants, Petroleos de Venezuela SA, Phillips 66, Pure Lubricants Chennai Pvt. Ltd., Savita Oil Technologies Ltd., Shell plc, Sinopec Shanghai Petrochemical Co. Ltd., Tide Water Oil Co. India Ltd., Valvoline Inc. are a few of the key vendors in the Turbine Oil market.

              APAC will register the highest growth rate of 57% among the other regions. Therefore, the Turbine Oil market in APAC is expected to garner significant business opportunities for the vendors during the forecast period.

              US, Saudi Arabia, China, India, Germany

              • Increase in global electricity demandAs countries continue to expand their economies is the driving factor this market.
              • industries is the driving factor this market.
              • and infrastructure is the driving factor this market.
              • the need for reliable and efficient power generation becomes paramount. Turbine oils are fundamental in ensuring the smooth operation and longevity of turbines used in power plants. Gas turbines is the driving factor this market.
              • for instance is the driving factor this market.
              • are widely used in combined cycle power plants for electricity generation is the driving factor this market.
              • and steam turbines are commonly employed in thermal power plants. Proper lubrication with high-quality turbine oils is essential for maintaining the efficiency and reliability of these systems. The growth of the global turbine oil market will rise with the growth of global electricity demand as there will be a need for more power generation is the driving factor this market.
              • which in turn will drive the use of more machinery such as turbines and generators; thus is the driving factor this market.
              • the need for more machinery will increase the number of new installations as well as the maintenance of existing turbines. From a power generation point of view is the driving factor this market.
              • IEA estimated that the global demand for electricity from fossil fuels is expected to reach 61% by 2023. This is is the driving factor this market.
              • however is the driving factor this market.
              • contingent upon the actions and implementations of protocols regarding the development of an environmentally sustainable system. Increasing industrialization is the driving factor this market.
              • urbanization is the driving factor this market.
              • and infrastructure development globally lead to greater demand for electricity. This demand necessitates the installation and operation of turbines in various settings is the driving factor this market.
              • further boosting the need for turbine oils is the driving factor this market.
              • which will positively impact the growth of the global market in focus during the forecast period. is the driving factor this market.

              The Turbine Oil market vendors should focus on grabbing business opportunities from the Mineral oil segment as it accounted for the largest market share in the base year.
              RIA - Research AI Assistant
              Ask RIA