Electric Motors For IC Engine Vehicles Market Analysis, Size, and Forecast 2026-2030: APAC (China, Japan, and India), Europe (Germany, UK, and France), North America (US, Canada, and Mexico), South America (Brazil, Argentina, and Colombia), Middle East and Africa (Saudi Arabia, UAE, and South Africa), and Rest of World (ROW)

Electric Motors For IC Engine Vehicles Market Analysis, Size, and Forecast 2026-2030:
APAC (China, Japan, and India), Europe (Germany, UK, and France), North America (US, Canada, and Mexico), South America (Brazil, Argentina, and Colombia), Middle East and Africa (Saudi Arabia, UAE, and South Africa), and Rest of World (ROW)

Published: Jan 2026 285 Pages SKU: IRTNTR74037

Market Overview at a Glance

$266.5 Mn
Market Opportunity
6%
CAGR 2025 - 2030
60.5%
APAC Growth
$564.9 Mn
Passenger cars segment 2024

Electric Motors For IC Engine Vehicles Market Size 2026-2030

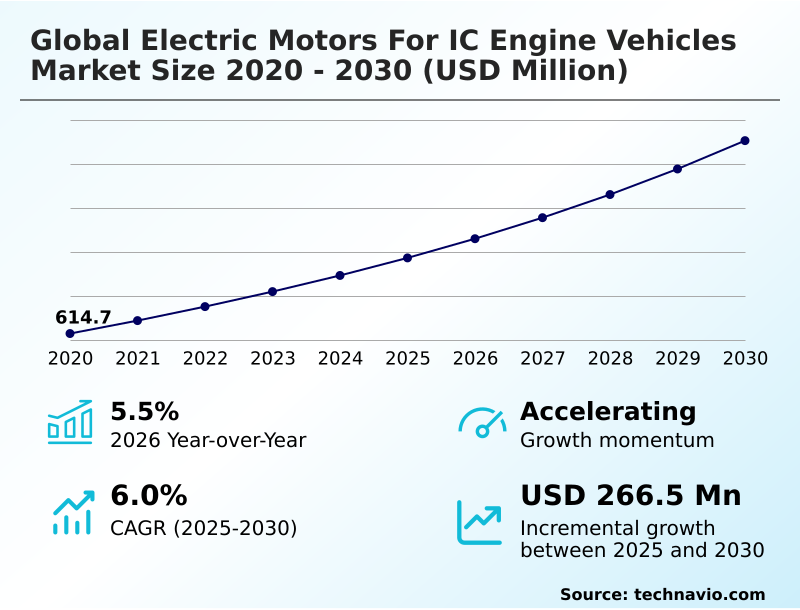
The electric motors for ic engine vehicles market size is valued to increase by USD 266.5 million, at a CAGR of 6% from 2025 to 2030. Electrification of ancillary components for thermal and mechanical efficiency will drive the electric motors for ic engine vehicles market.

Major Market Trends & Insights

  • APAC dominated the market and accounted for a 60.5% growth during the forecast period.
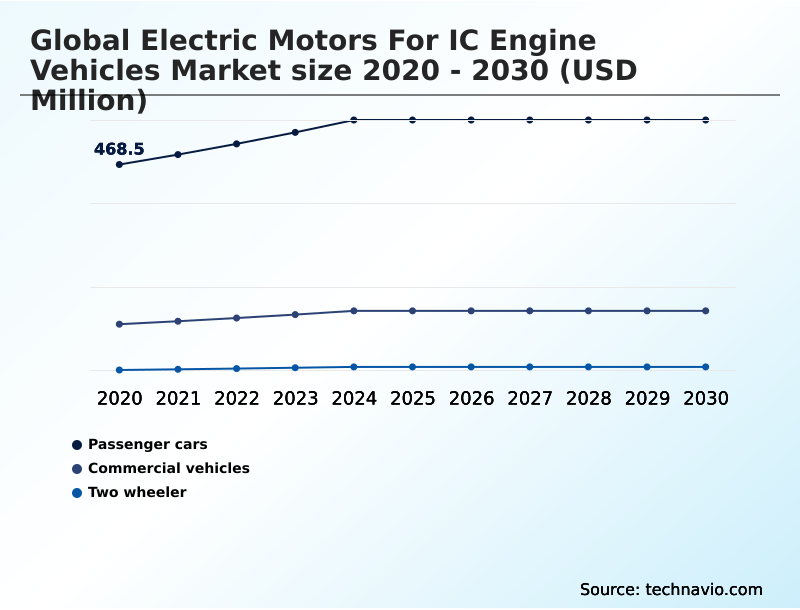
  • By Vehicle Type - Passenger cars segment was valued at USD 564.9 million in 2024
  • By Type - AC motor segment accounted for the largest market revenue share in 2024

Market Size & Forecast

  • Market Opportunities: USD 438.4 million
  • Market Future Opportunities: USD 266.5 million
  • CAGR from 2025 to 2030 : 6%

Market Summary

  • The electric motors for ic engine vehicles market is shaped by the persistent need to enhance vehicle efficiency and functionality. This demand is driven by the systematic replacement of mechanical components with sophisticated electric motors to reduce parasitic engine load and meet stringent emissions targets. Key applications include electric power steering, advanced thermal management systems, and a multitude of comfort-related actuators.
  • The industry is witnessing a definitive transition from brushed DC motors to more durable and efficient brushless DC motors, particularly in critical safety and comfort systems. This technological shift requires suppliers to navigate a complex landscape, balancing investment in legacy ICE platforms with the broader industry pivot toward full electrification.
  • A central operational scenario involves Tier-1 suppliers making strategic R&D allocation decisions, weighing the short-term revenue from high-volume orders for components like integrated starter-generator units against long-term investments in traction motors for electric vehicles.
  • This dynamic forces a focus on creating modular and scalable motor designs that can serve both hybrid and conventional architectures, ensuring operational agility in a competitive environment where both cost-effectiveness and technological innovation are paramount.

What will be the Size of the Electric Motors For IC Engine Vehicles Market during the forecast period?

Get Key Insights on Market Forecast (PDF) Request Free Sample

How is the Electric Motors For IC Engine Vehicles Market Segmented?

The electric motors for ic engine vehicles industry research report provides comprehensive data (region-wise segment analysis), with forecasts and estimates in "USD million" for the period 2026-2030, as well as historical data from 2020-2024 for the following segments.

  • Vehicle type
    • Passenger cars
    • Commercial vehicles
    • Two wheeler
  • Type
    • AC motor
    • DC motor
  • Distribution channel
    • OEM
    • Aftermarket
  • Geography
    • APAC
      • China
      • Japan
      • India
    • Europe
      • Germany
      • UK
      • France
    • North America
      • US
      • Canada
      • Mexico
    • South America
      • Brazil
      • Argentina
      • Colombia
    • Middle East and Africa
      • Saudi Arabia
      • UAE
      • South Africa
    • Rest of World (ROW)

By Vehicle Type Insights

The passenger cars segment is estimated to witness significant growth during the forecast period.

The passenger cars segment is driven by consumer demand for comfort, safety, and advanced driver-assistance systems.

Modern vehicles integrate dozens of electric motors beyond the primary starter motors and alternators, powering features like window regulators, seat adjustments, and electronic parking brakes.

A significant trend is the adoption of 48-volt mild hybrid systems, which utilize an advanced integrated starter-generator to enhance fuel economy.

This push for efficiency also drives demand for precision motion control motors in steering and braking systems, including electronic stability control. Thermal management is critical, with electric water pumps and cooling fan motors becoming standard to optimize engine temperature.

Suppliers are focusing on compact, lightweight brushless DC motors that offer higher power density and lower noise, meeting refined market expectations.

Request Free Sample

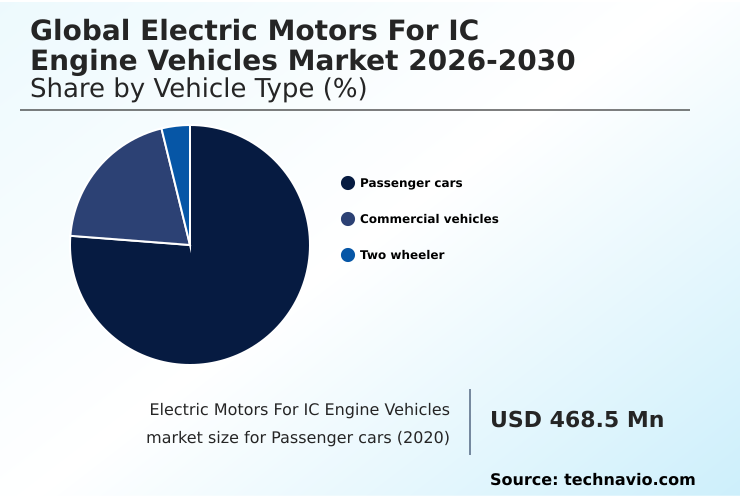
The Passenger cars segment was valued at USD 564.9 million in 2024 and showed a gradual increase during the forecast period.

Request Free Sample

Regional Analysis

APAC is estimated to contribute 60.5% to the growth of the global market during the forecast period.Technavio’s analysts have elaborately explained the regional trends and drivers that shape the market during the forecast period.

See How Electric Motors For IC Engine Vehicles Market Demand is Rising in APAC Request Free Sample

The geographic landscape is dominated by a massive manufacturing infrastructure and a substantial consumer base, particularly in the APAC region.

High vehicle production volumes ensure a constant demand for both standardized and cost-effective motor components, as well as high-performance hybrid architectures.

Regional export activity for automotive electrical parts, including starter motors and alternators, has surged by 8% as suppliers fill gaps in the global supply chain.

In contrast, other markets emphasize high-precision motors and the integration of advanced electronics for hybrid-capable engines.

This diversity requires manufacturers to offer a broad range of motor specifications, including AC induction motors and permanent magnet motors, to meet varied price points and performance needs.

The use of high-grade magnetic materials remains a key differentiator across all regions.

Market Dynamics

Our researchers analyzed the data with 2025 as the base year, along with the key drivers, trends, and challenges. A holistic analysis of drivers will help companies refine their marketing strategies to gain a competitive advantage.

  • Strategic decision-making in the global electric motors for ic engine vehicles market is increasingly focused on optimizing component-level performance to achieve system-wide efficiency gains. Improving fuel efficiency with electric ancillaries is a core objective, leading to intense evaluation of electric water pump vs mechanical pump efficiency.
  • For instance, the electric motor for ic engine cooling fans is now designed with variable speed controls, unlike older fixed-speed units. The 48v mild hybrid integrated starter generator has become a pivotal technology for reducing emissions, with starter motor requirements for stop-start systems becoming more stringent.
  • For powertrain applications, the brushless dc motor for power steering systems offers superior reliability, while the high-voltage motor for hybrid powertrain modules delivers necessary torque. This extends to precise components like the advanced actuator for electronic wastegate control and motor selection for active grille shutter systems.
  • Inside the cabin, a dc motor design for power window regulators and a compact motor design for automated seat adjustment enhance user experience.
  • Next-generation thermal management motor for turbocharged engines and electric supercharger motor power requirements are also key R&D areas, with some integrated designs showing a component count reduction of over 20% compared to legacy setups, simplifying assembly line operations and improving reliability for systems like regenerative braking motor for mild hybrids.

What are the key market drivers leading to the rise in the adoption of Electric Motors For IC Engine Vehicles Industry?

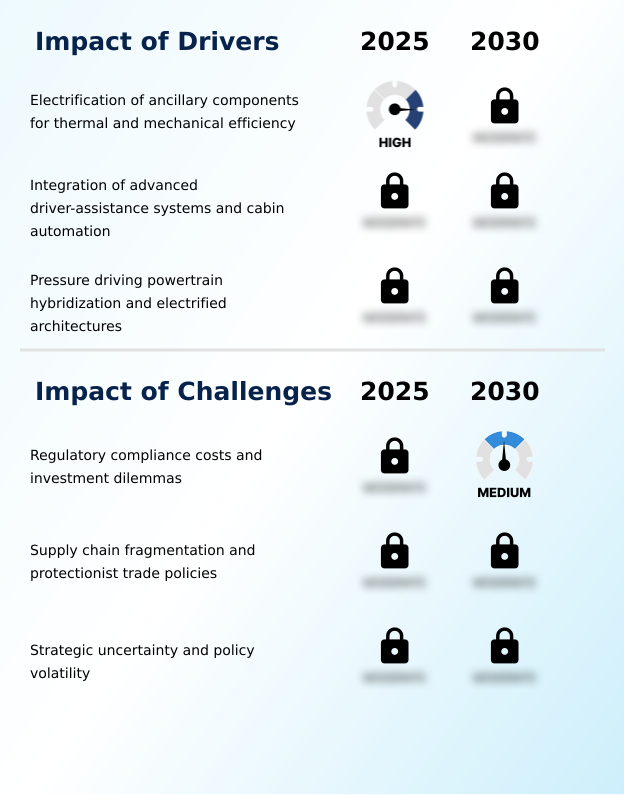
  • The primary market driver is the ongoing electrification of ancillary components, which enhances both thermal and mechanical efficiency in vehicles.

  • The comprehensive electrification of ancillary vehicle systems is a primary market driver, aimed at eliminating parasitic mechanical losses to improve fuel efficiency by up to 15%.
  • Traditional designs with belt-driven components continuously drained engine power, but engineers are systematically replacing them with electrically driven alternatives offering precise, on-demand control.
  • Electric water pumps, for example, can vary coolant flow independent of engine speed, ensuring optimal turbocharged engine cooling.
  • This granular level of electrification, supported by innovations in waste heat energy recovery and active suspension actuators, creates sustained demand for specialized transmission oil pumps and variable valve timing actuators.
  • The adoption of advanced electrical architectures provides the necessary power to support high-load consumers, enabling automakers to package engines more compactly and reduce emissions.

What are the market trends shaping the Electric Motors For IC Engine Vehicles Industry?

  • A significant market trend is the accelerated integration of high-voltage motors within hybrid powertrains. This shift is driven by the increasing need for enhanced vehicle performance and efficiency.

  • The market is undergoing a transformation driven by aggressive hybridization strategies, as manufacturers move beyond traditional architectures to deploy high-voltage systems. This trend is characterized by the proliferation of P2 hybrid architecture and P4 hybrid architecture modules, which integrate powerful high-voltage hairpin motors directly into the powertrain.
  • These systems enable efficient torque vectoring capabilities and regenerative braking systems, extending the life of the combustion engine while meeting carbon reduction targets. The shift requires a robust supply chain for motors that withstand high thermal stress.
  • The adoption of advanced round-wire windings contributes to a 10% increase in power density over previous designs, enabling performance enhancements in new energy vehicle platforms. The transition toward electrified ancillary components, including high-voltage efan solutions, is a critical enabler for next-generation vehicles.

What challenges does the Electric Motors For IC Engine Vehicles Industry face during its growth?

  • A key challenge impacting industry growth involves the financial strain of regulatory compliance costs and associated investment dilemmas.

  • The market is navigating a landscape of declining long-term volumes coupled with increasing short-term technical demands. As governments enforce stricter emission standards, manufacturers must install highly sophisticated electric actuators, pumps, and cooling fan motors. This forces suppliers to invest heavily in R&D for a technology stack with a finite commercial lifespan, leading to a diminishing return on investment.
  • The cost of compliance rises while the addressable market contracts, with re-engineering efforts to meet extended durability compliance requirements increasing validation expenses by over 20%. This financial strain is exemplified by the need to upgrade motors for exhaust gas recirculation systems and electronic wastegates to meet new lifecycle mandates, diverting capital from future-focused technologies.

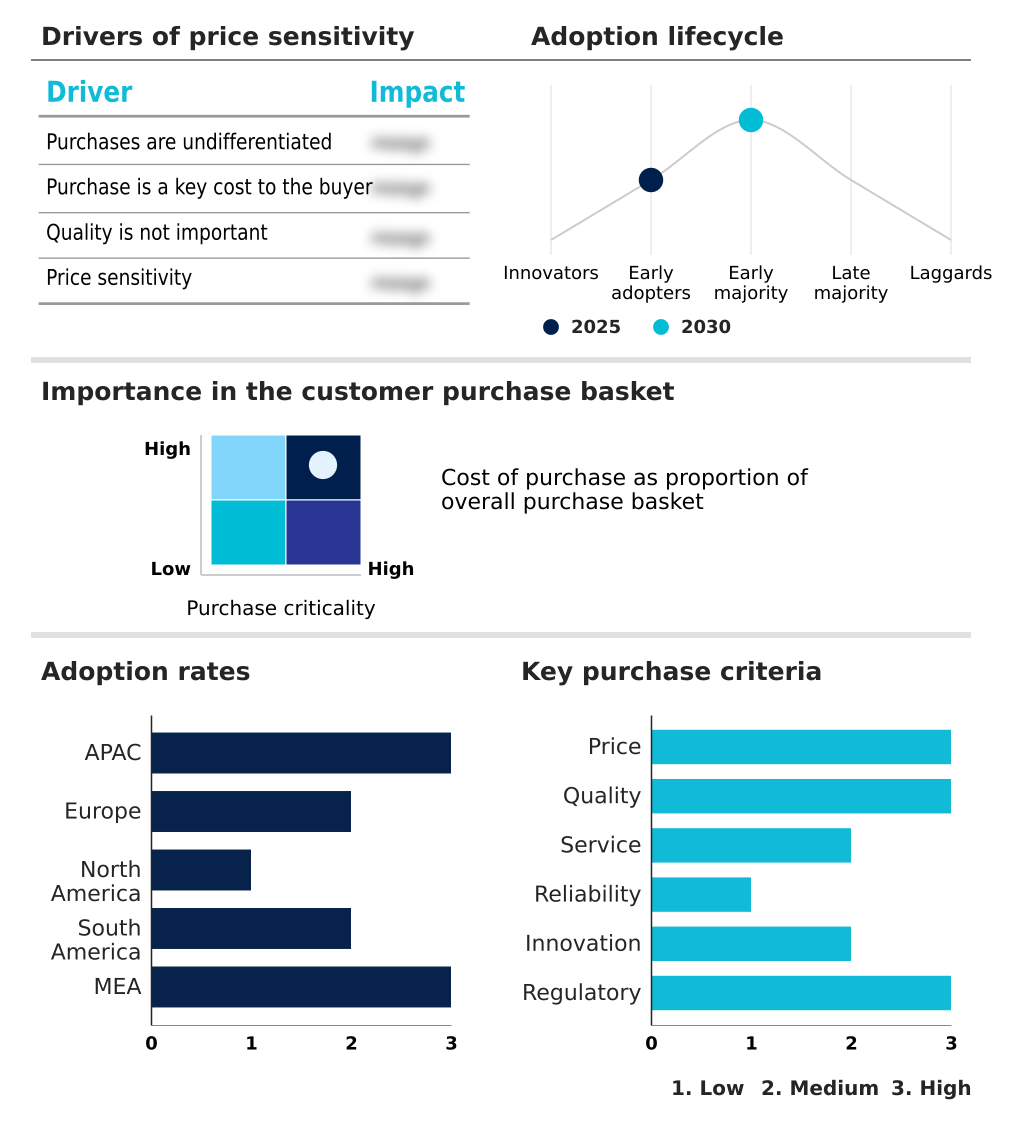
Exclusive Technavio Analysis on Customer Landscape

The electric motors for ic engine vehicles market forecasting report includes the adoption lifecycle of the market, covering from the innovator’s stage to the laggard’s stage. It focuses on adoption rates in different regions based on penetration. Furthermore, the electric motors for ic engine vehicles market report also includes key purchase criteria and drivers of price sensitivity to help companies evaluate and develop their market growth analysis strategies.

Customer Landscape of Electric Motors For IC Engine Vehicles Industry

Competitive Landscape

Companies are implementing various strategies, such as strategic alliances, electric motors for ic engine vehicles market forecast, partnerships, mergers and acquisitions, geographical expansion, and product/service launches, to enhance their presence in the industry.

AMETEK Inc. - Key offerings include specialized electric motors, starter-generators, and auxiliary drives, which are pivotal for enhancing the efficiency and functionality of internal combustion engine platforms.

The industry research and growth report includes detailed analyses of the competitive landscape of the market and information about key companies, including:

  • AMETEK Inc.
  • Arc Systems Inc.
  • BorgWarner Inc.
  • Brose SE and Co. KG
  • Continental AG
  • DENSO Corp.
  • Emerson Electric Co.
  • Hitachi Ltd.
  • Johnson Electric Holdings Ltd.
  • Marelli Holdings Co. Ltd.
  • Mazda Motor Corp.
  • Mitsuba Corp.
  • Mitsubishi Electric Corp.
  • Nidec Corp.
  • Regal Rexnord Corp.
  • Robert Bosch GmbH
  • Valeo SA

Qualitative and quantitative analysis of companies has been conducted to help clients understand the wider business environment as well as the strengths and weaknesses of key industry players. Data is qualitatively analyzed to categorize companies as pure play, category-focused, industry-focused, and diversified; it is quantitatively analyzed to categorize companies as dominant, leading, strong, tentative, and weak.

Recent Development and News in Electric motors for ic engine vehicles market

  • In August 2025, BorgWarner Inc. commenced production of its 400V High-Voltage Hairpin (HVH) motors for a major Chinese New Energy Vehicle supplier, targeting high-performance hybrid platforms.
  • In September 2025, the European Commission published implementing regulations for Euro 7 emission standards, mandating advanced on-board emissions monitoring and extending durability requirements for vehicle components.
  • In October 2025, Nidec Corp. executed a strategic reorganization of its Automotive Motor and Electronic Control unit, establishing a new Business Strategy and Sales Division to accelerate motor solution development.
  • In May 2025, Robert Bosch GmbH introduced an enhanced line of AC induction motors designed for the thermal management systems of large-scale commercial diesel vehicles, improving operational reliability.

Dive into Technavio’s robust research methodology, blending expert interviews, extensive data synthesis, and validated models for unparalleled Electric Motors For IC Engine Vehicles Market insights. See full methodology.

Market Scope
Page number 285
Base year 2025
Historic period 2020-2024
Forecast period 2026-2030
Growth momentum & CAGR Accelerate at a CAGR of 6%
Market growth 2026-2030 USD 266.5 million
Market structure Fragmented
YoY growth 2025-2026(%) 5.5%
Key countries China, Japan, India, South Korea, Australia, Indonesia, Germany, UK, France, Italy, Spain, The Netherlands, US, Canada, Mexico, Brazil, Argentina, Colombia, Saudi Arabia, UAE, South Africa, Israel and Turkey
Competitive landscape Leading Companies, Market Positioning of Companies, Competitive Strategies, and Industry Risks

Request Free Sample

Research Analyst Overview

  • The market is navigating a complex trajectory defined by sustained demand for auxiliary electrification and increasingly sophisticated automotive systems. Despite the industry's shift toward full electrification, the internal combustion engine sector continues to drive substantial volume for specialized electric motors.
  • Growth is primarily fueled by the replacement of traditional mechanical components like power steering pumps with electrically driven alternatives, such as brushless DC motors, which reduce parasitic engine load and improve fuel efficiency. In some applications, this transition has reduced system energy consumption by over 15%.
  • A key boardroom-level decision revolves around R&D investment, balancing the need to support legacy ICE architectures with the pivot to hybrid and EV platforms. Technologically, the market is witnessing a transition to advanced solutions like the integrated starter-generator and thermal management systems that use electric coolant pumps.
  • This evolution requires suppliers to innovate in areas such as high-torque micro-motors and mechatronic components to maintain a competitive edge, ensuring that both powertrain hybridization and comfort-related functions are supported with reliable, high-performance units.

What are the Key Data Covered in this Electric Motors For IC Engine Vehicles Market Research and Growth Report?

  • What is the expected growth of the Electric Motors For IC Engine Vehicles Market between 2026 and 2030?

    • USD 266.5 million, at a CAGR of 6%

  • What segmentation does the market report cover?

    • The report is segmented by Vehicle Type (Passenger cars, Commercial vehicles, and Two wheeler), Type (AC motor, and DC motor), Distribution Channel (OEM, and Aftermarket) and Geography (APAC, Europe, North America, South America, Middle East and Africa)

  • Which regions are analyzed in the report?

    • APAC, Europe, North America, South America and Middle East and Africa

  • What are the key growth drivers and market challenges?

    • Electrification of ancillary components for thermal and mechanical efficiency, Regulatory compliance costs and investment dilemmas

  • Who are the major players in the Electric Motors For IC Engine Vehicles Market?

    • AMETEK Inc., Arc Systems Inc., BorgWarner Inc., Brose SE and Co. KG, Continental AG, DENSO Corp., Emerson Electric Co., Hitachi Ltd., Johnson Electric Holdings Ltd., Marelli Holdings Co. Ltd., Mazda Motor Corp., Mitsuba Corp., Mitsubishi Electric Corp., Nidec Corp., Regal Rexnord Corp., Robert Bosch GmbH and Valeo SA

Market Research Insights

  • The market for electric motors in internal combustion engine vehicles is defined by a push for greater efficiency and system integration. The electrification of ancillary vehicle systems is a primary driver, with advanced electric water pumps demonstrating a 10% improvement in thermal management over traditional belt-driven components.
  • This shift away from reliance on the engine crankshaft load reduces parasitic mechanical losses and supports powertrain hybridization. The adoption of 48-volt mild hybrid systems further propels demand for high-performance motors capable of supporting stop-start events and regenerative braking.
  • This evolution creates a complex environment where vehicle platform integration is critical, as automakers require motors that are both compact and powerful. Consequently, suppliers are innovating to provide solutions that enhance engine performance, with some integrated starter-generator units improving fuel efficiency by up to 15%.

We can help! Our analysts can customize this electric motors for ic engine vehicles market research report to meet your requirements.

Get in touch

1. Executive Summary

1.1 Market overview

Executive Summary - Chart on Market Overview
Executive Summary - Data Table on Market Overview
Executive Summary - Chart on Global Market Characteristics
Executive Summary - Chart on Market by Geography
Executive Summary - Chart on Market Segmentation by Vehicle Type
Executive Summary - Chart on Market Segmentation by Type
Executive Summary - Chart on Market Segmentation by Distribution Channel
Executive Summary - Chart on Incremental Growth
Executive Summary - Data Table on Incremental Growth
Executive Summary - Chart on Company Market Positioning

2. Technavio Analysis

2.1 Analysis of price sensitivity, lifecycle, customer purchase basket, adoption rates, and purchase criteria

2.2 Criticality of inputs and Factors of differentiation

Chart on Overview on criticality of inputs and factors of differentiation

2.3 Factors of disruption

Chart on Overview on factors of disruption

2.4 Impact of drivers and challenges

Chart on Impact of drivers and challenges in 2025 and 2030

3. Market Landscape

3.1 Market ecosystem

Chart on Parent Market
Data Table on - Parent Market

3.2 Market characteristics

Chart on Market characteristics analysis

3.3 Value chain analysis

Chart on Value chain analysis

4. Market Sizing

4.1 Market definition

Data Table on Offerings of companies included in the market definition

4.2 Market segment analysis

Market segments

4.3 Market size 2025

4.4 Market outlook: Forecast for 2025-2030

Chart on Global - Market size and forecast 2025-2030 ($ million)
Data Table on Global - Market size and forecast 2025-2030 ($ million)
Chart on Global Market: Year-over-year growth 2025-2030 (%)
Data Table on Global Market: Year-over-year growth 2025-2030 (%)

5. Historic Market Size

5.1 Global Electric Motors For IC Engine Vehicles Market 2020 - 2024

Historic Market Size - Data Table on Global Electric Motors For IC Engine Vehicles Market 2020 - 2024 ($ million)

5.2 Vehicle Type segment analysis 2020 - 2024

Historic Market Size - Vehicle Type Segment 2020 - 2024 ($ million)

5.3 Type segment analysis 2020 - 2024

Historic Market Size - Type Segment 2020 - 2024 ($ million)

5.4 Distribution Channel segment analysis 2020 - 2024

Historic Market Size - Distribution Channel Segment 2020 - 2024 ($ million)

5.5 Geography segment analysis 2020 - 2024

Historic Market Size - Geography Segment 2020 - 2024 ($ million)

5.6 Country segment analysis 2020 - 2024

Historic Market Size - Country Segment 2020 - 2024 ($ million)

6. Qualitative Analysis

6.1 Impact of AI in global electric motors for IC engine vehicles market

7. Five Forces Analysis

7.1 Five forces summary

Five forces analysis - Comparison between 2025 and 2030

7.2 Bargaining power of buyers

Bargaining power of buyers - Impact of key factors 2025 and 2030

7.3 Bargaining power of suppliers

Bargaining power of suppliers - Impact of key factors in 2025 and 2030

7.4 Threat of new entrants

Threat of new entrants - Impact of key factors in 2025 and 2030

7.5 Threat of substitutes

Threat of substitutes - Impact of key factors in 2025 and 2030

7.6 Threat of rivalry

Threat of rivalry - Impact of key factors in 2025 and 2030

7.7 Market condition

Chart on Market condition - Five forces 2025 and 2030

8. Market Segmentation by Vehicle Type

8.1 Market segments

Chart on Vehicle Type - Market share 2025-2030 (%)
Data Table on Vehicle Type - Market share 2025-2030 (%)

8.2 Comparison by Vehicle Type

Chart on Comparison by Vehicle Type
Data Table on Comparison by Vehicle Type

8.3 Passenger cars - Market size and forecast 2025-2030

Chart on Passenger cars - Market size and forecast 2025-2030 ($ million)
Data Table on Passenger cars - Market size and forecast 2025-2030 ($ million)
Chart on Passenger cars - Year-over-year growth 2025-2030 (%)
Data Table on Passenger cars - Year-over-year growth 2025-2030 (%)

8.4 Commercial vehicles - Market size and forecast 2025-2030

Chart on Commercial vehicles - Market size and forecast 2025-2030 ($ million)
Data Table on Commercial vehicles - Market size and forecast 2025-2030 ($ million)
Chart on Commercial vehicles - Year-over-year growth 2025-2030 (%)
Data Table on Commercial vehicles - Year-over-year growth 2025-2030 (%)

8.5 Two wheeler - Market size and forecast 2025-2030

Chart on Two wheeler - Market size and forecast 2025-2030 ($ million)
Data Table on Two wheeler - Market size and forecast 2025-2030 ($ million)
Chart on Two wheeler - Year-over-year growth 2025-2030 (%)
Data Table on Two wheeler - Year-over-year growth 2025-2030 (%)

8.6 Market opportunity by Vehicle Type

Market opportunity by Vehicle Type ($ million)
Data Table on Market opportunity by Vehicle Type ($ million)

9. Market Segmentation by Type

9.1 Market segments

Chart on Type - Market share 2025-2030 (%)
Data Table on Type - Market share 2025-2030 (%)

9.2 Comparison by Type

Chart on Comparison by Type
Data Table on Comparison by Type

9.3 AC motor - Market size and forecast 2025-2030

Chart on AC motor - Market size and forecast 2025-2030 ($ million)
Data Table on AC motor - Market size and forecast 2025-2030 ($ million)
Chart on AC motor - Year-over-year growth 2025-2030 (%)
Data Table on AC motor - Year-over-year growth 2025-2030 (%)

9.4 DC motor - Market size and forecast 2025-2030

Chart on DC motor - Market size and forecast 2025-2030 ($ million)
Data Table on DC motor - Market size and forecast 2025-2030 ($ million)
Chart on DC motor - Year-over-year growth 2025-2030 (%)
Data Table on DC motor - Year-over-year growth 2025-2030 (%)

9.5 Market opportunity by Type

Market opportunity by Type ($ million)
Data Table on Market opportunity by Type ($ million)

10. Market Segmentation by Distribution Channel

10.1 Market segments

Chart on Distribution Channel - Market share 2025-2030 (%)
Data Table on Distribution Channel - Market share 2025-2030 (%)

10.2 Comparison by Distribution Channel

Chart on Comparison by Distribution Channel
Data Table on Comparison by Distribution Channel

10.3 OEM - Market size and forecast 2025-2030

Chart on OEM - Market size and forecast 2025-2030 ($ million)
Data Table on OEM - Market size and forecast 2025-2030 ($ million)
Chart on OEM - Year-over-year growth 2025-2030 (%)
Data Table on OEM - Year-over-year growth 2025-2030 (%)

10.4 Aftermarket - Market size and forecast 2025-2030

Chart on Aftermarket - Market size and forecast 2025-2030 ($ million)
Data Table on Aftermarket - Market size and forecast 2025-2030 ($ million)
Chart on Aftermarket - Year-over-year growth 2025-2030 (%)
Data Table on Aftermarket - Year-over-year growth 2025-2030 (%)

10.5 Market opportunity by Distribution Channel

Market opportunity by Distribution Channel ($ million)
Data Table on Market opportunity by Distribution Channel ($ million)

11. Customer Landscape

11.1 Customer landscape overview

Analysis of price sensitivity, lifecycle, customer purchase basket, adoption rates, and purchase criteria

12. Geographic Landscape

12.1 Geographic segmentation

Chart on Market share by geography 2025-2030 (%)
Data Table on Market share by geography 2025-2030 (%)

12.2 Geographic comparison

Chart on Geographic comparison
Data Table on Geographic comparison

12.3 APAC - Market size and forecast 2025-2030

Chart on APAC - Market size and forecast 2025-2030 ($ million)
Data Table on APAC - Market size and forecast 2025-2030 ($ million)
Chart on APAC - Year-over-year growth 2025-2030 (%)
Data Table on APAC - Year-over-year growth 2025-2030 (%)
Chart on Regional Comparison - APAC
Data Table on Regional Comparison - APAC

12.3.1 China - Market size and forecast 2025-2030

Chart on China - Market size and forecast 2025-2030 ($ million)
Data Table on China - Market size and forecast 2025-2030 ($ million)
Chart on China - Year-over-year growth 2025-2030 (%)
Data Table on China - Year-over-year growth 2025-2030 (%)

12.3.2 Japan - Market size and forecast 2025-2030

Chart on Japan - Market size and forecast 2025-2030 ($ million)
Data Table on Japan - Market size and forecast 2025-2030 ($ million)
Chart on Japan - Year-over-year growth 2025-2030 (%)
Data Table on Japan - Year-over-year growth 2025-2030 (%)

12.3.3 India - Market size and forecast 2025-2030

Chart on India - Market size and forecast 2025-2030 ($ million)
Data Table on India - Market size and forecast 2025-2030 ($ million)
Chart on India - Year-over-year growth 2025-2030 (%)
Data Table on India - Year-over-year growth 2025-2030 (%)

12.3.4 South Korea - Market size and forecast 2025-2030

Chart on South Korea - Market size and forecast 2025-2030 ($ million)
Data Table on South Korea - Market size and forecast 2025-2030 ($ million)
Chart on South Korea - Year-over-year growth 2025-2030 (%)
Data Table on South Korea - Year-over-year growth 2025-2030 (%)

12.3.5 Australia - Market size and forecast 2025-2030

Chart on Australia - Market size and forecast 2025-2030 ($ million)
Data Table on Australia - Market size and forecast 2025-2030 ($ million)
Chart on Australia - Year-over-year growth 2025-2030 (%)
Data Table on Australia - Year-over-year growth 2025-2030 (%)

12.3.6 Indonesia - Market size and forecast 2025-2030

Chart on Indonesia - Market size and forecast 2025-2030 ($ million)
Data Table on Indonesia - Market size and forecast 2025-2030 ($ million)
Chart on Indonesia - Year-over-year growth 2025-2030 (%)
Data Table on Indonesia - Year-over-year growth 2025-2030 (%)

12.4 Europe - Market size and forecast 2025-2030

Chart on Europe - Market size and forecast 2025-2030 ($ million)
Data Table on Europe - Market size and forecast 2025-2030 ($ million)
Chart on Europe - Year-over-year growth 2025-2030 (%)
Data Table on Europe - Year-over-year growth 2025-2030 (%)
Chart on Regional Comparison - Europe
Data Table on Regional Comparison - Europe

12.4.1 Germany - Market size and forecast 2025-2030

Chart on Germany - Market size and forecast 2025-2030 ($ million)
Data Table on Germany - Market size and forecast 2025-2030 ($ million)
Chart on Germany - Year-over-year growth 2025-2030 (%)
Data Table on Germany - Year-over-year growth 2025-2030 (%)

12.4.2 UK - Market size and forecast 2025-2030

Chart on UK - Market size and forecast 2025-2030 ($ million)
Data Table on UK - Market size and forecast 2025-2030 ($ million)
Chart on UK - Year-over-year growth 2025-2030 (%)
Data Table on UK - Year-over-year growth 2025-2030 (%)

12.4.3 France - Market size and forecast 2025-2030

Chart on France - Market size and forecast 2025-2030 ($ million)
Data Table on France - Market size and forecast 2025-2030 ($ million)
Chart on France - Year-over-year growth 2025-2030 (%)
Data Table on France - Year-over-year growth 2025-2030 (%)

12.4.4 Italy - Market size and forecast 2025-2030

Chart on Italy - Market size and forecast 2025-2030 ($ million)
Data Table on Italy - Market size and forecast 2025-2030 ($ million)
Chart on Italy - Year-over-year growth 2025-2030 (%)
Data Table on Italy - Year-over-year growth 2025-2030 (%)

12.4.5 Spain - Market size and forecast 2025-2030

Chart on Spain - Market size and forecast 2025-2030 ($ million)
Data Table on Spain - Market size and forecast 2025-2030 ($ million)
Chart on Spain - Year-over-year growth 2025-2030 (%)
Data Table on Spain - Year-over-year growth 2025-2030 (%)

12.4.6 The Netherlands - Market size and forecast 2025-2030

Chart on The Netherlands - Market size and forecast 2025-2030 ($ million)
Data Table on The Netherlands - Market size and forecast 2025-2030 ($ million)
Chart on The Netherlands - Year-over-year growth 2025-2030 (%)
Data Table on The Netherlands - Year-over-year growth 2025-2030 (%)

12.5 North America - Market size and forecast 2025-2030

Chart on North America - Market size and forecast 2025-2030 ($ million)
Data Table on North America - Market size and forecast 2025-2030 ($ million)
Chart on North America - Year-over-year growth 2025-2030 (%)
Data Table on North America - Year-over-year growth 2025-2030 (%)
Chart on Regional Comparison - North America
Data Table on Regional Comparison - North America

12.5.1 US - Market size and forecast 2025-2030

Chart on US - Market size and forecast 2025-2030 ($ million)
Data Table on US - Market size and forecast 2025-2030 ($ million)
Chart on US - Year-over-year growth 2025-2030 (%)
Data Table on US - Year-over-year growth 2025-2030 (%)

12.5.2 Canada - Market size and forecast 2025-2030

Chart on Canada - Market size and forecast 2025-2030 ($ million)
Data Table on Canada - Market size and forecast 2025-2030 ($ million)
Chart on Canada - Year-over-year growth 2025-2030 (%)
Data Table on Canada - Year-over-year growth 2025-2030 (%)

12.5.3 Mexico - Market size and forecast 2025-2030

Chart on Mexico - Market size and forecast 2025-2030 ($ million)
Data Table on Mexico - Market size and forecast 2025-2030 ($ million)
Chart on Mexico - Year-over-year growth 2025-2030 (%)
Data Table on Mexico - Year-over-year growth 2025-2030 (%)

12.6 South America - Market size and forecast 2025-2030

Chart on South America - Market size and forecast 2025-2030 ($ million)
Data Table on South America - Market size and forecast 2025-2030 ($ million)
Chart on South America - Year-over-year growth 2025-2030 (%)
Data Table on South America - Year-over-year growth 2025-2030 (%)
Chart on Regional Comparison - South America
Data Table on Regional Comparison - South America

12.6.1 Brazil - Market size and forecast 2025-2030

Chart on Brazil - Market size and forecast 2025-2030 ($ million)
Data Table on Brazil - Market size and forecast 2025-2030 ($ million)
Chart on Brazil - Year-over-year growth 2025-2030 (%)
Data Table on Brazil - Year-over-year growth 2025-2030 (%)

12.6.2 Argentina - Market size and forecast 2025-2030

Chart on Argentina - Market size and forecast 2025-2030 ($ million)
Data Table on Argentina - Market size and forecast 2025-2030 ($ million)
Chart on Argentina - Year-over-year growth 2025-2030 (%)
Data Table on Argentina - Year-over-year growth 2025-2030 (%)

12.6.3 Colombia - Market size and forecast 2025-2030

Chart on Colombia - Market size and forecast 2025-2030 ($ million)
Data Table on Colombia - Market size and forecast 2025-2030 ($ million)
Chart on Colombia - Year-over-year growth 2025-2030 (%)
Data Table on Colombia - Year-over-year growth 2025-2030 (%)

12.7 Middle East and Africa - Market size and forecast 2025-2030

Chart on Middle East and Africa - Market size and forecast 2025-2030 ($ million)
Data Table on Middle East and Africa - Market size and forecast 2025-2030 ($ million)
Chart on Middle East and Africa - Year-over-year growth 2025-2030 (%)
Data Table on Middle East and Africa - Year-over-year growth 2025-2030 (%)
Chart on Regional Comparison - Middle East and Africa
Data Table on Regional Comparison - Middle East and Africa

12.7.1 Saudi Arabia - Market size and forecast 2025-2030

Chart on Saudi Arabia - Market size and forecast 2025-2030 ($ million)
Data Table on Saudi Arabia - Market size and forecast 2025-2030 ($ million)
Chart on Saudi Arabia - Year-over-year growth 2025-2030 (%)
Data Table on Saudi Arabia - Year-over-year growth 2025-2030 (%)

12.7.2 UAE - Market size and forecast 2025-2030

Chart on UAE - Market size and forecast 2025-2030 ($ million)
Data Table on UAE - Market size and forecast 2025-2030 ($ million)
Chart on UAE - Year-over-year growth 2025-2030 (%)
Data Table on UAE - Year-over-year growth 2025-2030 (%)

12.7.3 South Africa - Market size and forecast 2025-2030

Chart on South Africa - Market size and forecast 2025-2030 ($ million)
Data Table on South Africa - Market size and forecast 2025-2030 ($ million)
Chart on South Africa - Year-over-year growth 2025-2030 (%)
Data Table on South Africa - Year-over-year growth 2025-2030 (%)

12.7.4 Israel - Market size and forecast 2025-2030

Chart on Israel - Market size and forecast 2025-2030 ($ million)
Data Table on Israel - Market size and forecast 2025-2030 ($ million)
Chart on Israel - Year-over-year growth 2025-2030 (%)
Data Table on Israel - Year-over-year growth 2025-2030 (%)

12.7.5 Turkey - Market size and forecast 2025-2030

Chart on Turkey - Market size and forecast 2025-2030 ($ million)
Data Table on Turkey - Market size and forecast 2025-2030 ($ million)
Chart on Turkey - Year-over-year growth 2025-2030 (%)
Data Table on Turkey - Year-over-year growth 2025-2030 (%)

12.8 Market opportunity by geography

Market opportunity by geography ($ million)
Data Tables on Market opportunity by geography ($ million)

13. Drivers, Challenges, and Opportunity

13.1 Market drivers

Electrification of ancillary components for thermal and mechanical efficiency
Integration of advanced driver-assistance systems and cabin automation
Pressure driving powertrain hybridization and electrified architectures

13.2 Market challenges

Regulatory compliance costs and investment dilemmas
Supply chain fragmentation and protectionist trade policies
Strategic uncertainty and policy volatility

13.3 Impact of drivers and challenges

Impact of drivers and challenges in 2025 and 2030

13.4 Market opportunities

Accelerated integration of high-voltage motors in hybrid powertrains
Strategic localization of manufacturing in APAC
Adoption of software-defined 48-volt mild hybrid systems

14. Competitive Landscape

14.1 Overview

14.2

Overview on criticality of inputs and factors of differentiation

14.3 Landscape disruption

Overview on factors of disruption

14.4 Industry risks

Impact of key risks on business

15. Competitive Analysis

15.1 Companies profiled

Companies covered

15.2 Company ranking index

15.3 Market positioning of companies

Matrix on companies position and classification

15.4 AMETEK Inc.

AMETEK Inc. - Overview
AMETEK Inc. - Business segments
AMETEK Inc. - Key news
AMETEK Inc. - Key offerings
AMETEK Inc. - Segment focus
SWOT

15.5 Arc Systems Inc.

Arc Systems Inc. - Overview
Arc Systems Inc. - Product / Service
Arc Systems Inc. - Key offerings
SWOT

15.6 BorgWarner Inc.

BorgWarner Inc. - Overview
BorgWarner Inc. - Business segments
BorgWarner Inc. - Key news
BorgWarner Inc. - Key offerings
BorgWarner Inc. - Segment focus
SWOT

15.7 Brose SE and Co. KG

Brose SE and Co. KG - Overview
Brose SE and Co. KG - Product / Service
Brose SE and Co. KG - Key offerings
SWOT

15.8 Continental AG

Continental AG - Overview
Continental AG - Business segments
Continental AG - Key news
Continental AG - Key offerings
Continental AG - Segment focus
SWOT

15.9 DENSO Corp.

DENSO Corp. - Overview
DENSO Corp. - Business segments
DENSO Corp. - Key news
DENSO Corp. - Key offerings
DENSO Corp. - Segment focus
SWOT

15.10 Emerson Electric Co.

Emerson Electric Co. - Overview
Emerson Electric Co. - Business segments
Emerson Electric Co. - Key news
Emerson Electric Co. - Key offerings
Emerson Electric Co. - Segment focus
SWOT

15.11 Hitachi Ltd.

Hitachi Ltd. - Overview
Hitachi Ltd. - Business segments
Hitachi Ltd. - Key news
Hitachi Ltd. - Key offerings
Hitachi Ltd. - Segment focus
SWOT

15.12 Johnson Electric Holdings Ltd.

Johnson Electric Holdings Ltd. - Overview
Johnson Electric Holdings Ltd. - Business segments
Johnson Electric Holdings Ltd. - Key news
Johnson Electric Holdings Ltd. - Key offerings
Johnson Electric Holdings Ltd. - Segment focus
SWOT

15.13 Marelli Holdings Co. Ltd.

Marelli Holdings Co. Ltd. - Overview
Marelli Holdings Co. Ltd. - Product / Service
Marelli Holdings Co. Ltd. - Key news
Marelli Holdings Co. Ltd. - Key offerings
SWOT

15.14 Mazda Motor Corp.

Mazda Motor Corp. - Overview
Mazda Motor Corp. - Business segments
Mazda Motor Corp. - Key offerings
Mazda Motor Corp. - Segment focus
SWOT

15.15 Mitsuba Corp.

Mitsuba Corp. - Overview
Mitsuba Corp. - Business segments
Mitsuba Corp. - Key offerings
Mitsuba Corp. - Segment focus
SWOT

15.16 Mitsubishi Electric Corp.

Mitsubishi Electric Corp. - Overview
Mitsubishi Electric Corp. - Business segments
Mitsubishi Electric Corp. - Key offerings
Mitsubishi Electric Corp. - Segment focus
SWOT

15.17 Robert Bosch GmbH

Robert Bosch GmbH - Overview
Robert Bosch GmbH - Product / Service
Robert Bosch GmbH - Key news
Robert Bosch GmbH - Key offerings
SWOT

15.18 Valeo SA

Valeo SA - Overview
Valeo SA - Business segments
Valeo SA - Key news
Valeo SA - Key offerings
Valeo SA - Segment focus
SWOT

16. Appendix

16.1 Scope of the report

Market definition
Objectives
Notes and caveats

16.2 Inclusions and exclusions checklist

Inclusions checklist
Exclusions checklist

16.3 Currency conversion rates for US$

16.4 Research methodology

16.5 Data procurement

Information sources

16.6 Data validation

16.7 Validation techniques employed for market sizing

16.8 Data synthesis

16.9 360 degree market analysis

16.10 List of abbreviations

Research Methodology

Technavio presents a detailed picture of the market by way of study, synthesis, and summation of data from multiple sources. The analysts have presented the various facets of the market with a particular focus on identifying the key industry influencers. The data thus presented is comprehensive, reliable, and the result of extensive research, both primary and secondary.

INFORMATION SOURCES

Primary sources

  • Manufacturers and suppliers
  • Channel partners
  • Industry experts
  • Strategic decision makers

Secondary sources

  • Industry journals and periodicals
  • Government data
  • Financial reports of key industry players
  • Historical data
  • Press releases

DATA ANALYSIS

Data Synthesis

  • Collation of data
  • Estimation of key figures
  • Analysis of derived insights

Data Validation

  • Triangulation with data models
  • Reference against proprietary databases
  • Corroboration with industry experts

REPORT WRITING

Qualitative

  • Market drivers
  • Market challenges
  • Market trends
  • Five forces analysis

Quantitative

  • Market size and forecast
  • Market segmentation
  • Geographical insights
  • Competitive landscape

Interested in this report?

Get your sample now to see our research methodology and insights!

Download Now

Frequently Asked Questions

Electric Motors For IC Engine Vehicles market growth will increase by USD 266.5 million during 2026-2030.

The Electric Motors For IC Engine Vehicles market is expected to grow at a CAGR of 6% during 2026-2030.

Electric Motors For IC Engine Vehicles market is segmented by Vehicle type (Passenger cars, Commercial vehicles, Two wheeler) Type (AC motor, DC motor) Distribution channel (OEM, Aftermarket)

AMETEK Inc., Arc Systems Inc., BorgWarner Inc., Brose SE and Co. KG, Continental AG, DENSO Corp., Emerson Electric Co., Hitachi Ltd., Johnson Electric Holdings Ltd., Marelli Holdings Co. Ltd., Mazda Motor Corp., Mitsuba Corp., Mitsubishi Electric Corp., Nidec Corp., Regal Rexnord Corp., Robert Bosch GmbH, Valeo SA are a few of the key vendors in the Electric Motors For IC Engine Vehicles market.

APAC will register the highest growth rate of 60.5% among the other regions. Therefore, the Electric Motors For IC Engine Vehicles market in APAC is expected to garner significant business opportunities for the vendors during the forecast period.

China, Japan, India, South Korea, Australia, Indonesia, Germany, UK, France, Italy, Spain, The Netherlands, US, Canada, Mexico, Brazil, Argentina, Colombia, Saudi Arabia, UAE, South Africa, Israel, Turkey

  • Electrification of ancillary components for thermal and mechanical efficiency is the driving factor this market.

The Electric Motors For IC Engine Vehicles market vendors should focus on grabbing business opportunities from the Vehicle type segment as it accounted for the largest market share in the base year.