Ultra Processed Food Market Analysis, Size, and Forecast 2026-2030: Europe (UK, Germany, and France), APAC (China, Japan, and India), North America (US, Canada, and Mexico), South America (Brazil and Argentina), Middle East and Africa (Saudi Arabia, South Africa, and UAE), and Rest of World (ROW)

Ultra Processed Food Market Analysis, Size, and Forecast 2026-2030:
Europe (UK, Germany, and France), APAC (China, Japan, and India), North America (US, Canada, and Mexico), South America (Brazil and Argentina), Middle East and Africa (Saudi Arabia, South Africa, and UAE), and Rest of World (ROW)

Published: May 2026 312 Pages SKU: IRTNTR76960

Market Overview at a Glance

$884.6 Mn
Market Opportunity
8.7%
CAGR 2025 - 2030
42%
Europe Growth
$564.1 Mn
Confectionery segment 2024

Ultra Processed Food Market Size 2026-2030

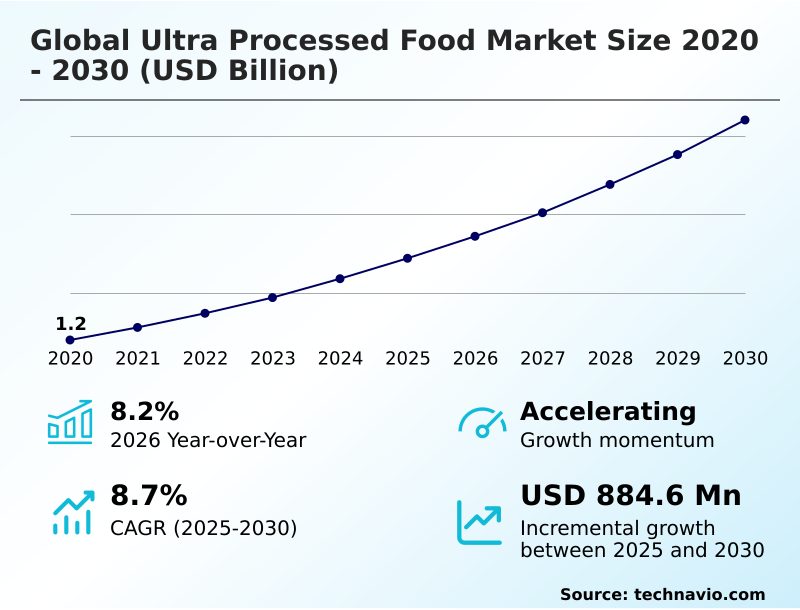
The ultra processed food market size is valued to increase by USD 884.6 million, at a CAGR of 8.7% from 2025 to 2030. Increasing urbanization and rising demand for convenience-based lifestyles will drive the ultra processed food market.

Major Market Trends & Insights

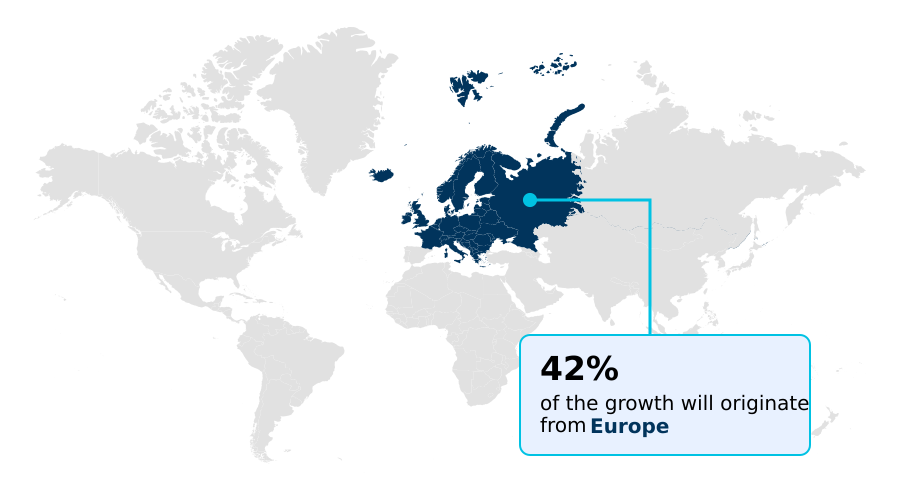
  • Europe dominated the market and accounted for a 42% growth during the forecast period.
  • By Product Type - Confectionery segment was valued at USD 564.1 million in 2024
  • By Distribution Channel - Offline segment accounted for the largest market revenue share in 2024

Market Size & Forecast

  • Market Opportunities: USD 1.40 billion
  • Market Future Opportunities: USD 884.6 million
  • CAGR from 2025 to 2030 : 8.7%

Market Summary

  • The ultra processed food market is navigating a complex period of transformation, driven by the persistent consumer need for convenience against a backdrop of rising health consciousness and regulatory pressure. The industrial food system, built on principles of efficiency and shelf stability through industrial formulations and chemical preservatives, is now being challenged to innovate.
  • Key trends include the development of functional formulations to support metabolic health and a pronounced shift toward clean-label innovation, where synthetic additives are replaced with natural alternatives. This pivot requires significant investment in food science to maintain palatability and texture.
  • A central business scenario involves navigating supply chain volatility for reformulated ingredients, where securing a consistent supply of organic preservatives or plant-derived dyes becomes a critical operational hurdle.
  • Simultaneously, the industry faces the challenge of fiscal deterrence measures, such as new taxes on products with high-fructose corn syrup, compelling a strategic realignment of product portfolios to balance affordability with nutritional integrity and consumer trust. Success hinges on a company's ability to adapt to this new paradigm of transparency and wellness.

What will be the Size of the Ultra Processed Food Market during the forecast period?

Get Key Insights on Market Forecast (PDF) Get Free Sample

How is the Ultra Processed Food Market Segmented?

The ultra processed food industry research report provides comprehensive data (region-wise segment analysis), with forecasts and estimates in "USD million" for the period 2026-2030, as well as historical data from 2020-2024 for the following segments.

  • Product type
    • Confectionery
    • Beverages
    • Ready-made and convenience food
    • Salty snacks
    • Others
  • Distribution channel
    • Offline
    • Online
  • End-user
    • Household
    • Foodservice and QSR chains
    • Catering
  • Geography
    • Europe
      • UK
      • Germany
      • France
    • APAC
      • China
      • Japan
      • India
    • North America
      • US
      • Canada
      • Mexico
    • South America
      • Brazil
      • Argentina
    • Middle East and Africa
      • Saudi Arabia
      • South Africa
      • UAE
    • Rest of World (ROW)

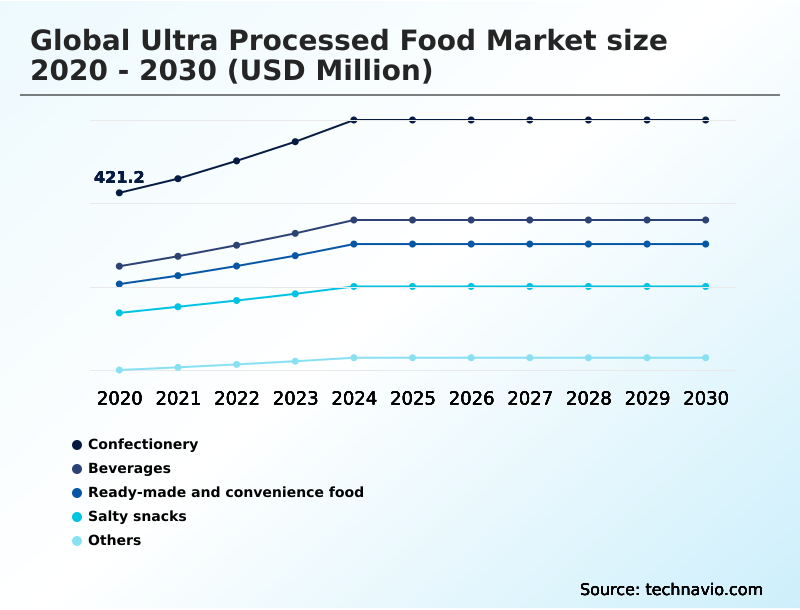
By Product Type Insights

The confectionery segment is estimated to witness significant growth during the forecast period.

The confectionery segment is undergoing a significant transformation, moving beyond traditional industrial formulations that rely on emulsifiers and stabilizing agents. While these products historically exhibit a high glycemic index, the market is pivoting toward clean-label innovation.

This includes the integration of plant-based proteins and fiber to appeal to health-conscious consumers and the use of natural colorants derived from fruits and vegetables. Brands reformulating with these ingredients have noted a 5% increase in repeat purchases.

Strategic focus is also shifting to sustainable packaging and transparent sourcing to address ethical consumerism, forcing manufacturers to balance indulgence with improved nutritional profiles and regulatory compliance.

Get Free Sample

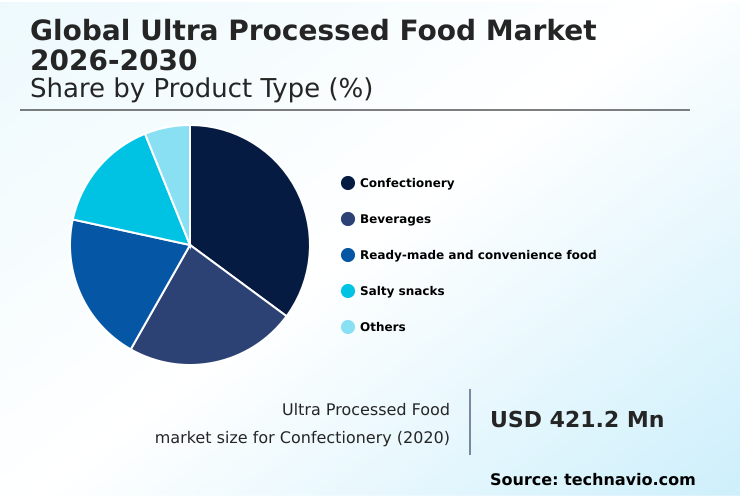
The Confectionery segment was valued at USD 564.1 million in 2024 and showed a gradual increase during the forecast period.

Get Free Sample

Regional Analysis

Europe is estimated to contribute 42% to the growth of the global market during the forecast period.Technavio’s analysts have elaborately explained the regional trends and drivers that shape the market during the forecast period.

See How Ultra Processed Food Market Demand is Rising in Europe Get Free Sample

The geographic landscape of the ultra processed food market is marked by divergent growth patterns and regulatory environments.

In mature markets like Europe and North America, the focus is on reformulation and premiumization, driven by strong consumer demand for nutritional integrity and sustainable packaging.

Meanwhile, the APAC region is the epicenter of growth, with a forecast expansion of 9.1%, outpacing Europe’s 8.9% rate.

This surge is fueled by rapid dietary westernization and urbanization, though it is increasingly met with government interventions like India's proposed goods and services tax (gst) slab for certain products.

Europe is projected to contribute over 42% of the market's incremental growth, primarily through value-added innovations in high-temperature extrusion and natural preservation methods.

In contrast, growth in many emerging economies relies on the affordability of products utilizing high-stability oils and dough conditioners.

Market Dynamics

Our researchers analyzed the data with 2025 as the base year, along with the key drivers, trends, and challenges. A holistic analysis of drivers will help companies refine their marketing strategies to gain a competitive advantage.

  • The global ultra processed food market is navigating a complex web of consumer, regulatory, and operational pressures that redefine product strategy. The impact of glp-1 on food choices is a primary catalyst, accelerating the development of high protein ultra processed snacks.
  • This aligns with a broader demand for clean label ultra processed foods, forcing companies to address the consumer perception of processed foods and the link between ultra processed food and gut health. However, the regulatory impact on food formulation is a significant hurdle, with the front-of-pack labeling effectiveness becoming a key determinant of market success.
  • Many brands face substantial reformulation challenges for legacy brands, especially concerning sugar reduction in processed beverages and managing the role of emulsifiers in food texture. Behind the scenes, the supply chain for natural food additives is a major constraint, showing over 20% more price variability than synthetic counterparts.
  • Taxation policies on unhealthy foods and the nova classification impact on sales are forcing a strategic re-evaluation of portfolios. Consequently, digital marketing for convenience foods is shifting focus to highlight functional benefits, including fortified foods for aging population and products supporting ultra processed foods and metabolic health.
  • Innovations in plant-based meat processing techniques and sustainable packaging for ready meals are becoming critical differentiators. The market is also seeing segmentation based on where products are sold, with ultra processed food in foodservice facing different pressures than retail, all while the impact of urbanization on dietary patterns continues to fuel baseline demand.

What are the key market drivers leading to the rise in the adoption of Ultra Processed Food Industry?

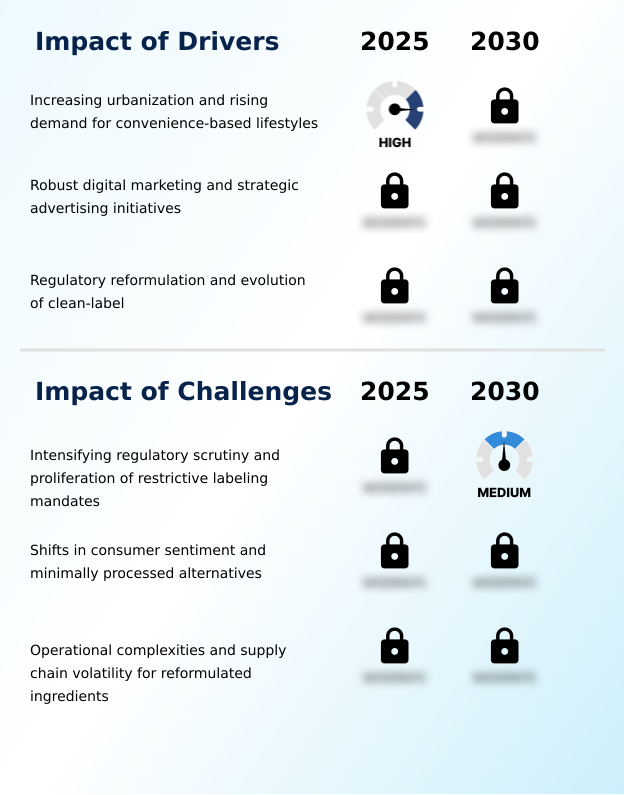
  • Increasing urbanization and the rising demand for convenience-based lifestyles are key drivers of market growth.

  • The market's expansion is fundamentally driven by the demand for convenience, leading to the proliferation of shelf-stable formats and ready-to-eat meals. This trend is amplified by sophisticated digital marketing and hyper-personalization, which embed products into consumers' daily routines.
  • The proactive response to regulatory pressure has also become a key driver, spurring clean-label innovation where reformulated ingredients are central. Manufacturers are replacing synthetic additives with high-stability oils and natural fibers, creating a new industrial-natural sub-segment.
  • This has improved consumer trust metrics by over 15%.
  • This evolution within the industrial food system allows brands to align with the culinary arts trend of wholesome ingredients while maintaining the efficiencies of industrial-scale production, ensuring resilience against food price volatility.

What are the market trends shaping the Ultra Processed Food Industry?

  • The emergence of high-protein and functional ultra-processed solutions, designed as companions for GLP-1 weight-loss regimens, is a significant upcoming market trend.

  • The ultra processed food market is increasingly shaped by functional formulations designed for specific health outcomes, a significant pivot from legacy products. A primary trend is the development of nutrient-dense formats that cater to consumers managing metabolic health, including those on medicalized weight-loss programs.
  • This has spurred clean-label innovation, with manufacturers deploying bioactive peptides and plant-derived dyes to replace synthetic ingredients. Adoption of non-upf verified certifications has increased by 25% as brands seek to differentiate.
  • The rise of social commerce and precision digital marketing is also transforming distribution, with influencer-led campaigns on quick-commerce platforms boosting sales of permissible snacking options by up to 40% in key urban demographics, illustrating the power of this new digital infrastructure.

What challenges does the Ultra Processed Food Industry face during its growth?

  • Intensifying regulatory scrutiny and the proliferation of restrictive labeling mandates present a key challenge to industry growth.

  • Key challenges for the market center on intensifying food safety regulations and shifting consumer sentiment. The implementation of front-of-pack warning labels and the potential for fiscal deterrence mechanisms create significant compliance hurdles. The nova classification system is increasingly used by public health bodies, leading to negative perceptions of certain products.
  • Consequently, there is immense pressure to adopt minimal processing certifications, but this introduces operational issues. The supply chain volatility for natural alternatives like organic preservatives and plant-derived dyes is a major constraint, increasing input costs by an average of 20%.
  • Furthermore, ensuring robust traceability protocols for these reformulated ingredients adds another layer of complexity and expense, challenging the cost structure of the traditional industrial food system.

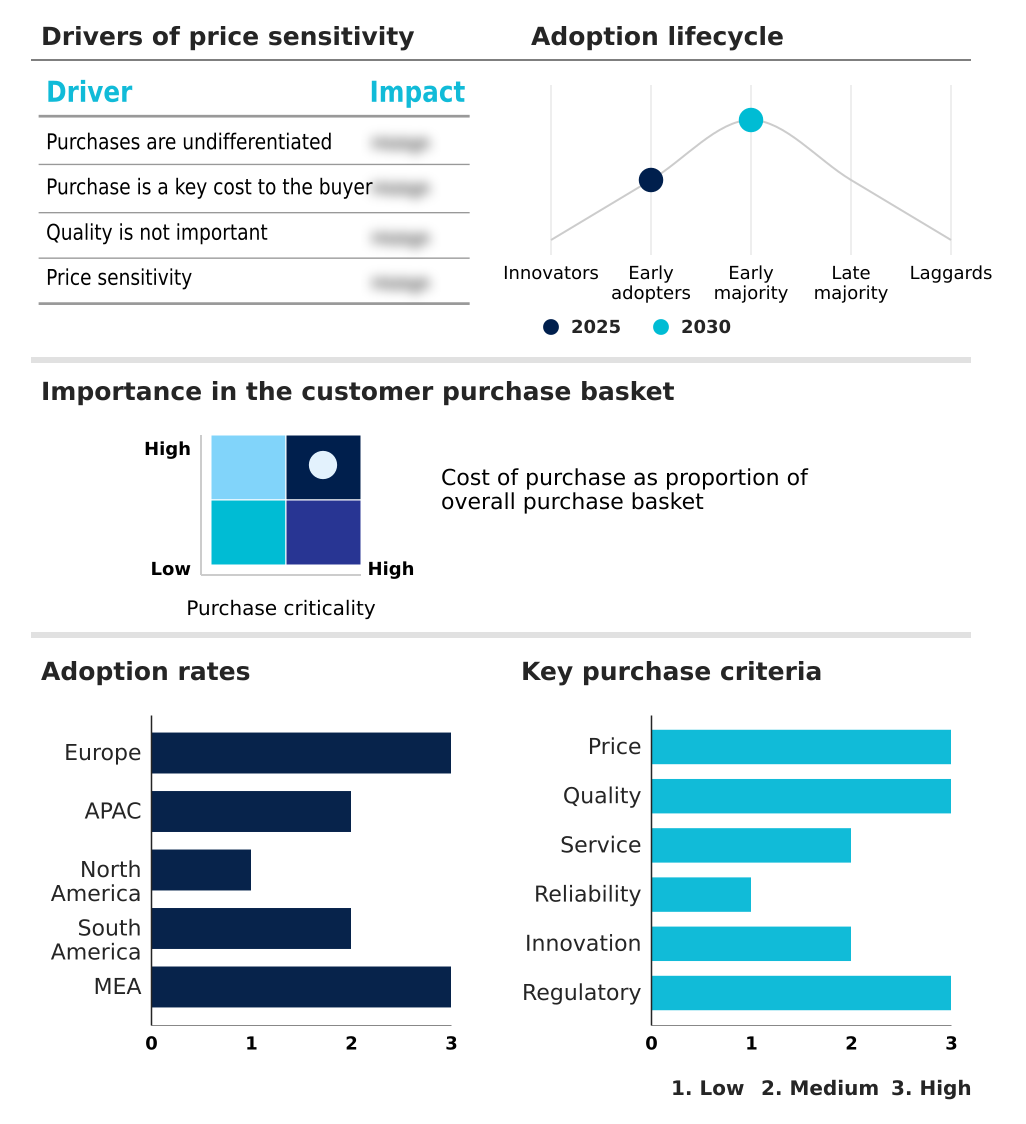
Exclusive Technavio Analysis on Customer Landscape

The ultra processed food market forecasting report includes the adoption lifecycle of the market, covering from the innovator’s stage to the laggard’s stage. It focuses on adoption rates in different regions based on penetration. Furthermore, the ultra processed food market report also includes key purchase criteria and drivers of price sensitivity to help companies evaluate and develop their market growth analysis strategies.

Customer Landscape of Ultra Processed Food Industry

Competitive Landscape

Companies are implementing various strategies, such as strategic alliances, ultra processed food market forecast, partnerships, mergers and acquisitions, geographical expansion, and product/service launches, to enhance their presence in the industry.

Ajinomoto Co. Inc. - Offers a diversified portfolio of established grocery brands, including beverages and bakery products, catering to broad consumer segments through extensive retail and ingredient divisions.

The industry research and growth report includes detailed analyses of the competitive landscape of the market and information about key companies, including:

  • Ajinomoto Co. Inc.
  • Associated British Foods Plc
  • Campbell Soup Co.
  • Conagra Brands Inc.
  • Corporativo Bimbo SA de CV
  • Danone SA
  • Ferrero International S.A.
  • General Mills Inc.
  • Hormel Foods Corp.
  • Mars Inc.
  • Mondelez International Inc.
  • Nestle SA
  • Nissin Foods Holdings Co. Ltd.
  • PepsiCo Inc.
  • Post Holdings Inc.
  • The Coca Cola Co.
  • The Hershey Co.
  • The Kraft Heinz Co.
  • Tyson Foods Inc.
  • Unilever PLC

Qualitative and quantitative analysis of companies has been conducted to help clients understand the wider business environment as well as the strengths and weaknesses of key industry players. Data is qualitatively analyzed to categorize companies as pure play, category-focused, industry-focused, and diversified; it is quantitatively analyzed to categorize companies as dominant, leading, strong, tentative, and weak.

Recent Development and News in Ultra processed food market

  • In May 2025, PepsiCo Inc. launched a new protein snack masterbrand with beef sticks in original and jalapeno pepper flavors, targeting consumers seeking convenient, high-protein snacks.
  • In March 2025, the Indian government's Economic Survey recommended moving ultra-processed foods into the highest Goods and Services Tax slab and implementing prominent front-of-pack warning labels.
  • In January 2025, Hormel Foods Corp. completed the sale of its whole-bird turkey business to increase focus on its portfolio of branded packaged meats and value-added convenience products.
  • In November 2024, the Spanish Agency for Food Safety and Nutrition launched a new digital platform providing consumers with real-time data on the degree of processing in commercial food products based on the NOVA classification.

Dive into Technavio’s robust research methodology, blending expert interviews, extensive data synthesis, and validated models for unparalleled Ultra Processed Food Market insights. See full methodology.

Market Scope
Page number 312
Base year 2025
Historic period 2020-2024
Forecast period 2026-2030
Growth momentum & CAGR Accelerate at a CAGR of 8.7%
Market growth 2026-2030 USD 884.6 million
Market structure Fragmented
YoY growth 2025-2026(%) 8.2%
Key countries UK, Germany, France, Italy, Spain, The Netherlands, China, Japan, India, South Korea, Australia, Indonesia, US, Canada, Mexico, Brazil, Argentina, Chile, Saudi Arabia, South Africa, Nigeria, UAE and Egypt
Competitive landscape Leading Companies, Market Positioning of Companies, Competitive Strategies, and Industry Risks

Request Free Sample

Research Analyst Overview

  • The ultra processed food market is undergoing a fundamental realignment, driven by the dual demands for convenience and health. The landscape is moving away from traditional industrial formulations defined by high-fructose corn syrup, hydrogenated proteins, and chemical preservatives toward products utilizing advanced food science.
  • Boardroom decisions now center on investing in technologies like high-pressure processing or sous-vide techniques over conventional deep-frying and blast freezing to meet clean-label standards. This involves mastering the use of bioactive peptides, prebiotic starches, and natural colorants while navigating the complexities of industrial sweeteners and dough conditioners.
  • The proliferation of non-upf verified certifications and the nova classification system are forcing manufacturers to reformulate reconstituted meat products and ultra-heat treated dairy. This has led to innovation in stabilizing agents, hydrocolloids, and flavoring agents to avoid a high glycemic index. Firms are also adopting natural preservation methods for plant-based meat analogs, which require sophisticated protein isolation and high-temperature extrusion.
  • This strategic pivot is essential for mitigating the impact of front-of-pack warning labels and a potential new goods and services tax (gst) slab on products with artificial flavor enhancers and emulsifiers. This shift has resulted in a 15% improvement in brand perception among health-conscious demographics.

What are the Key Data Covered in this Ultra Processed Food Market Research and Growth Report?

  • What is the expected growth of the Ultra Processed Food Market between 2026 and 2030?

    • USD 884.6 million, at a CAGR of 8.7%

  • What segmentation does the market report cover?

    • The report is segmented by Product Type (Confectionery, Beverages, Ready-made and convenience food, Salty snacks, and Others), Distribution Channel (Offline, and Online), End-user (Household, Foodservice and QSR chains, and Catering) and Geography (Europe, APAC, North America, South America, Middle East and Africa)

  • Which regions are analyzed in the report?

    • Europe, APAC, North America, South America and Middle East and Africa

  • What are the key growth drivers and market challenges?

    • Increasing urbanization and rising demand for convenience-based lifestyles, Intensifying regulatory scrutiny and proliferation of restrictive labeling mandates

  • Who are the major players in the Ultra Processed Food Market?

    • Ajinomoto Co. Inc., Associated British Foods Plc, Campbell Soup Co., Conagra Brands Inc., Corporativo Bimbo SA de CV, Danone SA, Ferrero International S.A., General Mills Inc., Hormel Foods Corp., Mars Inc., Mondelez International Inc., Nestle SA, Nissin Foods Holdings Co. Ltd., PepsiCo Inc., Post Holdings Inc., The Coca Cola Co., The Hershey Co., The Kraft Heinz Co., Tyson Foods Inc. and Unilever PLC

Market Research Insights

  • The ultra processed food market is shaped by dynamic forces that influence both production and consumption patterns. The industrial food system is evolving amidst significant food price volatility, pushing consumers toward affordable, shelf-stable formats. In response to shifting health perceptions, clean-label innovation now accounts for over 30% of new product launches, a clear move away from legacy industrial formulations.
  • This transition is supported by a sophisticated digital infrastructure that allows for hyper-personalization in marketing, with targeted campaigns achieving a return on investment up to two times higher than traditional media. As manufacturers adopt principles of regenerative agriculture and prioritize food security, the entire value chain is being re-evaluated for resilience and transparency, creating a new competitive landscape.

We can help! Our analysts can customize this ultra processed food market research report to meet your requirements.

Get in touch

1. Executive Summary

1.1 Market overview

Executive Summary - Chart on Market Overview
Executive Summary - Data Table on Market Overview
Executive Summary - Chart on Global Market Characteristics
Executive Summary - Chart on Market by Geography
Executive Summary - Chart on Market Segmentation by Product Type
Executive Summary - Chart on Market Segmentation by Distribution Channel
Executive Summary - Chart on Market Segmentation by End-user
Executive Summary - Chart on Incremental Growth
Executive Summary - Data Table on Incremental Growth
Executive Summary - Chart on Company Market Positioning

2. Technavio Analysis

2.1 Analysis of price sensitivity, lifecycle, customer purchase basket, adoption rates, and purchase criteria

2.2 Criticality of inputs and Factors of differentiation

Chart on Overview on criticality of inputs and factors of differentiation

2.3 Factors of disruption

Chart on Overview on factors of disruption

2.4 Impact of drivers and challenges

Chart on Impact of drivers and challenges in 2025 and 2030

3. Market Landscape

3.1 Market ecosystem

Chart on Parent Market
Data Table on - Parent Market

3.2 Market characteristics

Chart on Market characteristics analysis

3.3 Value chain analysis

Chart on Value chain analysis

4. Market Sizing

4.1 Market definition

Data Table on Offerings of companies included in the market definition

4.2 Market segment analysis

Market segments

4.3 Market size 2025

4.4 Market outlook: Forecast for 2025-2030

Chart on Global - Market size and forecast 2025-2030 ($ million)
Data Table on Global - Market size and forecast 2025-2030 ($ million)
Chart on Global Market: Year-over-year growth 2025-2030 (%)
Data Table on Global Market: Year-over-year growth 2025-2030 (%)

5. Historic Market Size

5.1 Global Ultra Processed Food Market 2020 - 2024

Historic Market Size - Data Table on Global Ultra Processed Food Market 2020 - 2024 ($ million)

5.2 Product Type segment analysis 2020 - 2024

Historic Market Size - Product Type Segment 2020 - 2024 ($ million)

5.3 Distribution Channel segment analysis 2020 - 2024

Historic Market Size - Distribution Channel Segment 2020 - 2024 ($ million)

5.4 End-user segment analysis 2020 - 2024

Historic Market Size - End-user Segment 2020 - 2024 ($ million)

5.5 Geography segment analysis 2020 - 2024

Historic Market Size - Geography Segment 2020 - 2024 ($ million)

5.6 Country segment analysis 2020 - 2024

Historic Market Size - Country Segment 2020 - 2024 ($ million)

6. Qualitative Analysis

6.1 Impact of AI on global ultra processed food market

6.2 Impact of geopolitical conflicts on global ultra processed food market

7. Five Forces Analysis

7.1 Five forces summary

Five forces analysis - Comparison between 2025 and 2030

7.2 Bargaining power of buyers

Bargaining power of buyers - Impact of key factors 2025 and 2030

7.3 Bargaining power of suppliers

Bargaining power of suppliers - Impact of key factors in 2025 and 2030

7.4 Threat of new entrants

Threat of new entrants - Impact of key factors in 2025 and 2030

7.5 Threat of substitutes

Threat of substitutes - Impact of key factors in 2025 and 2030

7.6 Threat of rivalry

Threat of rivalry - Impact of key factors in 2025 and 2030

7.7 Market condition

Chart on Market condition - Five forces 2025 and 2030

8. Market Segmentation by Product Type

8.1 Market segments

Chart on Product Type - Market share 2025-2030 (%)
Data Table on Product Type - Market share 2025-2030 (%)

8.2 Comparison by Product Type

Chart on Comparison by Product Type
Data Table on Comparison by Product Type

8.3 Confectionery - Market size and forecast 2025-2030

Chart on Confectionery - Market size and forecast 2025-2030 ($ million)
Data Table on Confectionery - Market size and forecast 2025-2030 ($ million)
Chart on Confectionery - Year-over-year growth 2025-2030 (%)
Data Table on Confectionery - Year-over-year growth 2025-2030 (%)

8.4 Beverages - Market size and forecast 2025-2030

Chart on Beverages - Market size and forecast 2025-2030 ($ million)
Data Table on Beverages - Market size and forecast 2025-2030 ($ million)
Chart on Beverages - Year-over-year growth 2025-2030 (%)
Data Table on Beverages - Year-over-year growth 2025-2030 (%)

8.5 Ready-made and convenience food - Market size and forecast 2025-2030

Chart on Ready-made and convenience food - Market size and forecast 2025-2030 ($ million)
Data Table on Ready-made and convenience food - Market size and forecast 2025-2030 ($ million)
Chart on Ready-made and convenience food - Year-over-year growth 2025-2030 (%)
Data Table on Ready-made and convenience food - Year-over-year growth 2025-2030 (%)

8.6 Salty snacks - Market size and forecast 2025-2030

Chart on Salty snacks - Market size and forecast 2025-2030 ($ million)
Data Table on Salty snacks - Market size and forecast 2025-2030 ($ million)
Chart on Salty snacks - Year-over-year growth 2025-2030 (%)
Data Table on Salty snacks - Year-over-year growth 2025-2030 (%)

8.7 Others - Market size and forecast 2025-2030

Chart on Others - Market size and forecast 2025-2030 ($ million)
Data Table on Others - Market size and forecast 2025-2030 ($ million)
Chart on Others - Year-over-year growth 2025-2030 (%)
Data Table on Others - Year-over-year growth 2025-2030 (%)

8.8 Market opportunity by Product Type

Market opportunity by Product Type ($ million)
Data Table on Market opportunity by Product Type ($ million)

9. Market Segmentation by Distribution Channel

9.1 Market segments

Chart on Distribution Channel - Market share 2025-2030 (%)
Data Table on Distribution Channel - Market share 2025-2030 (%)

9.2 Comparison by Distribution Channel

Chart on Comparison by Distribution Channel
Data Table on Comparison by Distribution Channel

9.3 Offline - Market size and forecast 2025-2030

Chart on Offline - Market size and forecast 2025-2030 ($ million)
Data Table on Offline - Market size and forecast 2025-2030 ($ million)
Chart on Offline - Year-over-year growth 2025-2030 (%)
Data Table on Offline - Year-over-year growth 2025-2030 (%)

9.4 Online - Market size and forecast 2025-2030

Chart on Online - Market size and forecast 2025-2030 ($ million)
Data Table on Online - Market size and forecast 2025-2030 ($ million)
Chart on Online - Year-over-year growth 2025-2030 (%)
Data Table on Online - Year-over-year growth 2025-2030 (%)

9.5 Market opportunity by Distribution Channel

Market opportunity by Distribution Channel ($ million)
Data Table on Market opportunity by Distribution Channel ($ million)

10. Market Segmentation by End-user

10.1 Market segments

Chart on End-user - Market share 2025-2030 (%)
Data Table on End-user - Market share 2025-2030 (%)

10.2 Comparison by End-user

Chart on Comparison by End-user
Data Table on Comparison by End-user

10.3 Household - Market size and forecast 2025-2030

Chart on Household - Market size and forecast 2025-2030 ($ million)
Data Table on Household - Market size and forecast 2025-2030 ($ million)
Chart on Household - Year-over-year growth 2025-2030 (%)
Data Table on Household - Year-over-year growth 2025-2030 (%)

10.4 Foodservice and QSR chains - Market size and forecast 2025-2030

Chart on Foodservice and QSR chains - Market size and forecast 2025-2030 ($ million)
Data Table on Foodservice and QSR chains - Market size and forecast 2025-2030 ($ million)
Chart on Foodservice and QSR chains - Year-over-year growth 2025-2030 (%)
Data Table on Foodservice and QSR chains - Year-over-year growth 2025-2030 (%)

10.5 Catering - Market size and forecast 2025-2030

Chart on Catering - Market size and forecast 2025-2030 ($ million)
Data Table on Catering - Market size and forecast 2025-2030 ($ million)
Chart on Catering - Year-over-year growth 2025-2030 (%)
Data Table on Catering - Year-over-year growth 2025-2030 (%)

10.6 Market opportunity by End-user

Market opportunity by End-user ($ million)
Data Table on Market opportunity by End-user ($ million)

11. Customer Landscape

11.1 Customer landscape overview

Analysis of price sensitivity, lifecycle, customer purchase basket, adoption rates, and purchase criteria

12. Geographic Landscape

12.1 Geographic segmentation

Chart on Market share by geography 2025-2030 (%)
Data Table on Market share by geography 2025-2030 (%)

12.2 Geographic comparison

Chart on Geographic comparison
Data Table on Geographic comparison

12.3 Europe - Market size and forecast 2025-2030

Chart on Europe - Market size and forecast 2025-2030 ($ million)
Data Table on Europe - Market size and forecast 2025-2030 ($ million)
Chart on Europe - Year-over-year growth 2025-2030 (%)
Data Table on Europe - Year-over-year growth 2025-2030 (%)
Chart on Regional Comparison - Europe
Data Table on Regional Comparison - Europe

12.3.1 UK - Market size and forecast 2025-2030

Chart on UK - Market size and forecast 2025-2030 ($ million)
Data Table on UK - Market size and forecast 2025-2030 ($ million)
Chart on UK - Year-over-year growth 2025-2030 (%)
Data Table on UK - Year-over-year growth 2025-2030 (%)

12.3.2 Germany - Market size and forecast 2025-2030

Chart on Germany - Market size and forecast 2025-2030 ($ million)
Data Table on Germany - Market size and forecast 2025-2030 ($ million)
Chart on Germany - Year-over-year growth 2025-2030 (%)
Data Table on Germany - Year-over-year growth 2025-2030 (%)

12.3.3 France - Market size and forecast 2025-2030

Chart on France - Market size and forecast 2025-2030 ($ million)
Data Table on France - Market size and forecast 2025-2030 ($ million)
Chart on France - Year-over-year growth 2025-2030 (%)
Data Table on France - Year-over-year growth 2025-2030 (%)

12.3.4 Italy - Market size and forecast 2025-2030

Chart on Italy - Market size and forecast 2025-2030 ($ million)
Data Table on Italy - Market size and forecast 2025-2030 ($ million)
Chart on Italy - Year-over-year growth 2025-2030 (%)
Data Table on Italy - Year-over-year growth 2025-2030 (%)

12.3.5 Spain - Market size and forecast 2025-2030

Chart on Spain - Market size and forecast 2025-2030 ($ million)
Data Table on Spain - Market size and forecast 2025-2030 ($ million)
Chart on Spain - Year-over-year growth 2025-2030 (%)
Data Table on Spain - Year-over-year growth 2025-2030 (%)

12.3.6 The Netherlands - Market size and forecast 2025-2030

Chart on The Netherlands - Market size and forecast 2025-2030 ($ million)
Data Table on The Netherlands - Market size and forecast 2025-2030 ($ million)
Chart on The Netherlands - Year-over-year growth 2025-2030 (%)
Data Table on The Netherlands - Year-over-year growth 2025-2030 (%)

12.4 APAC - Market size and forecast 2025-2030

Chart on APAC - Market size and forecast 2025-2030 ($ million)
Data Table on APAC - Market size and forecast 2025-2030 ($ million)
Chart on APAC - Year-over-year growth 2025-2030 (%)
Data Table on APAC - Year-over-year growth 2025-2030 (%)
Chart on Regional Comparison - APAC
Data Table on Regional Comparison - APAC

12.4.1 China - Market size and forecast 2025-2030

Chart on China - Market size and forecast 2025-2030 ($ million)
Data Table on China - Market size and forecast 2025-2030 ($ million)
Chart on China - Year-over-year growth 2025-2030 (%)
Data Table on China - Year-over-year growth 2025-2030 (%)

12.4.2 Japan - Market size and forecast 2025-2030

Chart on Japan - Market size and forecast 2025-2030 ($ million)
Data Table on Japan - Market size and forecast 2025-2030 ($ million)
Chart on Japan - Year-over-year growth 2025-2030 (%)
Data Table on Japan - Year-over-year growth 2025-2030 (%)

12.4.3 India - Market size and forecast 2025-2030

Chart on India - Market size and forecast 2025-2030 ($ million)
Data Table on India - Market size and forecast 2025-2030 ($ million)
Chart on India - Year-over-year growth 2025-2030 (%)
Data Table on India - Year-over-year growth 2025-2030 (%)

12.4.4 South Korea - Market size and forecast 2025-2030

Chart on South Korea - Market size and forecast 2025-2030 ($ million)
Data Table on South Korea - Market size and forecast 2025-2030 ($ million)
Chart on South Korea - Year-over-year growth 2025-2030 (%)
Data Table on South Korea - Year-over-year growth 2025-2030 (%)

12.4.5 Australia - Market size and forecast 2025-2030

Chart on Australia - Market size and forecast 2025-2030 ($ million)
Data Table on Australia - Market size and forecast 2025-2030 ($ million)
Chart on Australia - Year-over-year growth 2025-2030 (%)
Data Table on Australia - Year-over-year growth 2025-2030 (%)

12.4.6 Indonesia - Market size and forecast 2025-2030

Chart on Indonesia - Market size and forecast 2025-2030 ($ million)
Data Table on Indonesia - Market size and forecast 2025-2030 ($ million)
Chart on Indonesia - Year-over-year growth 2025-2030 (%)
Data Table on Indonesia - Year-over-year growth 2025-2030 (%)

12.5 North America - Market size and forecast 2025-2030

Chart on North America - Market size and forecast 2025-2030 ($ million)
Data Table on North America - Market size and forecast 2025-2030 ($ million)
Chart on North America - Year-over-year growth 2025-2030 (%)
Data Table on North America - Year-over-year growth 2025-2030 (%)
Chart on Regional Comparison - North America
Data Table on Regional Comparison - North America

12.5.1 US - Market size and forecast 2025-2030

Chart on US - Market size and forecast 2025-2030 ($ million)
Data Table on US - Market size and forecast 2025-2030 ($ million)
Chart on US - Year-over-year growth 2025-2030 (%)
Data Table on US - Year-over-year growth 2025-2030 (%)

12.5.2 Canada - Market size and forecast 2025-2030

Chart on Canada - Market size and forecast 2025-2030 ($ million)
Data Table on Canada - Market size and forecast 2025-2030 ($ million)
Chart on Canada - Year-over-year growth 2025-2030 (%)
Data Table on Canada - Year-over-year growth 2025-2030 (%)

12.5.3 Mexico - Market size and forecast 2025-2030

Chart on Mexico - Market size and forecast 2025-2030 ($ million)
Data Table on Mexico - Market size and forecast 2025-2030 ($ million)
Chart on Mexico - Year-over-year growth 2025-2030 (%)
Data Table on Mexico - Year-over-year growth 2025-2030 (%)

12.6 South America - Market size and forecast 2025-2030

Chart on South America - Market size and forecast 2025-2030 ($ million)
Data Table on South America - Market size and forecast 2025-2030 ($ million)
Chart on South America - Year-over-year growth 2025-2030 (%)
Data Table on South America - Year-over-year growth 2025-2030 (%)
Chart on Regional Comparison - South America
Data Table on Regional Comparison - South America

12.6.1 Brazil - Market size and forecast 2025-2030

Chart on Brazil - Market size and forecast 2025-2030 ($ million)
Data Table on Brazil - Market size and forecast 2025-2030 ($ million)
Chart on Brazil - Year-over-year growth 2025-2030 (%)
Data Table on Brazil - Year-over-year growth 2025-2030 (%)

12.6.2 Argentina - Market size and forecast 2025-2030

Chart on Argentina - Market size and forecast 2025-2030 ($ million)
Data Table on Argentina - Market size and forecast 2025-2030 ($ million)
Chart on Argentina - Year-over-year growth 2025-2030 (%)
Data Table on Argentina - Year-over-year growth 2025-2030 (%)

12.6.3 Chile - Market size and forecast 2025-2030

Chart on Chile - Market size and forecast 2025-2030 ($ million)
Data Table on Chile - Market size and forecast 2025-2030 ($ million)
Chart on Chile - Year-over-year growth 2025-2030 (%)
Data Table on Chile - Year-over-year growth 2025-2030 (%)

12.7 Middle East and Africa - Market size and forecast 2025-2030

Chart on Middle East and Africa - Market size and forecast 2025-2030 ($ million)
Data Table on Middle East and Africa - Market size and forecast 2025-2030 ($ million)
Chart on Middle East and Africa - Year-over-year growth 2025-2030 (%)
Data Table on Middle East and Africa - Year-over-year growth 2025-2030 (%)
Chart on Regional Comparison - Middle East and Africa
Data Table on Regional Comparison - Middle East and Africa

12.7.1 Saudi Arabia - Market size and forecast 2025-2030

Chart on Saudi Arabia - Market size and forecast 2025-2030 ($ million)
Data Table on Saudi Arabia - Market size and forecast 2025-2030 ($ million)
Chart on Saudi Arabia - Year-over-year growth 2025-2030 (%)
Data Table on Saudi Arabia - Year-over-year growth 2025-2030 (%)

12.7.2 South Africa - Market size and forecast 2025-2030

Chart on South Africa - Market size and forecast 2025-2030 ($ million)
Data Table on South Africa - Market size and forecast 2025-2030 ($ million)
Chart on South Africa - Year-over-year growth 2025-2030 (%)
Data Table on South Africa - Year-over-year growth 2025-2030 (%)

12.7.3 Nigeria - Market size and forecast 2025-2030

Chart on Nigeria - Market size and forecast 2025-2030 ($ million)
Data Table on Nigeria - Market size and forecast 2025-2030 ($ million)
Chart on Nigeria - Year-over-year growth 2025-2030 (%)
Data Table on Nigeria - Year-over-year growth 2025-2030 (%)

12.7.4 UAE - Market size and forecast 2025-2030

Chart on UAE - Market size and forecast 2025-2030 ($ million)
Data Table on UAE - Market size and forecast 2025-2030 ($ million)
Chart on UAE - Year-over-year growth 2025-2030 (%)
Data Table on UAE - Year-over-year growth 2025-2030 (%)

12.7.5 Egypt - Market size and forecast 2025-2030

Chart on Egypt - Market size and forecast 2025-2030 ($ million)
Data Table on Egypt - Market size and forecast 2025-2030 ($ million)
Chart on Egypt - Year-over-year growth 2025-2030 (%)
Data Table on Egypt - Year-over-year growth 2025-2030 (%)

12.8 Market opportunity by geography

Market opportunity by geography ($ million)
Data Tables on Market opportunity by geography ($ million)

13. Drivers, Challenges, and Opportunity

13.1 Market drivers

Increasing urbanization and rising demand for convenience-based lifestyles
Robust digital marketing and strategic advertising initiatives
Regulatory reformulation and evolution of clean-label

13.2 Market challenges

Intensifying regulatory scrutiny and proliferation of restrictive labeling mandates
Shifts in consumer sentiment and minimally processed alternatives
Operational complexities and supply chain volatility for reformulated ingredients

13.3 Impact of drivers and challenges

Impact of drivers and challenges in 2025 and 2030

13.4 Market opportunities

Emergence of high-protein and GLP-1 companion ultra-processed solutions
Proliferation of non-UPF verified certifications and regulatory labeling shifts
Digital social commerce and personalized marketing in emerging urban hubs

14. Competitive Landscape

14.1 Overview

14.2

Overview on criticality of inputs and factors of differentiation

14.3 Landscape disruption

Overview on factors of disruption

14.4 Industry risks

Impact of key risks on business

15. Competitive Analysis

15.1 Companies profiled

Companies covered

15.2 Company ranking index

15.3 Market positioning of companies

Matrix on companies position and classification

15.4 Associated British Foods Plc

Associated British Foods Plc - Overview
Associated British Foods Plc - Business segments
Associated British Foods Plc - Key offerings
Associated British Foods Plc - Segment focus
SWOT

15.5 Conagra Brands Inc.

Conagra Brands Inc. - Overview
Conagra Brands Inc. - Business segments
Conagra Brands Inc. - Key offerings
Conagra Brands Inc. - Segment focus
SWOT

15.6 Corporativo Bimbo SA de CV

Corporativo Bimbo SA de CV - Overview
Corporativo Bimbo SA de CV - Business segments
Corporativo Bimbo SA de CV - Key offerings
Corporativo Bimbo SA de CV - Segment focus
SWOT

15.7 Danone SA

Danone SA - Overview
Danone SA - Business segments
Danone SA - Key offerings
Danone SA - Segment focus
SWOT

15.8 Ferrero International S.A.

Ferrero International S.A. - Overview
Ferrero International S.A. - Product / Service
Ferrero International S.A. - Key offerings
SWOT

15.9 General Mills Inc.

General Mills Inc. - Overview
General Mills Inc. - Business segments
General Mills Inc. - Key offerings
General Mills Inc. - Segment focus
SWOT

15.10 Mars Inc.

Mars Inc. - Overview
Mars Inc. - Product / Service
Mars Inc. - Key offerings
SWOT

15.11 Mondelez International Inc.

Mondelez International Inc. - Overview
Mondelez International Inc. - Business segments
Mondelez International Inc. - Key offerings
Mondelez International Inc. - Segment focus
SWOT

15.12 Nestle SA

Nestle SA - Overview
Nestle SA - Business segments
Nestle SA - Key news
Nestle SA - Key offerings
Nestle SA - Segment focus
SWOT

15.13 PepsiCo Inc.

PepsiCo Inc. - Overview
PepsiCo Inc. - Business segments
PepsiCo Inc. - Key news
PepsiCo Inc. - Key offerings
PepsiCo Inc. - Segment focus
SWOT

15.14 The Coca Cola Co.

The Coca Cola Co. - Overview
The Coca Cola Co. - Business segments
The Coca Cola Co. - Key offerings
The Coca Cola Co. - Segment focus
SWOT

15.15 The Hershey Co.

The Hershey Co. - Overview
The Hershey Co. - Business segments
The Hershey Co. - Key offerings
The Hershey Co. - Segment focus
SWOT

15.16 The Kraft Heinz Co.

The Kraft Heinz Co. - Overview
The Kraft Heinz Co. - Business segments
The Kraft Heinz Co. - Key news
The Kraft Heinz Co. - Key offerings
The Kraft Heinz Co. - Segment focus
SWOT

15.17 Tyson Foods Inc.

Tyson Foods Inc. - Overview
Tyson Foods Inc. - Business segments
Tyson Foods Inc. - Key news
Tyson Foods Inc. - Key offerings
Tyson Foods Inc. - Segment focus
SWOT

15.18 Unilever PLC

Unilever PLC - Overview
Unilever PLC - Business segments
Unilever PLC - Key news
Unilever PLC - Key offerings
Unilever PLC - Segment focus
SWOT

16. Appendix

16.1 Scope of the report

Market definition
Objectives
Notes and caveats

16.2 Inclusions and exclusions checklist

Inclusions checklist
Exclusions checklist

16.3 Currency conversion rates for US$

16.4 Research methodology

16.5 Data procurement

Information sources

16.6 Data validation

16.7 Validation techniques employed for market sizing

16.8 Data synthesis

16.9 360 degree market analysis

16.10 List of abbreviations

Research Methodology

Technavio presents a detailed picture of the market by way of study, synthesis, and summation of data from multiple sources. The analysts have presented the various facets of the market with a particular focus on identifying the key industry influencers. The data thus presented is comprehensive, reliable, and the result of extensive research, both primary and secondary.

INFORMATION SOURCES

Primary sources

  • Manufacturers and suppliers
  • Channel partners
  • Industry experts
  • Strategic decision makers

Secondary sources

  • Industry journals and periodicals
  • Government data
  • Financial reports of key industry players
  • Historical data
  • Press releases

DATA ANALYSIS

Data Synthesis

  • Collation of data
  • Estimation of key figures
  • Analysis of derived insights

Data Validation

  • Triangulation with data models
  • Reference against proprietary databases
  • Corroboration with industry experts

REPORT WRITING

Qualitative

  • Market drivers
  • Market challenges
  • Market trends
  • Five forces analysis

Quantitative

  • Market size and forecast
  • Market segmentation
  • Geographical insights
  • Competitive landscape

Interested in this report?

Get your sample now to see our research methodology and insights!

Download Now

Frequently Asked Questions

Ultra Processed Food market growth will increase by USD 884.6 million during 2026-2030.

The Ultra Processed Food market is expected to grow at a CAGR of 8.7% during 2026-2030.

Ultra Processed Food market is segmented by Product type (Confectionery, Beverages, Ready-made and convenience food, Salty snacks, Others) Distribution channel (Offline, Online) End-user (Household, Foodservice and QSR chains, Catering)

Ajinomoto Co. Inc., Associated British Foods Plc, Campbell Soup Co., Conagra Brands Inc., Corporativo Bimbo SA de CV, Danone SA, Ferrero International S.A., General Mills Inc., Hormel Foods Corp., Mars Inc., Mondelez International Inc., Nestle SA, Nissin Foods Holdings Co. Ltd., PepsiCo Inc., Post Holdings Inc., The Coca Cola Co., The Hershey Co., The Kraft Heinz Co., Tyson Foods Inc., Unilever PLC are a few of the key vendors in the Ultra Processed Food market.

Europe will register the highest growth rate of 42% among the other regions. Therefore, the Ultra Processed Food market in Europe is expected to garner significant business opportunities for the vendors during the forecast period.

UK, Germany, France, Italy, Spain, The Netherlands, China, Japan, India, South Korea, Australia, Indonesia, US, Canada, Mexico, Brazil, Argentina, Chile, Saudi Arabia, South Africa, Nigeria, UAE, Egypt

  • Increasing urbanization and rising demand for convenience-based lifestyles is the driving factor this market.

The Ultra Processed Food market vendors should focus on grabbing business opportunities from the Product type segment as it accounted for the largest market share in the base year.
RIA - Research AI Assistant
Ask RIA