Urban Planning Software Market Analysis North America, Europe, APAC, South America, Middle East and Africa - US, UK, Canada, China, Germany - Size and Forecast 2024-2028

Urban Planning Software Market Analysis North America, Europe, APAC, South America, Middle East and Africa - US, UK, Canada, China, Germany - Size and Forecast 2024-2028

Published: Aug 2024 163 Pages SKU: IRTNTR76423

Market Overview at a Glance

$4.06 B
Market Opportunity
7.81%
CAGR
7.24
YoY growth 2023-2024(%)

Urban Planning Software Market Size 2024-2028

The Urban Planning Software Market size is estimated to grow by USD 4.05 billion at a CAGR of 7.81% between 2023 and 2028. Infrastructure development is a priority area for many governments and organizations worldwide, driven by increasing investments and a growing focus on building smart cities. This trend is fueled by several factors, including the expanding middle-class population and the need for efficient, modern infrastructure to support economic growth and improve quality of life. Infrastructure projects encompass various sectors, such as transportation, energy, water supply, and telecommunications, and require significant capital investment and advanced technology. As a result, the infrastructure industry is poised for continued growth and innovation, offering opportunities for businesses and investors alike.

What will be the size of the Market During the Forecast Period?

Urban Planning Software Market Size

To learn more about this report, View the Report Sample

Market Dynamics

The market is witnessing significant growth due to the increasing number of non-residential construction projects and infrastructure development activities in response to the growing urban population. City planners are leveraging technology to efficiently manage and design urban spaces. The market is segmented into components, which include software and services, and segments, such as the cloud-based segment and web-based segment. Government bodies are also investing in urban planning software to optimize budgets and implement smart city technologies. Emerging countries are leveraging technology advancements and cloud software to enhance construction processes and infrastructure development, with a focus on designing residential buildings, roads, bridges, and rail systems, supported by skilled professionals and real estate companies, while government agencies and service companies implement training programs and resource management solutions to optimize engineering and architectural plans. The latest trends include the integration of 5G technology and data centers to enhance the functionality and efficiency of these tools. Open-source software is gaining popularity due to its cost-effectiveness and flexibility. The United Nations (UN) has emphasized the importance of urban planning to address the challenges of urbanization and sustainability. Urban planning software plays a crucial role in this regard, enabling city planners to create harmonious and livable urban spaces. The market is expected to continue its growth trajectory in the coming years, driven by the increasing demand for efficient and technologically advanced urban planning solutions.

Key Market Driver

One of the key factors driving the market growth is the growing middle-class population. The increasing middle-class population in developing countries in APAC, South America, and MEA is expected to significantly contribute to the market growth. In addition, there is an increase in per capita income due to the rapidly increasing economic activities in developing economies such as China, India, Argentina, Indonesia, and South Africa.

Moreover, the rise in the gross domestic product (GDP) per capita in these countries is also fuelling the rise in the disposable income of the population. In addition, a majority of the population is opting for long-term investment opportunities due to factors such as rapid industrial, manufacturing, and economic developments in these countries, fuelled by urbanization. As a result, there is an increasing adoption of software for different real-estate projects. Hence, such factors are positively impacting the market which, in turn, will drive the growth during the forecast period.

Significant Market Trend

A key factor shaping the market growth is the use of blockchain technology in software. There is a rapid advancement in technologies that can resolve the challenges associated with the openness of data and procedures in the market. The advent of blockchain technology enables transparency at all levels of activity in urban planning making it effective.

Moreover, the main advantage of using blockchain in urban planning is that there is a reduction in fraud and transaction duplication as every record is encrypted. Furthermore, the implementation of blockchain offers smooth and quick transactions by doing away with the necessity for a middleman. Hence, such factors are positively impacting the market trends which in turn will drive the market growth during the forecast period.

Major Market Challenge

The threat of open-source urban planning software is one of the key challenges hindering growth. There is a growing popularity for open-source software which poses a significant threat to the market. There is an increasing preference for open-source software as it is widely available on the Internet and can be downloaded easily.

Moreover, open-source software provides cost benefits and scalability in addition to transparency. There is increasing adoption of open-source software among organizations with limited budgets instead of paid software. Hence, such factors are negatively impacting the market which in turn will hinder the growth during the forecast period.

Market Segmentation

By Deployment

The cloud-based segment is estimated to witness significant growth during the forecast period. There is an increasing adoption of cloud-based urban planning software across enterprises and governments in order to meet the growing demand for customization, agility, and scalability.  The main advantage of this segment is that it provides all the related processes on a single interactive screen, which enables a productive and collaborative development process.

Urban Planning Software Market Size

Get a glance at the market contribution of various segments View Free  PDF Sample

The cloud-based segment was the largest segment and was valued at USD 4.74 billion in 2018. In addition, the cloud-based segment essentially lowers the risk of data incongruency and increases the availability of real-time data thereby enabling more efficient resource use and management. Therefore, such benefits of the cloud-based segment are fuelling its adoption and significantly contributing to the growth of this segment. Factors such as operational demands, an increase in resource management, responsiveness toward current strategies, the implementation of new business strategies, and an increase in various government and military programs are expected to fuel the growth of this segment which in turn will drive the growth during the forecast period.

By End-user

The growing demand for urban planning software in the government segment will increase the market growth. There is an increasing focus by government organizations on services including building operations and control, coupled with legislative buildings, embassies, and smart cities. For instance, in the US, the federal government focuses on using sustainable building design to achieve the energy efficiency of buildings. There is a major role for management in the management of cities and airports, and urban planners have a vital responsibility in ensuring the seamless operation of facilities. Hence, such factors are expected to fuel the growth of this segment which in turn will drive the growth during the forecast period.

By Region

Urban Planning Software Market Share by Geography

For more insights on the market share of various regions Download PDF Sample now!

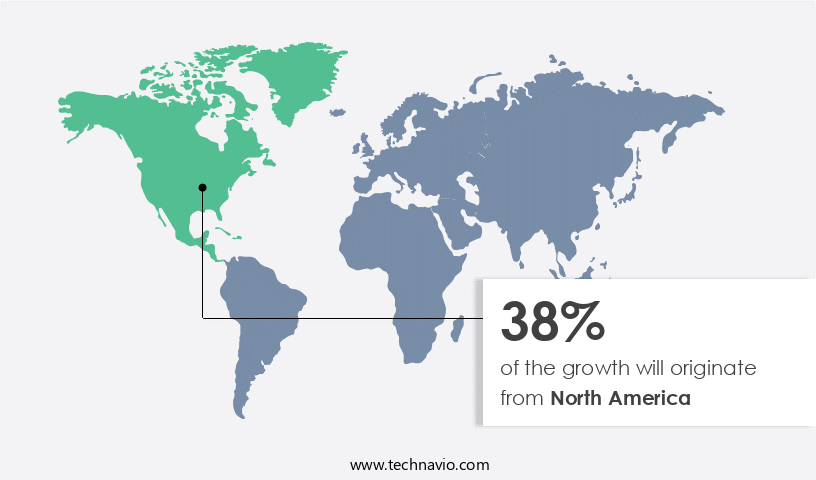
North America is estimated to contribute 38% to the growth of the global market during the forecast period. Technavio’s analysts have elaborately explained the regional trends and drivers that shape the market during the forecast period. One of the main factors that are significantly contributing to the growth of the market in North America is the early adoption of technologies in the region. Several factors, such as the growing adoption of smart cities, the adoption of digital technologies, and connected infrastructure to the existing megacities in the region, are positively impacting the market growth in the region.

Moreover, there is an increasing adoption of software due to the expansion of cities in several regions of North America such as Chicago, New York City, Los Angeles, Calgary, Vancouver, Seattle, Toronto, Boston, and Mexico City. Furthermore, the maturity of the sector results in an abundance of use cases that eventually lead to a faster rate of technology adoption. Hence, such factors are expected to drive growth in North America during the forecast period.

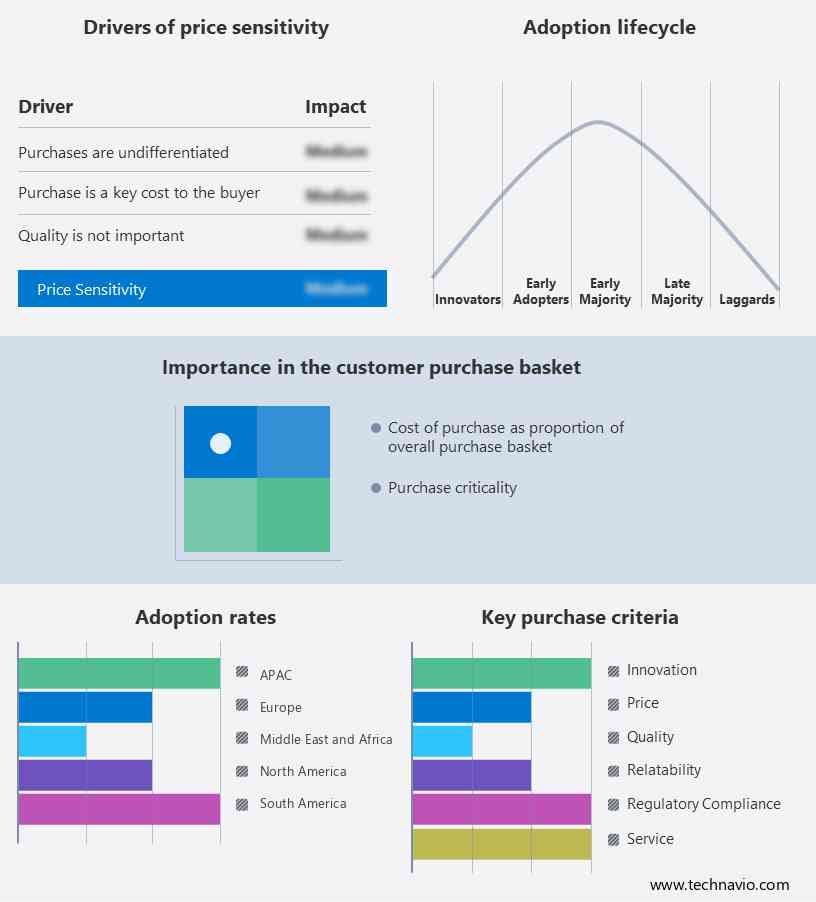
Market Customer Landscape

The market growth analysis report includes the adoption lifecycle of the market, covering from the innovator’s stage to the laggard’s stage. It focuses on adoption rates in different regions based on penetration. Furthermore, the market forecasting report also includes key purchase criteria and drivers of price sensitivity to help companies evaluate and develop their growth strategies.

Urban Planning Software Market Share by Geography

Customer Landscape

Who are the Major Market Companies?

Companies are implementing various strategies, such as strategic alliances, partnerships, mergers and acquisitions, geographical expansion, and product/service launches, to enhance their presence in the market.

3IXAM SOFTWARE LLC: The company offers 3IXAM, a comprehensive suite of features to design and visualize futuristic cityscapes.

AgiliCity d.o.o: The company offers Modelur for architects, urban designers, and planners with all the essential tools needed to easily test multiple urban massing options in the 3D modeling environment.

Alphabet Inc: The company offers Sidewalk Labs LLC namely Delve which empowers real estate teams to design better, faster, with less risk.

The market growth and forecasting report also includes detailed analyses of the competitive landscape of the market and information about 17 market companies, including:

  • Autodesk Inc.
  • Bentley Systems Inc.
  • CityCAD Technologies Ltd.
  • Esri Global Inc.
  • Lumion
  • Nextsense
  • Savannah Simulations AG
  • Strategis Groep BV
  • Trimble Inc.
  • UrbanFootprint Inc.
  • UrbanSim Inc.
  • Urpla Pty Ltd.
  • Sasaki Associates Inc.

Qualitative and quantitative analysis of companies has been conducted to help clients understand the wider business environment as well as the strengths and weaknesses of key market players. Data is qualitatively analyzed to categorize companies as pure play, category-focused, industry-focused, and diversified; it is quantitatively analyzed to categorize companies as dominant, leading, strong, tentative, and weak.

Segment Overview

The market research report provides comprehensive data (region-wise segment analysis), with forecasts and estimates in "USD billion " for the period 2024-2028, as well as historical data from 2018-2022 for the following segments.

  • Deployment Outlook
    • Cloud-based
    • Web-based
  • End-user Outlook 
    • Government
    • Real estate
    • Infrastructure companies
  • Geography Outlook 
    • North America
      • The U.S.
      • Canada
    • Europe
      • U.K.
      • Germany
      • France
      • Rest of Europe
    • APAC
      • China
      • India
    • South America
      • Chile
      • Argentina
      • Brazil
    • Middle East & Africa
      • Saudi Arabia
      • South Africa
      • Rest of the Middle East & Africa

You may also interested in the below market reports

Market Analyst Overview

Urban planning software plays a crucial role in managing and designing the built environment of cities and towns, catering to the needs of urban population growth and infrastructure development activities. These tools are essential for city planners in managing non-residential construction projects, housing, transportation, economic development, and sustainable communities. The compound annual growth rate of real estate and infrastructure companies is expected to increase significantly due to the new infrastructure initiative, driven by advancements in computers technology. The software market is witnessing the latest trends, including the integration of smart city technologies, data centers, and 5G technology, to enhance urban design projects. Components of urban planning software include both software and services. Software solutions offer features such as land use planning, transportation modeling, and economic analysis, while service offerings provide consulting and implementation support.

Furthermore, the capital-intensive nature of urban planning projects necessitates efficient tools for maintenance and construction activities. Government budgets and new infrastructure initiatives are significant drivers for the market. The software caters to various sectors, including residential and commercial buildings, and addresses economic disparity and urbanization challenges. Climate change and sustainable communities are also key considerations in urban planning, making the software an essential component of the built environment. Urban planners rely on these tools to create livable communities that balance economic development and infrastructure needs while addressing the challenges of urbanization and climate change. The market for urban planning software is expected to grow significantly in the coming years, offering numerous opportunities for developers and service providers.

Market Scope

Report Coverage

Details

Page number

163

Base year

2023

Historic period

2018 - 2022

Forecast period

2024-2028

Growth momentum & CAGR

Accelerate at a CAGR of 7.81%

Market growth 2024-2028

USD 4.05 billion

YoY growth 2023-2024(%)

7.24

Regional analysis

North America, Europe, APAC, South America, and Middle East and Africa

Performing market contribution

North America at 38%

Key countries

US, UK, Canada, China, and Germany

Competitive landscape

Leading Companies, Market Positioning of Companies, Competitive Strategies, and Industry Risks

Key companies profiled

3IXAM SOFTWARE LLC, AgiliCity d.o.o., Alphabet Inc., Autodesk Inc., Bentley Systems Inc., CityCAD Technologies Ltd., Esri Global Inc., Lumion, Nextsense, Sasaki Associates Inc., Savannah Simulations AG, Strategis Groep BV, Trimble Inc., UrbanFootprint Inc., UrbanSim Inc., and Urpla Pty Ltd.

Market dynamics

Parent market analysis, Market Forecasting, Market growth inducers and obstacles, Fast-growing and slow-growing segment analysis, Market growth and Forecasting, COVID 19 impact and recovery analysis and future consumer dynamics, Market condition analysis for market forecast period

Customization purview

If our report has not included the data that you are looking for, you can reach out to our analysts and get segments customized.

View PDF Sample

What are the Key Data Covered in this Market Report?

  • CAGR of the market during the forecast period
  • Detailed information on factors that will drive the market growth and forecasting of the market between 2024 and 2028
  • Precise estimation of the size of the market size and its contribution to the parent market
  • Accurate predictions about upcoming market trends and analysis and changes in consumer behavior
  • Growth of the market industry across Europe, North America, APAC, South America, and Middle East and Africa
  • Thorough market growth analysis of the market’s competitive landscape and detailed information about companies
  • Comprehensive market analysis and report on the factors that will challenge the market research and growth of market companies

We can help! Our analysts can customize this market research report to meet your requirements. 

Get in touch

1 Executive Summary

  • 1.1 Market overview
    • Executive Summary - Chart on Market Overview
    • Executive Summary - Data Table on Market Overview
    • Executive Summary - Chart on Global Market Characteristics
    • Executive Summary - Chart on Market by Geography
    • Executive Summary - Chart on Market Segmentation by Deployment
    • Executive Summary - Chart on Market Segmentation by End-user
    • Executive Summary - Chart on Incremental Growth
    • Executive Summary - Data Table on Incremental Growth
    • Executive Summary - Chart on Company Market Positioning

2 Market Landscape

  • 2.1 Market ecosystem
    • Parent Market
    • Data Table on - Parent Market
  • 2.2 Market characteristics
    • Market characteristics analysis
  • 2.3 Value chain analysis
    • Value Chain Analysis

3 Market Sizing

  • 3.1 Market definition
    • Offerings of companies included in the market definition
  • 3.2 Market segment analysis
    • Market segments
  • 3.3 Market size 2023
    • 3.4 Market outlook: Forecast for 2023-2028
      • Chart on Global - Market size and forecast 2023-2028 ($ million)
      • Data Table on Global - Market size and forecast 2023-2028 ($ million)
      • Chart on Global Market: Year-over-year growth 2023-2028 (%)
      • Data Table on Global Market: Year-over-year growth 2023-2028 (%)

    4 Historic Market Size

    • 4.1 Global Urban Planning Software Market 2018 - 2022
      • Historic Market Size - Data Table on Global Urban Planning Software Market 2018 - 2022 ($ million)
    • 4.2 Deployment segment analysis 2018 - 2022
      • Historic Market Size - Deployment Segment 2018 - 2022 ($ million)
    • 4.3 End-user segment analysis 2018 - 2022
      • Historic Market Size - End-user Segment 2018 - 2022 ($ million)
    • 4.4 Geography segment analysis 2018 - 2022
      • Historic Market Size - Geography Segment 2018 - 2022 ($ million)
    • 4.5 Country segment analysis 2018 - 2022
      • Historic Market Size - Country Segment 2018 - 2022 ($ million)

    5 Five Forces Analysis

    • 5.1 Five forces summary
      • Five forces analysis - Comparison between 2023 and 2028
    • 5.2 Bargaining power of buyers
      • Bargaining power of buyers - Impact of key factors 2023 and 2028
    • 5.3 Bargaining power of suppliers
      • Bargaining power of suppliers - Impact of key factors in 2023 and 2028
    • 5.4 Threat of new entrants
      • Threat of new entrants - Impact of key factors in 2023 and 2028
    • 5.5 Threat of substitutes
      • Threat of substitutes - Impact of key factors in 2023 and 2028
    • 5.6 Threat of rivalry
      • Threat of rivalry - Impact of key factors in 2023 and 2028
    • 5.7 Market condition
      • Chart on Market condition - Five forces 2023 and 2028

    6 Market Segmentation by Deployment

    • 6.1 Market segments
      • Chart on Deployment - Market share 2023-2028 (%)
      • Data Table on Deployment - Market share 2023-2028 (%)
    • 6.2 Comparison by Deployment
      • Chart on Comparison by Deployment
      • Data Table on Comparison by Deployment
    • 6.3 Cloud-based - Market size and forecast 2023-2028
      • Chart on Cloud-based - Market size and forecast 2023-2028 ($ million)
      • Data Table on Cloud-based - Market size and forecast 2023-2028 ($ million)
      • Chart on Cloud-based - Year-over-year growth 2023-2028 (%)
      • Data Table on Cloud-based - Year-over-year growth 2023-2028 (%)
    • 6.4 Web-based - Market size and forecast 2023-2028
      • Chart on Web-based - Market size and forecast 2023-2028 ($ million)
      • Data Table on Web-based - Market size and forecast 2023-2028 ($ million)
      • Chart on Web-based - Year-over-year growth 2023-2028 (%)
      • Data Table on Web-based - Year-over-year growth 2023-2028 (%)
    • 6.5 Market opportunity by Deployment
      • Market opportunity by Deployment ($ million)
      • Data Table on Market opportunity by Deployment ($ million)

    7 Market Segmentation by End-user

    • 7.1 Market segments
      • Chart on End-user - Market share 2023-2028 (%)
      • Data Table on End-user - Market share 2023-2028 (%)
    • 7.2 Comparison by End-user
      • Chart on Comparison by End-user
      • Data Table on Comparison by End-user
    • 7.3 Government - Market size and forecast 2023-2028
      • Chart on Government - Market size and forecast 2023-2028 ($ million)
      • Data Table on Government - Market size and forecast 2023-2028 ($ million)
      • Chart on Government - Year-over-year growth 2023-2028 (%)
      • Data Table on Government - Year-over-year growth 2023-2028 (%)
    • 7.4 Real estate and infrastructure companies - Market size and forecast 2023-2028
      • Chart on Real estate and infrastructure companies - Market size and forecast 2023-2028 ($ million)
      • Data Table on Real estate and infrastructure companies - Market size and forecast 2023-2028 ($ million)
      • Chart on Real estate and infrastructure companies - Year-over-year growth 2023-2028 (%)
      • Data Table on Real estate and infrastructure companies - Year-over-year growth 2023-2028 (%)
    • 7.5 Market opportunity by End-user
      • Market opportunity by End-user ($ million)
      • Data Table on Market opportunity by End-user ($ million)

    8 Customer Landscape

    • 8.1 Customer landscape overview
      • Analysis of price sensitivity, lifecycle, customer purchase basket, adoption rates, and purchase criteria

    9 Geographic Landscape

    • 9.1 Geographic segmentation
      • Chart on Market share by geography 2023-2028 (%)
      • Data Table on Market share by geography 2023-2028 (%)
    • 9.2 Geographic comparison
      • Chart on Geographic comparison
      • Data Table on Geographic comparison
    • 9.3 North America - Market size and forecast 2023-2028
      • Chart on North America - Market size and forecast 2023-2028 ($ million)
      • Data Table on North America - Market size and forecast 2023-2028 ($ million)
      • Chart on North America - Year-over-year growth 2023-2028 (%)
      • Data Table on North America - Year-over-year growth 2023-2028 (%)
    • 9.4 Europe - Market size and forecast 2023-2028
      • Chart on Europe - Market size and forecast 2023-2028 ($ million)
      • Data Table on Europe - Market size and forecast 2023-2028 ($ million)
      • Chart on Europe - Year-over-year growth 2023-2028 (%)
      • Data Table on Europe - Year-over-year growth 2023-2028 (%)
    • 9.5 APAC - Market size and forecast 2023-2028
      • Chart on APAC - Market size and forecast 2023-2028 ($ million)
      • Data Table on APAC - Market size and forecast 2023-2028 ($ million)
      • Chart on APAC - Year-over-year growth 2023-2028 (%)
      • Data Table on APAC - Year-over-year growth 2023-2028 (%)
    • 9.6 South America - Market size and forecast 2023-2028
      • Chart on South America - Market size and forecast 2023-2028 ($ million)
      • Data Table on South America - Market size and forecast 2023-2028 ($ million)
      • Chart on South America - Year-over-year growth 2023-2028 (%)
      • Data Table on South America - Year-over-year growth 2023-2028 (%)
    • 9.7 Middle East and Africa - Market size and forecast 2023-2028
      • Chart on Middle East and Africa - Market size and forecast 2023-2028 ($ million)
      • Data Table on Middle East and Africa - Market size and forecast 2023-2028 ($ million)
      • Chart on Middle East and Africa - Year-over-year growth 2023-2028 (%)
      • Data Table on Middle East and Africa - Year-over-year growth 2023-2028 (%)
    • 9.8 US - Market size and forecast 2023-2028
      • Chart on US - Market size and forecast 2023-2028 ($ million)
      • Data Table on US - Market size and forecast 2023-2028 ($ million)
      • Chart on US - Year-over-year growth 2023-2028 (%)
      • Data Table on US - Year-over-year growth 2023-2028 (%)
    • 9.9 UK - Market size and forecast 2023-2028
      • Chart on UK - Market size and forecast 2023-2028 ($ million)
      • Data Table on UK - Market size and forecast 2023-2028 ($ million)
      • Chart on UK - Year-over-year growth 2023-2028 (%)
      • Data Table on UK - Year-over-year growth 2023-2028 (%)
    • 9.10 Canada - Market size and forecast 2023-2028
      • Chart on Canada - Market size and forecast 2023-2028 ($ million)
      • Data Table on Canada - Market size and forecast 2023-2028 ($ million)
      • Chart on Canada - Year-over-year growth 2023-2028 (%)
      • Data Table on Canada - Year-over-year growth 2023-2028 (%)
    • 9.11 China - Market size and forecast 2023-2028
      • Chart on China - Market size and forecast 2023-2028 ($ million)
      • Data Table on China - Market size and forecast 2023-2028 ($ million)
      • Chart on China - Year-over-year growth 2023-2028 (%)
      • Data Table on China - Year-over-year growth 2023-2028 (%)
    • 9.12 Germany - Market size and forecast 2023-2028
      • Chart on Germany - Market size and forecast 2023-2028 ($ million)
      • Data Table on Germany - Market size and forecast 2023-2028 ($ million)
      • Chart on Germany - Year-over-year growth 2023-2028 (%)
      • Data Table on Germany - Year-over-year growth 2023-2028 (%)
    • 9.13 Market opportunity by geography
      • Market opportunity by geography ($ million)
      • Data Tables on Market opportunity by geography ($ million)

    10 Drivers, Challenges, and Opportunity/Restraints

    • 10.1 Market drivers
      • 10.2 Market challenges
        • 10.3 Impact of drivers and challenges
          • Impact of drivers and challenges in 2023 and 2028
        • 10.4 Market opportunities/restraints

          11 Competitive Landscape

          • 11.1 Overview
            • 11.2 Competitive Landscape
              • Overview on criticality of inputs and factors of differentiation
            • 11.3 Landscape disruption
              • Overview on factors of disruption
            • 11.4 Industry risks
              • Impact of key risks on business

            12 Competitive Analysis

            • 12.1 Companies profiled
              • Companies covered
            • 12.2 Market positioning of companies
              • Matrix on companies position and classification
            • 3IXAM SOFTWARE LLC
              • 3IXAM SOFTWARE LLC - Overview
              • 3IXAM SOFTWARE LLC - Product / Service
              • 3IXAM SOFTWARE LLC - Key offerings
            • 12.4 AgiliCity d.o.o.
              • AgiliCity d.o.o. - Overview
              • AgiliCity d.o.o. - Product / Service
              • AgiliCity d.o.o. - Key offerings
            • 12.5 Alphabet Inc.
              • Alphabet Inc. - Overview
              • Alphabet Inc. - Business segments
              • Alphabet Inc. - Key offerings
              • Alphabet Inc. - Segment focus
            • 12.6 Autodesk Inc.
              • Autodesk Inc. - Overview
              • Autodesk Inc. - Product / Service
              • Autodesk Inc. - Key news
              • Autodesk Inc. - Key offerings
            • 12.7 Bentley Systems Inc.
              • Bentley Systems Inc. - Overview
              • Bentley Systems Inc. - Product / Service
              • Bentley Systems Inc. - Key news
              • Bentley Systems Inc. - Key offerings
            • 12.8 CityCAD Technologies Ltd.
              • CityCAD Technologies Ltd. - Overview
              • CityCAD Technologies Ltd. - Product / Service
              • CityCAD Technologies Ltd. - Key offerings
            • 12.9 Esri Global Inc.
              • Esri Global Inc. - Overview
              • Esri Global Inc. - Product / Service
              • Esri Global Inc. - Key news
              • Esri Global Inc. - Key offerings
            • 12.10 Lumion
              • Lumion - Overview
              • Lumion - Product / Service
              • Lumion - Key offerings
            • 12.11 Nextsense
              • Nextsense - Overview
              • Nextsense - Product / Service
              • Nextsense - Key offerings
            • 12.12 Savannah Simulations AG
              • Savannah Simulations AG - Overview
              • Savannah Simulations AG - Product / Service
              • Savannah Simulations AG - Key offerings
            • 12.13 Strategis Groep BV
              • Strategis Groep BV - Overview
              • Strategis Groep BV - Product / Service
              • Strategis Groep BV - Key offerings
            • 12.14 Trimble Inc.
              • Trimble Inc. - Overview
              • Trimble Inc. - Business segments
              • Trimble Inc. - Key news
              • Trimble Inc. - Key offerings
              • Trimble Inc. - Segment focus
            • 12.15 UrbanFootprint Inc.
              • UrbanFootprint Inc. - Overview
              • UrbanFootprint Inc. - Product / Service
              • UrbanFootprint Inc. - Key offerings
            • 12.16 UrbanSim Inc.
              • UrbanSim Inc. - Overview
              • UrbanSim Inc. - Product / Service
              • UrbanSim Inc. - Key offerings
            • 12.17 Urpla Pty Ltd.
              • Urpla Pty Ltd. - Overview
              • Urpla Pty Ltd. - Product / Service
              • Urpla Pty Ltd. - Key offerings

            13 Appendix

            • 13.1 Scope of the report
              • 13.2 Inclusions and exclusions checklist
                • Inclusions checklist
                • Exclusions checklist
              • 13.3 Currency conversion rates for US$
                • Currency conversion rates for US$
              • 13.4 Research methodology
                • Research methodology
              • 13.5 Data procurement
                • Information sources
              • 13.6 Data validation
                • Data validation
              • 13.7 Validation techniques employed for market sizing
                • Validation techniques employed for market sizing
              • 13.8 Data synthesis
                • Data synthesis
              • 360 degree market analysis
                • 360 degree market analysis
              • 13.10 List of abbreviations
                • List of abbreviations

              Research Methodology

              Technavio presents a detailed picture of the market by way of study, synthesis, and summation of data from multiple sources. The analysts have presented the various facets of the market with a particular focus on identifying the key industry influencers. The data thus presented is comprehensive, reliable, and the result of extensive research, both primary and secondary.

              INFORMATION SOURCES

              Primary sources

              • Manufacturers and suppliers
              • Channel partners
              • Industry experts
              • Strategic decision makers

              Secondary sources

              • Industry journals and periodicals
              • Government data
              • Financial reports of key industry players
              • Historical data
              • Press releases

              DATA ANALYSIS

              Data Synthesis

              • Collation of data
              • Estimation of key figures
              • Analysis of derived insights

              Data Validation

              • Triangulation with data models
              • Reference against proprietary databases
              • Corroboration with industry experts

              REPORT WRITING

              Qualitative

              • Market drivers
              • Market challenges
              • Market trends
              • Five forces analysis

              Quantitative

              • Market size and forecast
              • Market segmentation
              • Geographical insights
              • Competitive landscape

              Interested in this report?

              Get your sample now to see our research methodology and insights!

              Download Now

              Frequently Asked Questions

              Urban Planning Software market growth will increase by $ 4055.7 mn during 2024-2028 .

              The Urban Planning Software market is expected to grow at a CAGR of 7.81% during 2024-2028 .

              Urban Planning Software market is segmented by Deployment( Cloud-based, Web-based) End-user( Government, Real estate and infrastructure companies, infrastructure companies)

              3IXAM SOFTWARE LLC, AgiliCity d.o.o., Alphabet Inc., Autodesk Inc., Bentley Systems Inc., CityCAD Technologies Ltd., Esri Global Inc., Lumion, Nextsense, Sasaki Associates Inc., Savannah Simulations AG, Strategis Groep BV, Trimble Inc., UrbanFootprint Inc., UrbanSim Inc., Urpla Pty Ltd. are a few of the key vendors in the Urban Planning Software market.

              North America will register the highest growth rate of 38% among the other regions. Therefore, the Urban Planning Software market in North America is expected to garner significant business opportunities for the vendors during the forecast period.

              US, UK, Canada, China, Germany

              • Increased investment in infrastructure projectsThe demand for urban planning software is growing due to the increasing investment in infrastructure projects across the world. For instance is the driving factor this market.
              • the Government of India is the driving factor this market.
              • in its FY2023 budget is the driving factor this market.
              • announced significant funds for several infrastructure development projects in the country is the driving factor this market.
              • including industrial corridors is the driving factor this market.
              • the Dedicated Freight Corridor is the driving factor this market.
              • the Bharatmala Pariyojana is the driving factor this market.
              • the Sagarmala Programme is the driving factor this market.
              • and the UDAN schemes that focus on improving connectivity. In 2020 is the driving factor this market.
              • the Indian Government allocated a sum of $8.58 billion for the implementation of the Odisha Economic Corridor Project. The cities were selected to have six clusters in the industrial areas of Gopalpur is the driving factor this market.
              • Bhubaneswar is the driving factor this market.
              • Kalinganagar is the driving factor this market.
              • and eight clusters in the Paradip is the driving factor this market.
              • Kendrapada is the driving factor this market.
              • Dhamra is the driving factor this market.
              • and Subarnarekha. Similarly is the driving factor this market.
              • for instance is the driving factor this market.
              • the M6 Motorway Expansion project involves the expansion of the 23km M6 Motorway in Southern Sydney is the driving factor this market.
              • New South Wales is the driving factor this market.
              • Australia. The construction work started in Q4 2021 and is expected to be completed in Q4 2025. The worth of the road development project was estimated at approximately $7 is the driving factor this market.
              • 850 million. Moreover is the driving factor this market.
              • the Sarawak-Sabah Link Road project in Malaysia entails the construction of a 425 km road connecting Sarawak and Sabah. The construction work began in Q4 2021 and is expected to be completed in Q4 2026. Thus is the driving factor this market.
              • the spending on such capital-intensive projects and infrastructure development is expected to grow significantly in the next decade is the driving factor this market.
              • which will augment the need for urban planning software for planning and design layout is the driving factor this market.
              • thereby driving the growth of the global urban planning software market during the forecast period. is the driving factor this market.

              The Urban Planning Software market vendors should focus on grabbing business opportunities from the Cloud-based segment as it accounted for the largest market share in the base year.