Architectural Rendering Software Market Analysis, Size, and Forecast 2026-2030: North America (US, Canada, and Mexico), Europe (Germany, France, and UK), APAC (China, Japan, and South Korea), Middle East and Africa (Saudi Arabia, UAE, and South Africa), South America (Brazil and Argentina), and Rest of World (ROW)

Architectural Rendering Software Market Analysis, Size, and Forecast 2026-2030:
North America (US, Canada, and Mexico), Europe (Germany, France, and UK), APAC (China, Japan, and South Korea), Middle East and Africa (Saudi Arabia, UAE, and South Africa), South America (Brazil and Argentina), and Rest of World (ROW)

Published: Mar 2026 295 Pages SKU: IRTNTR45462

Market Overview at a Glance

$2.77 B
Market Opportunity
22.3%
CAGR 2025 - 2030
36%
North America Growth
$840.6 Mn
Non-residential segment 2024

Architectural Rendering Software Market Size 2026-2030

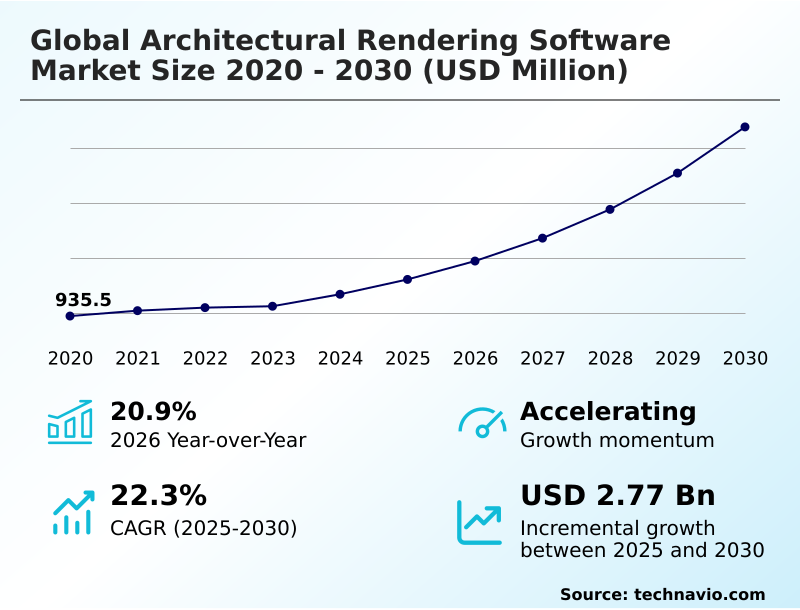
The architectural rendering software market size is valued to increase by USD 2.77 billion, at a CAGR of 22.3% from 2025 to 2030. Imperative for photorealistic visualization in project lifecycle management will drive the architectural rendering software market.

Major Market Trends & Insights

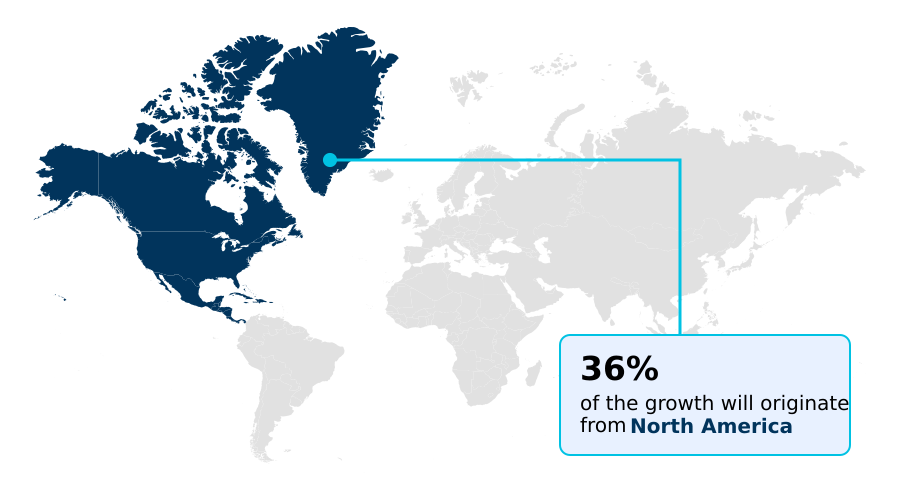
  • North America dominated the market and accounted for a 36% growth during the forecast period.
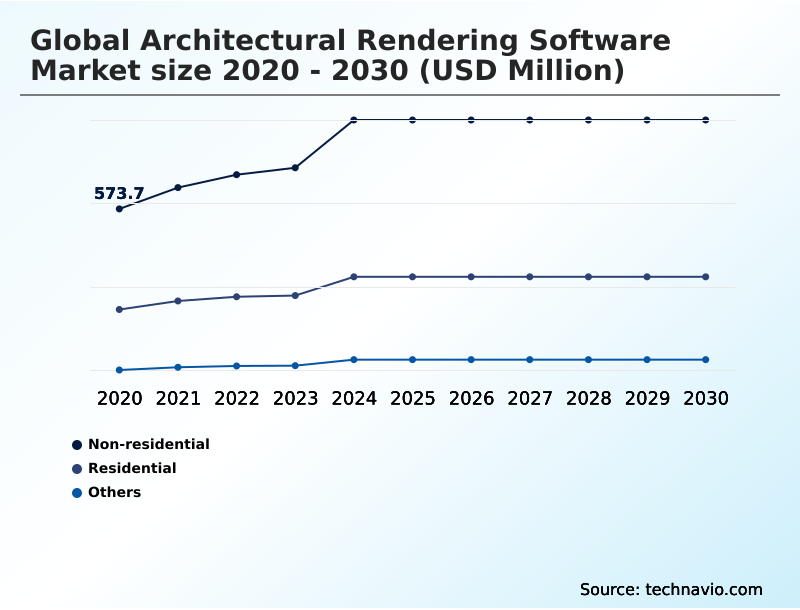
  • By Application - Non-residential segment was valued at USD 840.6 million in 2024
  • By Deployment - On-premises segment accounted for the largest market revenue share in 2024

Market Size & Forecast

  • Market Opportunities: USD 3.44 billion
  • Market Future Opportunities: USD 2.77 billion
  • CAGR from 2025 to 2030 : 22.3%

Market Summary

  • The architectural rendering software market is undergoing significant transformation, driven by the escalating demand for high-fidelity visualization tools in the architecture, engineering, and construction (AEC) industry. This demand extends beyond aesthetic enhancement to become a fundamental business necessity for design validation, stakeholder communication, and marketing.
  • Key drivers include the widespread adoption of Building Information Modeling (BIM), which necessitates seamless workflow integration between design and visualization platforms. The convergence of real-time rendering capabilities with immersive technologies like virtual reality (VR) and augmented reality (AR) is reshaping design workflows, enabling interactive exploration and collaborative reviews.
  • A common business scenario involves an architectural firm using VR walkthroughs to allow clients to experience a proposed commercial space, leading to faster design approvals and a reduction in late-stage changes. However, the market faces challenges from the substantial costs of software and high-performance hardware, as well as a persistent shortage of skilled professionals proficient in these complex tools.
  • The shift towards cloud-based platforms and subscription models is helping to democratize access, but competition is intensifying from integrated real-time solutions that prioritize speed and ease of use for day-to-day design tasks.

What will be the Size of the Architectural Rendering Software Market during the forecast period?

Get Key Insights on Market Forecast (PDF) Request Free Sample

How is the Architectural Rendering Software Market Segmented?

The architectural rendering software industry research report provides comprehensive data (region-wise segment analysis), with forecasts and estimates in "USD million" for the period 2026-2030, as well as historical data from 2020-2024 for the following segments.

  • Application
    • Non-residential
    • Residential
    • Others
  • Deployment
    • On-premises
    • Cloud
  • Component
    • Software
    • Services
  • Geography
    • North America
      • US
      • Canada
      • Mexico
    • Europe
      • Germany
      • France
      • UK
    • APAC
      • China
      • Japan
      • South Korea
    • Middle East and Africa
      • Saudi Arabia
      • UAE
      • South Africa
    • South America
      • Brazil
      • Argentina
    • Rest of World (ROW)

By Application Insights

The non-residential segment is estimated to witness significant growth during the forecast period.

The non-residential segment is foundational to the architectural rendering software market, driven by the complexity and high financial stakes of commercial, industrial, and public infrastructure projects.

Clear, compelling communication is paramount among diverse stakeholders, where photorealistic visualization acts as a universal language. This segment heavily relies on a data-centric methodology for design validation and proactive error detection, using tools for environmental simulation and performance simulation.

Integrating these visualizations with Building Information Modeling (BIM) is crucial, ensuring data integrity and improving workflow integration. For example, firms using virtual design and construction (VDC) have reported a reduction in on-site rework by over 15%, showcasing the tangible ROI.

The demand is for solutions that facilitate stakeholder communication across the entire project lifecycle management.

Request Free Sample

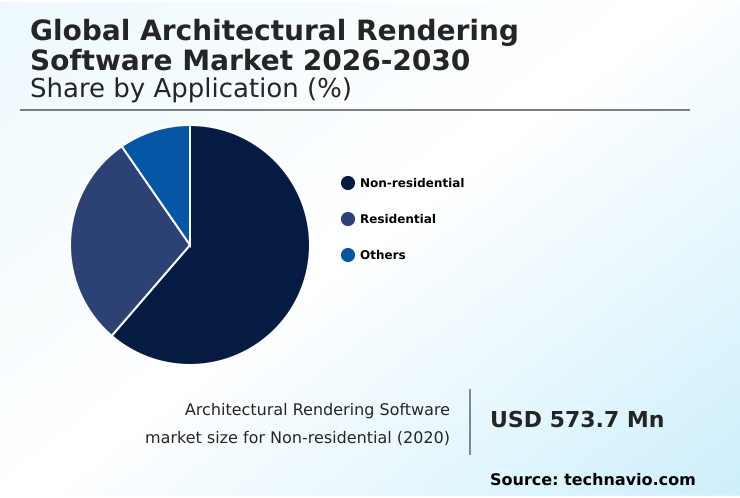
The Non-residential segment was valued at USD 840.6 million in 2024 and showed a gradual increase during the forecast period.

Request Free Sample

Regional Analysis

North America is estimated to contribute 36% to the growth of the global market during the forecast period.Technavio’s analysts have elaborately explained the regional trends and drivers that shape the market during the forecast period.

See How Architectural Rendering Software Market Demand is Rising in North America Request Free Sample

The geographic landscape of the architectural rendering software market is characterized by mature, technologically advanced markets in North America and Europe, alongside rapidly expanding markets in APAC.

North America is expected to contribute approximately 36.0% of the market's incremental growth, driven by high adoption rates of cutting-edge technologies and stringent BIM integration requirements. In contrast, the APAC region's growth is fueled by massive urbanization and infrastructure investment.

Across regions, the adoption of cloud-based platforms is a unifying trend, democratizing access to powerful tools for 3D visualization and enabling cinematic animations.

For instance, firms in Europe leveraging advanced lighting simulation for sustainable design mandates have improved compliance reporting efficiency by over 20%.

The use of real-time rendering and virtual reality (VR) is prominent globally, enhancing design validation and client engagement from Toronto to Telosa.

Market Dynamics

Our researchers analyzed the data with 2025 as the base year, along with the key drivers, trends, and challenges. A holistic analysis of drivers will help companies refine their marketing strategies to gain a competitive advantage.

  • Strategic decisions within the architectural rendering software market increasingly hinge on detailed comparisons of real-time rendering vs offline rendering, with firms evaluating the trade-offs between speed and ultimate photorealistic quality. The efficiency of BIM to rendering workflow integration is a critical factor, as seamless data transfer is paramount for large-scale projects.
  • The rise of cloud rendering for small studios has democratized access to high-performance computing, leveling the competitive landscape. Use cases such as virtual reality architectural walkthroughs are now essential for client engagement and are a key differentiator. The application of generative AI in conceptual design is accelerating ideation, allowing architects to explore numerous options rapidly.
  • Furthermore, using AR for construction verification provides tangible on-site benefits, reducing errors. Architectural rendering for real estate marketing remains a primary driver, where high-quality visuals directly impact sales velocity. Firms that leverage environmental analysis visualization tools find that data-driven design decisions are made twice as fast compared to traditional methods.
  • The development of AI for architectural scene population automates tedious tasks, freeing up artists to focus on creativity. The benefits of SaaS in architectural software include predictable costs and continuous updates, contrasting with the high upfront cost of on-premise render farms. Addressing the skills gap in architectural visualization is crucial for firms to fully exploit these technologies.
  • Ultimately, from photorealistic rendering for project approval to interactive 3D architectural presentations and lighting simulation for sustainable design, the market is evolving toward more integrated and intelligent solutions.

What are the key market drivers leading to the rise in the adoption of Architectural Rendering Software Industry?

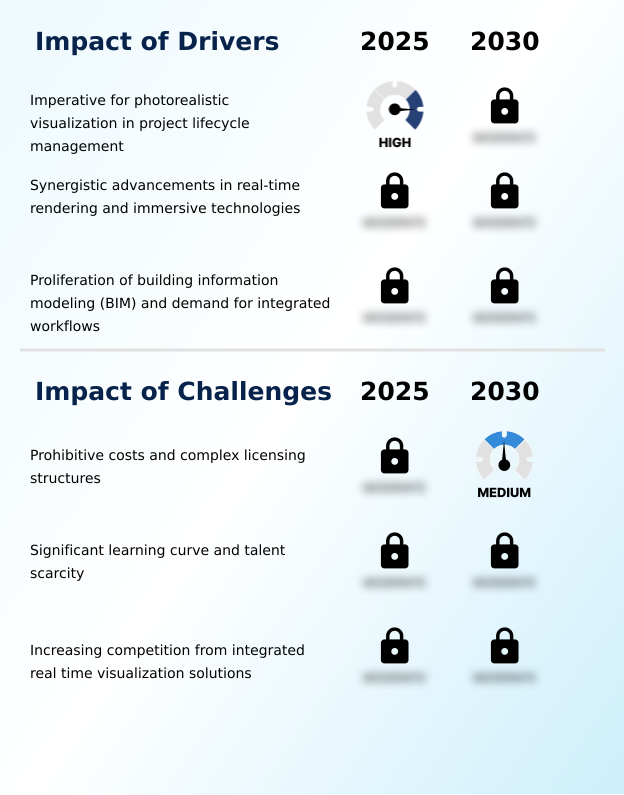
  • The imperative for photorealistic visualization throughout the project lifecycle management acts as a key driver for market expansion.

  • The escalating demand for photorealistic visualization across the entire project lifecycle is a primary market driver.
  • This has become a business necessity for communicating concepts and securing client buy-in, with high-quality renderings shown to improve project approval rates by up to 30%.
  • A second powerful driver is the convergence of real-time rendering with immersive technologies like virtual reality (VR) and augmented reality (AR), which accelerate the design cycle.
  • The integration of this capability with VR offers true one-to-one scale immersion, while AR aids in construction verification. The widespread adoption of building information modeling (BIM) is a third critical driver.
  • Seamless BIM integration is paramount, with synchronized workflows reducing data management errors by over 25% and enhancing stakeholder communication through accurate, compelling visual narratives.

What are the market trends shaping the Architectural Rendering Software Industry?

  • The integration of artificial intelligence and generative processes is emerging as a defining market trend. This is transforming visualization workflows from passive tools into intelligent design partners.

  • A defining trend is the profound integration of artificial intelligence into visualization workflows, transforming software into an intelligent partner. AI-driven algorithms automate laborious tasks like populating scenes, with some systems reducing content creation time by up to 60%. Advanced models can generate physically accurate materials from simple text prompts, accelerating the design iteration cycle.
  • Beyond automation, generative processes and generative AI are becoming powerful forces in conceptual design, enabling architects to explore a broader solution space. This symbiotic relationship between human creativity and machine intelligence is fostering new design methodologies. AI-powered denoising is another key advancement, producing clean images from partial renders 75% faster than traditional methods, allowing for more interactive design sessions.
  • This shift positions the software as a central intelligence hub for 3D modeling and data-rich visualization.

What challenges does the Architectural Rendering Software Industry face during its growth?

  • Prohibitive costs associated with software acquisition and hardware, combined with complex licensing structures, present a key challenge to industry growth.

  • A primary market challenge is the substantial financial outlay for software and high-performance hardware, with total ownership costs for on-premise solutions being up to three times higher than cloud-based alternatives over a five-year period. This creates a significant barrier for smaller firms. Another formidable challenge is the steep learning curve and scarcity of skilled professionals.
  • Firms report that it can take over 200 hours of dedicated training for an architect to master advanced digital asset libraries and procedural modeling techniques. This skills gap drives up labor costs and leads many to outsource visualization needs. Finally, the market faces a challenge from integrated real-time visualization solutions, which prioritize speed and workflow integration.
  • These 'good enough' quality tools are capturing a significant portion of day-to-day visualization tasks, forcing traditional rendering software companies to further differentiate on realism.

Exclusive Technavio Analysis on Customer Landscape

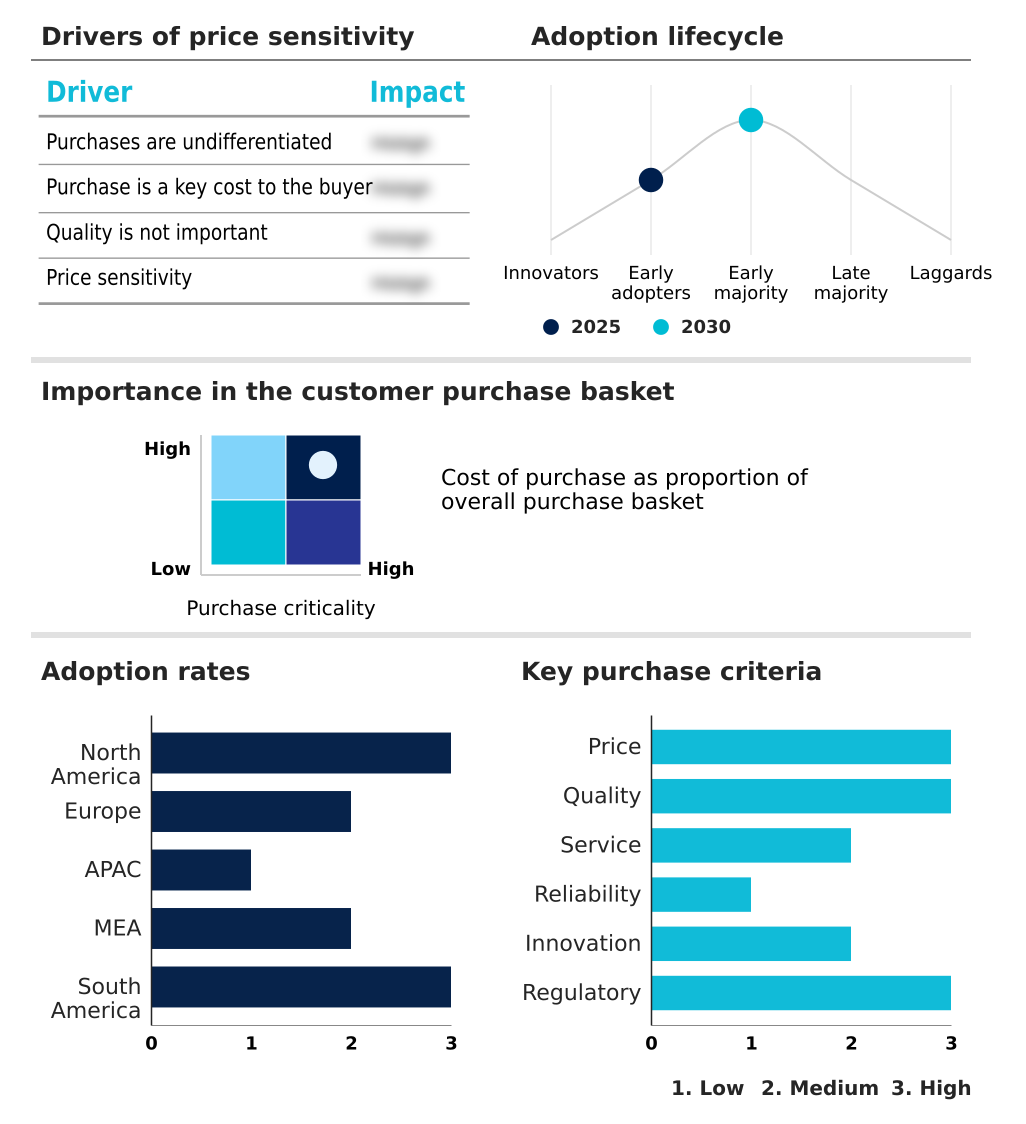
The architectural rendering software market forecasting report includes the adoption lifecycle of the market, covering from the innovator’s stage to the laggard’s stage. It focuses on adoption rates in different regions based on penetration. Furthermore, the architectural rendering software market report also includes key purchase criteria and drivers of price sensitivity to help companies evaluate and develop their market growth analysis strategies.

Customer Landscape of Architectural Rendering Software Industry

Competitive Landscape

Companies are implementing various strategies, such as strategic alliances, architectural rendering software market forecast, partnerships, mergers and acquisitions, geographical expansion, and product/service launches, to enhance their presence in the industry.

Applet 3D - The company provides cloud-based 3D visualization and interactive presentation tools designed to enhance architectural communication and enable virtual staging for real estate development.

The industry research and growth report includes detailed analyses of the competitive landscape of the market and information about key companies, including:

  • Applet 3D
  • ArchiVinci
  • Blender Foundation
  • Chaos Software GmbH
  • Daz Productions Inc.
  • Epic Games Inc.
  • KeyShot Inc.
  • Lumion
  • MyArchitectAI
  • Next Limit SL
  • NVIDIA Corp.
  • RealSpace Vision Communication
  • Robert McNeel and Associates
  • Shapespark sp. Zoo
  • Side Effects Software Inc.
  • Snaptrude Inc.
  • Trimble Inc.
  • ZOA Studio

Qualitative and quantitative analysis of companies has been conducted to help clients understand the wider business environment as well as the strengths and weaknesses of key industry players. Data is qualitatively analyzed to categorize companies as pure play, category-focused, industry-focused, and diversified; it is quantitatively analyzed to categorize companies as dominant, leading, strong, tentative, and weak.

Recent Development and News in Architectural rendering software market

  • In August 2025, Chaos introduced Envision, a beta tool designed to simplify the creation of high-quality architectural animations and integrate with existing real-time rendering workflows like Enscape, making storytelling more accessible for architects.
  • In October 2025, D5 Render gained prominence for its effective use of real-time ray tracing technology, which allows for the instantaneous generation of photorealistic images and animations, significantly accelerating the design iteration cycle.
  • In March 2025, the Italian Ministry of Culture launched a government-funded program to create hyper-realistic, historically accurate digital archives of significant cultural heritage sites, including Pompeii, using advanced rendering and photogrammetry software.
  • In May 2025, developers of the NEOM project in Saudi Arabia announced NEOM Synapse, a proprietary, real-time, city-scale digital twin platform, requiring all architectural and engineering partners to deliver dynamic, data-rich models for integrated simulation.

Dive into Technavio’s robust research methodology, blending expert interviews, extensive data synthesis, and validated models for unparalleled Architectural Rendering Software Market insights. See full methodology.

Market Scope
Page number 295
Base year 2025
Historic period 2020-2024
Forecast period 2026-2030
Growth momentum & CAGR Accelerate at a CAGR of 22.3%
Market growth 2026-2030 USD 2772.8 million
Market structure Fragmented
YoY growth 2025-2026(%) 20.9%
Key countries US, Canada, Mexico, Germany, France, UK, Italy, Spain, The Netherlands, China, Japan, South Korea, India, Australia, Indonesia, Saudi Arabia, UAE, South Africa, Egypt, Kuwait, Brazil, Argentina and Chile
Competitive landscape Leading Companies, Market Positioning of Companies, Competitive Strategies, and Industry Risks

Request Free Sample

Research Analyst Overview

  • The architectural rendering software market is defined by a relentless push for realism and workflow efficiency. The core technology is evolving from a visualization tool to an analytical partner, driven by advancements in photorealistic visualization and real-time rendering.
  • This shift is compelling firms to make strategic boardroom decisions regarding investment in talent versus technology, especially with the rise of generative AI and procedural modeling which automate complex tasks like scene composition. Integration with a building information modeling (BIM) data-centric methodology is no longer optional but a baseline requirement, with tools for environmental simulation and performance simulation becoming standard.
  • The hardware dependency on powerful GPUs for techniques like global illumination and texture mapping remains a key consideration. A pivotal development is the effectiveness of AI-powered denoising, which has been shown to boost artist productivity by over 50% in certain workflows by drastically reducing the time needed to produce clean final images.
  • Technologies such as augmented reality (AR) and virtual home staging are expanding the software's application beyond design into sales and construction verification.

What are the Key Data Covered in this Architectural Rendering Software Market Research and Growth Report?

  • What is the expected growth of the Architectural Rendering Software Market between 2026 and 2030?

    • USD 2.77 billion, at a CAGR of 22.3%

  • What segmentation does the market report cover?

    • The report is segmented by Application (Non-residential, Residential, and Others), Deployment (On-premises, and Cloud), Component (Software, and Services) and Geography (North America, Europe, APAC, Middle East and Africa, South America)

  • Which regions are analyzed in the report?

    • North America, Europe, APAC, Middle East and Africa and South America

  • What are the key growth drivers and market challenges?

    • Imperative for photorealistic visualization in project lifecycle management, Prohibitive costs and complex licensing structures

  • Who are the major players in the Architectural Rendering Software Market?

    • Applet 3D, ArchiVinci, Blender Foundation, Chaos Software GmbH, Daz Productions Inc., Epic Games Inc., KeyShot Inc., Lumion, MyArchitectAI, Next Limit SL, NVIDIA Corp., RealSpace Vision Communication, Robert McNeel and Associates, Shapespark sp. Zoo, Side Effects Software Inc., Snaptrude Inc., Trimble Inc. and ZOA Studio

Market Research Insights

  • Market dynamics are increasingly shaped by the need for efficiency and advanced communication, where immersive experiences are becoming standard. Firms leveraging collaborative platforms report project approval times shortening by as much as 30% compared to traditional methods.
  • The move toward SaaS ecosystems is not only a financial shift but also an operational one, enhancing the design iteration cycle and enabling remote work. This digital transformation is critical, as integrated BIM to rendering workflows have demonstrated a capacity to reduce data-related errors by over 25%.
  • The focus on data-rich visualization supports better stakeholder communication and decision-making throughout the project lifecycle management, solidifying the software's role as an indispensable tool.

We can help! Our analysts can customize this architectural rendering software market research report to meet your requirements.

Get in touch

1. Executive Summary

1.1 Market overview

Executive Summary - Chart on Market Overview
Executive Summary - Data Table on Market Overview
Executive Summary - Chart on Global Market Characteristics
Executive Summary - Chart on Market by Geography
Executive Summary - Chart on Market Segmentation by Application
Executive Summary - Chart on Market Segmentation by Deployment
Executive Summary - Chart on Market Segmentation by Component
Executive Summary - Chart on Incremental Growth
Executive Summary - Data Table on Incremental Growth
Executive Summary - Chart on Company Market Positioning

2. Technavio Analysis

2.1 Analysis of price sensitivity, lifecycle, customer purchase basket, adoption rates, and purchase criteria

2.2 Criticality of inputs and Factors of differentiation

Chart on Overview on criticality of inputs and factors of differentiation

2.3 Factors of disruption

Chart on Overview on factors of disruption

2.4 Impact of drivers and challenges

Chart on Impact of drivers and challenges in 2025 and 2030

3. Market Landscape

3.1 Market ecosystem

Chart on Parent Market
Data Table on - Parent Market

3.2 Market characteristics

Chart on Market characteristics analysis

3.3 Value chain analysis

Chart on Value chain analysis

4. Market Sizing

4.1 Market definition

Data Table on Offerings of companies included in the market definition

4.2 Market segment analysis

Market segments

4.3 Market size 2025

4.4 Market outlook: Forecast for 2025-2030

Chart on Global - Market size and forecast 2025-2030 ($ million)
Data Table on Global - Market size and forecast 2025-2030 ($ million)
Chart on Global Market: Year-over-year growth 2025-2030 (%)
Data Table on Global Market: Year-over-year growth 2025-2030 (%)

5. Historic Market Size

5.1 Global Architectural Rendering Software Market 2020 - 2024

Historic Market Size - Data Table on Global Architectural Rendering Software Market 2020 - 2024 ($ million)

5.2 Application segment analysis 2020 - 2024

Historic Market Size - Application Segment 2020 - 2024 ($ million)

5.3 Deployment segment analysis 2020 - 2024

Historic Market Size - Deployment Segment 2020 - 2024 ($ million)

5.4 Component segment analysis 2020 - 2024

Historic Market Size - Component Segment 2020 - 2024 ($ million)

5.5 Geography segment analysis 2020 - 2024

Historic Market Size - Geography Segment 2020 - 2024 ($ million)

5.6 Country segment analysis 2020 - 2024

Historic Market Size - Country Segment 2020 - 2024 ($ million)

6. Qualitative Analysis

6.1 The impact of AI on global architectural rendering software market

7. Five Forces Analysis

7.1 Five forces summary

Five forces analysis - Comparison between 2025 and 2030

7.2 Bargaining power of buyers

Bargaining power of buyers - Impact of key factors 2025 and 2030

7.3 Bargaining power of suppliers

Bargaining power of suppliers - Impact of key factors in 2025 and 2030

7.4 Threat of new entrants

Threat of new entrants - Impact of key factors in 2025 and 2030

7.5 Threat of substitutes

Threat of substitutes - Impact of key factors in 2025 and 2030

7.6 Threat of rivalry

Threat of rivalry - Impact of key factors in 2025 and 2030

7.7 Market condition

Chart on Market condition - Five forces 2025 and 2030

8. Market Segmentation by Application

8.1 Market segments

Chart on Application - Market share 2025-2030 (%)
Data Table on Application - Market share 2025-2030 (%)

8.2 Comparison by Application

Chart on Comparison by Application
Data Table on Comparison by Application

8.3 Non-residential - Market size and forecast 2025-2030

Chart on Non-residential - Market size and forecast 2025-2030 ($ million)
Data Table on Non-residential - Market size and forecast 2025-2030 ($ million)
Chart on Non-residential - Year-over-year growth 2025-2030 (%)
Data Table on Non-residential - Year-over-year growth 2025-2030 (%)

8.4 Residential - Market size and forecast 2025-2030

Chart on Residential - Market size and forecast 2025-2030 ($ million)
Data Table on Residential - Market size and forecast 2025-2030 ($ million)
Chart on Residential - Year-over-year growth 2025-2030 (%)
Data Table on Residential - Year-over-year growth 2025-2030 (%)

8.5 Others - Market size and forecast 2025-2030

Chart on Others - Market size and forecast 2025-2030 ($ million)
Data Table on Others - Market size and forecast 2025-2030 ($ million)
Chart on Others - Year-over-year growth 2025-2030 (%)
Data Table on Others - Year-over-year growth 2025-2030 (%)

8.6 Market opportunity by Application

Market opportunity by Application ($ million)
Data Table on Market opportunity by Application ($ million)

9. Market Segmentation by Deployment

9.1 Market segments

Chart on Deployment - Market share 2025-2030 (%)
Data Table on Deployment - Market share 2025-2030 (%)

9.2 Comparison by Deployment

Chart on Comparison by Deployment
Data Table on Comparison by Deployment

9.3 On-premises - Market size and forecast 2025-2030

Chart on On-premises - Market size and forecast 2025-2030 ($ million)
Data Table on On-premises - Market size and forecast 2025-2030 ($ million)
Chart on On-premises - Year-over-year growth 2025-2030 (%)
Data Table on On-premises - Year-over-year growth 2025-2030 (%)

9.4 Cloud - Market size and forecast 2025-2030

Chart on Cloud - Market size and forecast 2025-2030 ($ million)
Data Table on Cloud - Market size and forecast 2025-2030 ($ million)
Chart on Cloud - Year-over-year growth 2025-2030 (%)
Data Table on Cloud - Year-over-year growth 2025-2030 (%)

9.5 Market opportunity by Deployment

Market opportunity by Deployment ($ million)
Data Table on Market opportunity by Deployment ($ million)

10. Market Segmentation by Component

10.1 Market segments

Chart on Component - Market share 2025-2030 (%)
Data Table on Component - Market share 2025-2030 (%)

10.2 Comparison by Component

Chart on Comparison by Component
Data Table on Comparison by Component

10.3 Software - Market size and forecast 2025-2030

Chart on Software - Market size and forecast 2025-2030 ($ million)
Data Table on Software - Market size and forecast 2025-2030 ($ million)
Chart on Software - Year-over-year growth 2025-2030 (%)
Data Table on Software - Year-over-year growth 2025-2030 (%)

10.4 Services - Market size and forecast 2025-2030

Chart on Services - Market size and forecast 2025-2030 ($ million)
Data Table on Services - Market size and forecast 2025-2030 ($ million)
Chart on Services - Year-over-year growth 2025-2030 (%)
Data Table on Services - Year-over-year growth 2025-2030 (%)

10.5 Market opportunity by Component

Market opportunity by Component ($ million)
Data Table on Market opportunity by Component ($ million)

11. Customer Landscape

11.1 Customer landscape overview

Analysis of price sensitivity, lifecycle, customer purchase basket, adoption rates, and purchase criteria

12. Geographic Landscape

12.1 Geographic segmentation

Chart on Market share by geography 2025-2030 (%)
Data Table on Market share by geography 2025-2030 (%)

12.2 Geographic comparison

Chart on Geographic comparison
Data Table on Geographic comparison

12.3 North America - Market size and forecast 2025-2030

Chart on North America - Market size and forecast 2025-2030 ($ million)
Data Table on North America - Market size and forecast 2025-2030 ($ million)
Chart on North America - Year-over-year growth 2025-2030 (%)
Data Table on North America - Year-over-year growth 2025-2030 (%)
Chart on Regional Comparison - North America
Data Table on Regional Comparison - North America

12.3.1 US - Market size and forecast 2025-2030

Chart on US - Market size and forecast 2025-2030 ($ million)
Data Table on US - Market size and forecast 2025-2030 ($ million)
Chart on US - Year-over-year growth 2025-2030 (%)
Data Table on US - Year-over-year growth 2025-2030 (%)

12.3.2 Canada - Market size and forecast 2025-2030

Chart on Canada - Market size and forecast 2025-2030 ($ million)
Data Table on Canada - Market size and forecast 2025-2030 ($ million)
Chart on Canada - Year-over-year growth 2025-2030 (%)
Data Table on Canada - Year-over-year growth 2025-2030 (%)

12.3.3 Mexico - Market size and forecast 2025-2030

Chart on Mexico - Market size and forecast 2025-2030 ($ million)
Data Table on Mexico - Market size and forecast 2025-2030 ($ million)
Chart on Mexico - Year-over-year growth 2025-2030 (%)
Data Table on Mexico - Year-over-year growth 2025-2030 (%)

12.4 Europe - Market size and forecast 2025-2030

Chart on Europe - Market size and forecast 2025-2030 ($ million)
Data Table on Europe - Market size and forecast 2025-2030 ($ million)
Chart on Europe - Year-over-year growth 2025-2030 (%)
Data Table on Europe - Year-over-year growth 2025-2030 (%)
Chart on Regional Comparison - Europe
Data Table on Regional Comparison - Europe

12.4.1 Germany - Market size and forecast 2025-2030

Chart on Germany - Market size and forecast 2025-2030 ($ million)
Data Table on Germany - Market size and forecast 2025-2030 ($ million)
Chart on Germany - Year-over-year growth 2025-2030 (%)
Data Table on Germany - Year-over-year growth 2025-2030 (%)

12.4.2 France - Market size and forecast 2025-2030

Chart on France - Market size and forecast 2025-2030 ($ million)
Data Table on France - Market size and forecast 2025-2030 ($ million)
Chart on France - Year-over-year growth 2025-2030 (%)
Data Table on France - Year-over-year growth 2025-2030 (%)

12.4.3 UK - Market size and forecast 2025-2030

Chart on UK - Market size and forecast 2025-2030 ($ million)
Data Table on UK - Market size and forecast 2025-2030 ($ million)
Chart on UK - Year-over-year growth 2025-2030 (%)
Data Table on UK - Year-over-year growth 2025-2030 (%)

12.4.4 Italy - Market size and forecast 2025-2030

Chart on Italy - Market size and forecast 2025-2030 ($ million)
Data Table on Italy - Market size and forecast 2025-2030 ($ million)
Chart on Italy - Year-over-year growth 2025-2030 (%)
Data Table on Italy - Year-over-year growth 2025-2030 (%)

12.4.5 Spain - Market size and forecast 2025-2030

Chart on Spain - Market size and forecast 2025-2030 ($ million)
Data Table on Spain - Market size and forecast 2025-2030 ($ million)
Chart on Spain - Year-over-year growth 2025-2030 (%)
Data Table on Spain - Year-over-year growth 2025-2030 (%)

12.4.6 The Netherlands - Market size and forecast 2025-2030

Chart on The Netherlands - Market size and forecast 2025-2030 ($ million)
Data Table on The Netherlands - Market size and forecast 2025-2030 ($ million)
Chart on The Netherlands - Year-over-year growth 2025-2030 (%)
Data Table on The Netherlands - Year-over-year growth 2025-2030 (%)

12.5 APAC - Market size and forecast 2025-2030

Chart on APAC - Market size and forecast 2025-2030 ($ million)
Data Table on APAC - Market size and forecast 2025-2030 ($ million)
Chart on APAC - Year-over-year growth 2025-2030 (%)
Data Table on APAC - Year-over-year growth 2025-2030 (%)
Chart on Regional Comparison - APAC
Data Table on Regional Comparison - APAC

12.5.1 China - Market size and forecast 2025-2030

Chart on China - Market size and forecast 2025-2030 ($ million)
Data Table on China - Market size and forecast 2025-2030 ($ million)
Chart on China - Year-over-year growth 2025-2030 (%)
Data Table on China - Year-over-year growth 2025-2030 (%)

12.5.2 Japan - Market size and forecast 2025-2030

Chart on Japan - Market size and forecast 2025-2030 ($ million)
Data Table on Japan - Market size and forecast 2025-2030 ($ million)
Chart on Japan - Year-over-year growth 2025-2030 (%)
Data Table on Japan - Year-over-year growth 2025-2030 (%)

12.5.3 South Korea - Market size and forecast 2025-2030

Chart on South Korea - Market size and forecast 2025-2030 ($ million)
Data Table on South Korea - Market size and forecast 2025-2030 ($ million)
Chart on South Korea - Year-over-year growth 2025-2030 (%)
Data Table on South Korea - Year-over-year growth 2025-2030 (%)

12.5.4 India - Market size and forecast 2025-2030

Chart on India - Market size and forecast 2025-2030 ($ million)
Data Table on India - Market size and forecast 2025-2030 ($ million)
Chart on India - Year-over-year growth 2025-2030 (%)
Data Table on India - Year-over-year growth 2025-2030 (%)

12.5.5 Australia - Market size and forecast 2025-2030

Chart on Australia - Market size and forecast 2025-2030 ($ million)
Data Table on Australia - Market size and forecast 2025-2030 ($ million)
Chart on Australia - Year-over-year growth 2025-2030 (%)
Data Table on Australia - Year-over-year growth 2025-2030 (%)

12.5.6 Indonesia - Market size and forecast 2025-2030

Chart on Indonesia - Market size and forecast 2025-2030 ($ million)
Data Table on Indonesia - Market size and forecast 2025-2030 ($ million)
Chart on Indonesia - Year-over-year growth 2025-2030 (%)
Data Table on Indonesia - Year-over-year growth 2025-2030 (%)

12.6 Middle East and Africa - Market size and forecast 2025-2030

Chart on Middle East and Africa - Market size and forecast 2025-2030 ($ million)
Data Table on Middle East and Africa - Market size and forecast 2025-2030 ($ million)
Chart on Middle East and Africa - Year-over-year growth 2025-2030 (%)
Data Table on Middle East and Africa - Year-over-year growth 2025-2030 (%)
Chart on Regional Comparison - Middle East and Africa
Data Table on Regional Comparison - Middle East and Africa

12.6.1 Saudi Arabia - Market size and forecast 2025-2030

Chart on Saudi Arabia - Market size and forecast 2025-2030 ($ million)
Data Table on Saudi Arabia - Market size and forecast 2025-2030 ($ million)
Chart on Saudi Arabia - Year-over-year growth 2025-2030 (%)
Data Table on Saudi Arabia - Year-over-year growth 2025-2030 (%)

12.6.2 UAE - Market size and forecast 2025-2030

Chart on UAE - Market size and forecast 2025-2030 ($ million)
Data Table on UAE - Market size and forecast 2025-2030 ($ million)
Chart on UAE - Year-over-year growth 2025-2030 (%)
Data Table on UAE - Year-over-year growth 2025-2030 (%)

12.6.3 South Africa - Market size and forecast 2025-2030

Chart on South Africa - Market size and forecast 2025-2030 ($ million)
Data Table on South Africa - Market size and forecast 2025-2030 ($ million)
Chart on South Africa - Year-over-year growth 2025-2030 (%)
Data Table on South Africa - Year-over-year growth 2025-2030 (%)

12.6.4 Egypt - Market size and forecast 2025-2030

Chart on Egypt - Market size and forecast 2025-2030 ($ million)
Data Table on Egypt - Market size and forecast 2025-2030 ($ million)
Chart on Egypt - Year-over-year growth 2025-2030 (%)
Data Table on Egypt - Year-over-year growth 2025-2030 (%)

12.6.5 Kuwait - Market size and forecast 2025-2030

Chart on Kuwait - Market size and forecast 2025-2030 ($ million)
Data Table on Kuwait - Market size and forecast 2025-2030 ($ million)
Chart on Kuwait - Year-over-year growth 2025-2030 (%)
Data Table on Kuwait - Year-over-year growth 2025-2030 (%)

12.7 South America - Market size and forecast 2025-2030

Chart on South America - Market size and forecast 2025-2030 ($ million)
Data Table on South America - Market size and forecast 2025-2030 ($ million)
Chart on South America - Year-over-year growth 2025-2030 (%)
Data Table on South America - Year-over-year growth 2025-2030 (%)
Chart on Regional Comparison - South America
Data Table on Regional Comparison - South America

12.7.1 Brazil - Market size and forecast 2025-2030

Chart on Brazil - Market size and forecast 2025-2030 ($ million)
Data Table on Brazil - Market size and forecast 2025-2030 ($ million)
Chart on Brazil - Year-over-year growth 2025-2030 (%)
Data Table on Brazil - Year-over-year growth 2025-2030 (%)

12.7.2 Argentina - Market size and forecast 2025-2030

Chart on Argentina - Market size and forecast 2025-2030 ($ million)
Data Table on Argentina - Market size and forecast 2025-2030 ($ million)
Chart on Argentina - Year-over-year growth 2025-2030 (%)
Data Table on Argentina - Year-over-year growth 2025-2030 (%)

12.7.3 Chile - Market size and forecast 2025-2030

Chart on Chile - Market size and forecast 2025-2030 ($ million)
Data Table on Chile - Market size and forecast 2025-2030 ($ million)
Chart on Chile - Year-over-year growth 2025-2030 (%)
Data Table on Chile - Year-over-year growth 2025-2030 (%)

12.8 Market opportunity by geography

Market opportunity by geography ($ million)
Data Tables on Market opportunity by geography ($ million)

13. Drivers, Challenges, and Opportunity

13.1 Market drivers

Imperative for photorealistic visualization in project lifecycle management
Synergistic advancements in real-time rendering and immersive technologies
Proliferation of building information modeling (BIM) and demand for integrated workflows

13.2 Market challenges

Prohibitive costs and complex licensing structures
Significant learning curve and talent scarcity
Increasing competition from integrated real time visualization solutions

13.3 Impact of drivers and challenges

Impact of drivers and challenges in 2025 and 2030

13.4 Market opportunities

Integration of artificial intelligence and generative processes
Paradigm shift toward cloud-based platforms and collaborative ecosystems
Growing emphasis on integrated environmental and performance simulation

14. Competitive Landscape

14.1 Overview

14.2

Overview on criticality of inputs and factors of differentiation

14.3 Landscape disruption

Overview on factors of disruption

14.4 Industry risks

Impact of key risks on business

15. Competitive Analysis

15.1 Companies profiled

Companies covered

15.2 Company ranking index

15.3 Market positioning of companies

Matrix on companies position and classification

15.4 Applet 3D

Applet 3D - Overview
Applet 3D - Product / Service
Applet 3D - Key offerings
SWOT

15.5 Blender Foundation

Blender Foundation - Overview
Blender Foundation - Product / Service
Blender Foundation - Key offerings
SWOT

15.6 Chaos Software GmbH

Chaos Software GmbH - Overview
Chaos Software GmbH - Product / Service
Chaos Software GmbH - Key offerings
SWOT

15.7 Daz Productions Inc.

Daz Productions Inc. - Overview
Daz Productions Inc. - Product / Service
Daz Productions Inc. - Key offerings
SWOT

15.8 Epic Games Inc.

Epic Games Inc. - Overview
Epic Games Inc. - Product / Service
Epic Games Inc. - Key offerings
SWOT

15.9 KeyShot Inc.

KeyShot Inc. - Overview
KeyShot Inc. - Product / Service
KeyShot Inc. - Key offerings
SWOT

15.10 Lumion

Lumion - Overview
Lumion - Product / Service
Lumion - Key offerings
SWOT

15.11 MyArchitectAI

MyArchitectAI - Overview
MyArchitectAI - Product / Service
MyArchitectAI - Key offerings
SWOT

15.12 Next Limit SL

Next Limit SL - Overview
Next Limit SL - Product / Service
Next Limit SL - Key offerings
SWOT

15.13 NVIDIA Corp.

NVIDIA Corp. - Overview
NVIDIA Corp. - Business segments
NVIDIA Corp. - Key news
NVIDIA Corp. - Key offerings
NVIDIA Corp. - Segment focus
SWOT

15.14 RealSpace Vision Communication

RealSpace Vision Communication - Overview
RealSpace Vision Communication - Product / Service
RealSpace Vision Communication - Key offerings
SWOT

15.15 Robert McNeel and Associates

Robert McNeel and Associates - Overview
Robert McNeel and Associates - Product / Service
Robert McNeel and Associates - Key offerings
SWOT

15.16 Shapespark sp. Zoo

Shapespark sp. Zoo - Overview
Shapespark sp. Zoo - Product / Service
Shapespark sp. Zoo - Key offerings
SWOT

15.17 Side Effects Software Inc.

Side Effects Software Inc. - Overview
Side Effects Software Inc. - Product / Service
Side Effects Software Inc. - Key offerings
SWOT

15.18 Trimble Inc.

Trimble Inc. - Overview
Trimble Inc. - Business segments
Trimble Inc. - Key news
Trimble Inc. - Key offerings
Trimble Inc. - Segment focus
SWOT

16. Appendix

16.1 Scope of the report

Market definition
Objectives
Notes and caveats

16.2 Inclusions and exclusions checklist

Inclusions checklist
Exclusions checklist

16.3 Currency conversion rates for US$

16.4 Research methodology

16.5 Data procurement

Information sources

16.6 Data validation

16.7 Validation techniques employed for market sizing

16.8 Data synthesis

16.9 360 degree market analysis

16.10 List of abbreviations

Research Methodology

Technavio presents a detailed picture of the market by way of study, synthesis, and summation of data from multiple sources. The analysts have presented the various facets of the market with a particular focus on identifying the key industry influencers. The data thus presented is comprehensive, reliable, and the result of extensive research, both primary and secondary.

INFORMATION SOURCES

Primary sources

  • Manufacturers and suppliers
  • Channel partners
  • Industry experts
  • Strategic decision makers

Secondary sources

  • Industry journals and periodicals
  • Government data
  • Financial reports of key industry players
  • Historical data
  • Press releases

DATA ANALYSIS

Data Synthesis

  • Collation of data
  • Estimation of key figures
  • Analysis of derived insights

Data Validation

  • Triangulation with data models
  • Reference against proprietary databases
  • Corroboration with industry experts

REPORT WRITING

Qualitative

  • Market drivers
  • Market challenges
  • Market trends
  • Five forces analysis

Quantitative

  • Market size and forecast
  • Market segmentation
  • Geographical insights
  • Competitive landscape

Interested in this report?

Get your sample now to see our research methodology and insights!

Download Now

Frequently Asked Questions

Architectural Rendering Software market growth will increase by USD 2772.8 million during 2026-2030.

The Architectural Rendering Software market is expected to grow at a CAGR of 22.3% during 2026-2030.

Architectural Rendering Software market is segmented by Application (Non-residential, Residential, Others) Deployment (On-premises, Cloud) Component (Software, Services)

Applet 3D, ArchiVinci, Blender Foundation, Chaos Software GmbH, Daz Productions Inc., Epic Games Inc., KeyShot Inc., Lumion, MyArchitectAI, Next Limit SL, NVIDIA Corp., RealSpace Vision Communication, Robert McNeel and Associates, Shapespark sp. Zoo, Side Effects Software Inc., Snaptrude Inc., Trimble Inc., ZOA Studio are a few of the key vendors in the Architectural Rendering Software market.

North America will register the highest growth rate of 36% among the other regions. Therefore, the Architectural Rendering Software market in North America is expected to garner significant business opportunities for the vendors during the forecast period.

US, Canada, Mexico, Germany, France, UK, Italy, Spain, The Netherlands, China, Japan, South Korea, India, Australia, Indonesia, Saudi Arabia, UAE, South Africa, Egypt, Kuwait, Brazil, Argentina, Chile

  • Imperative for photorealistic visualization in project lifecycle management is the driving factor this market.

The Architectural Rendering Software market vendors should focus on grabbing business opportunities from the Application segment as it accounted for the largest market share in the base year.
RIA - Research AI Assistant
Ask RIA