US Electrical Protective Equipment Market Size 2026-2030
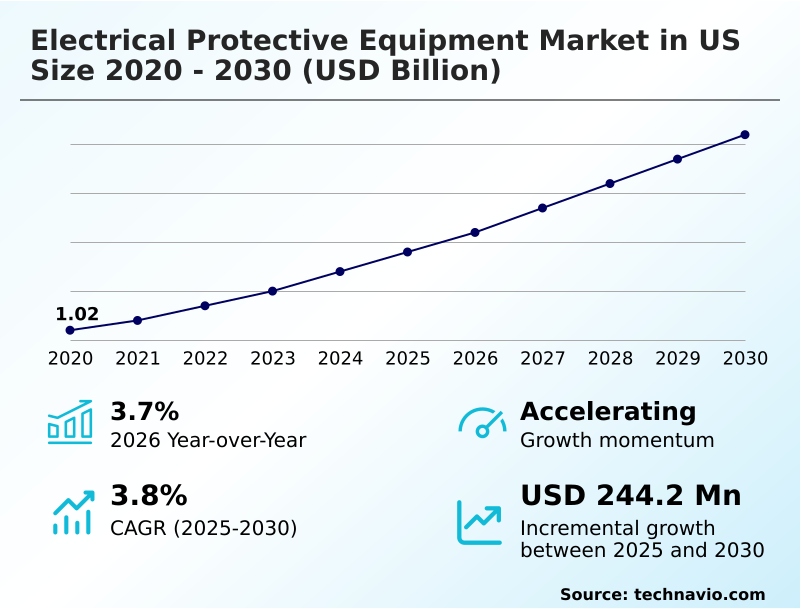
The us electrical protective equipment market size is valued to increase by USD 244.2 million, at a CAGR of 3.8% from 2025 to 2030. Strong emphasis on occupational safety and regulatory compliance will drive the us electrical protective equipment market.
Major Market Trends & Insights
- By Product - HEFPM segment was valued at USD 497.8 million in 2024
- By End-user - Manufacturing segment accounted for the largest market revenue share in 2024
Market Size & Forecast
- Market Opportunities: USD 406.7 million
- Market Future Opportunities: USD 244.2 million
- CAGR from 2025 to 2030 : 3.8%
Market Summary
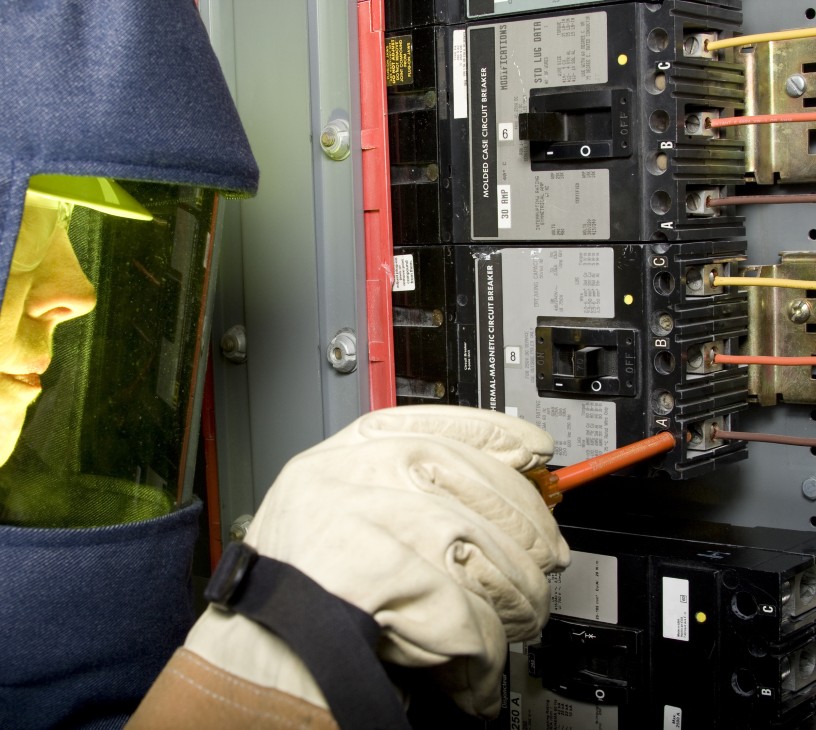
- The electrical protective equipment market in US is shaped by an unyielding focus on workplace safety, driven by stringent regulatory frameworks and the increasing complexity of electrical systems. Demand is fundamentally linked to the need to protect personnel from life-threatening hazards such as arc flash and electrocution in sectors including utilities, construction, and manufacturing.
- Key market dynamics include the accelerated adoption of renewable energy sources and the expansion of electric vehicle (EV) infrastructure, both of which introduce new high-voltage environments requiring specialized protective gear. A significant trend is the development of high-performance, lightweight materials that enhance worker comfort and compliance without compromising safety.
- For instance, a utility company upgrading its grid to accommodate solar and wind inputs must equip its technicians with advanced arc-rated clothing and insulated tools designed for direct current (DC) systems.
- However, the high cost of this advanced equipment and ergonomic limitations pose challenges, compelling manufacturers to balance innovation with affordability and user-centric design to ensure broad market adoption and effective risk mitigation.
What will be the Size of the US Electrical Protective Equipment Market during the forecast period?
Get Key Insights on Market Forecast (PDF) Get Free Sample
How is the US Electrical Protective Equipment Market Segmented?
The us electrical protective equipment industry research report provides comprehensive data (region-wise segment analysis), with forecasts and estimates in "USD million" for the period 2026-2030, as well as historical data from 2020-2024 for the following segments.
- Product
- HEFPM
- PC
- HAPM
- FLP
- End-user
- Manufacturing
- Construction
- Automotive
- Oil and gas
- Others
- Material
- Rubber
- Fabric
- Plastic
- Metal
- Leather
- Distribution channel
- Offline
- Online
- Geography
- North America
- US
- North America
By Product Insights
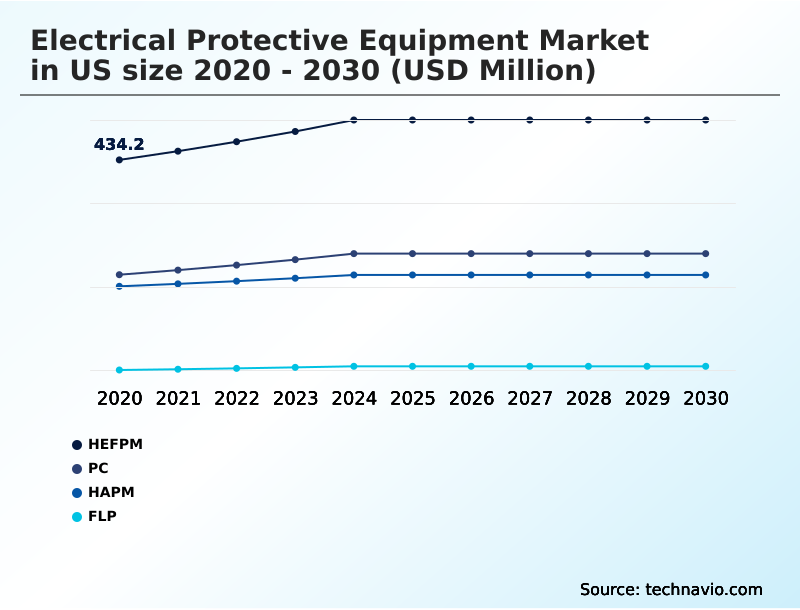
The hefpm segment is estimated to witness significant growth during the forecast period.
The electrical protective equipment market in US segments by product, end-user, and material. Product segmentation includes hand, eye, and foot protective gear, protective clothing, head and face protection, and fall and line protection.
Key end-users are manufacturing, construction, automotive, and oil and gas industries, all driven by stringent safety regulations. Material segmentation is crucial, with dielectric rubber, advanced flame-resistant fabrics, and non-conductive plastics forming the core of protective solutions.
Hand, eye, and foot protection remains a critical segment, with high-quality rubber insulating gloves and dielectric footwear serving as the first line of defense against electrocution.
These items, essential for high-voltage workwear, must balance maximum dielectric strength with the manual dexterity needed for intricate tasks.
Certified laboratories report that routine dielectric testing results in a replacement rate of over 5% for voltage-rated gloves, underscoring the continuous demand driven by safety compliance.
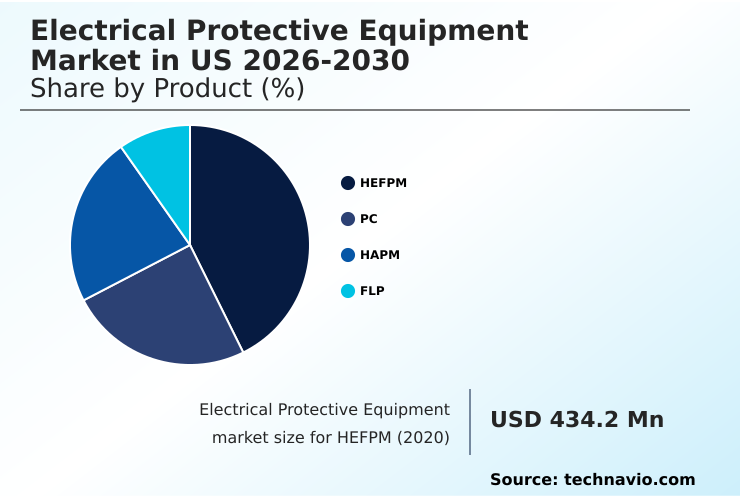
The HEFPM segment was valued at USD 497.8 million in 2024 and showed a gradual increase during the forecast period.
Market Dynamics
Our researchers analyzed the data with 2025 as the base year, along with the key drivers, trends, and challenges. A holistic analysis of drivers will help companies refine their marketing strategies to gain a competitive advantage.
- Strategic procurement within the electrical protective equipment market requires a nuanced understanding of specific operational hazards and long-term value. When evaluating the cost of electrical safety PPE, managers must look beyond initial pricing to consider the total cost of ownership, including mandatory testing and replacement cycles for equipment like insulated gloves for EV maintenance.
- The selection between different arc flash suit ratings for utility workers versus electricians in a manufacturing plant highlights the need for task-specific risk assessments.
- Investing in high voltage personal protective equipment that prioritizes both safety and comfort is crucial; for example, facilities that adopt lightweight flame resistant workwear often report a nearly 20% higher compliance rate compared to those using older, bulkier gear. Choosing the best arc flash suit involves balancing thermal protection with mobility.
- Similarly, ensuring the quality of electrical safety equipment for industrial use, such as durable dielectric boots for construction sites, directly impacts incident rates and operational continuity. The standards for lineman climbing gear and the proper use of an arc flash blanket are non-negotiable aspects of a comprehensive safety program.
- Ultimately, the effectiveness of PPE for high voltage environments depends on a combination of superior materials, ergonomic design, and rigorous adherence to safety protocols, ensuring that investments in gear like arc flash clothing for sale translate into tangible risk reduction and enhanced worker well-being.
- The market offers various solutions, including arc flash protection kits and specific arc flash rated coveralls, to meet diverse safety needs.
What are the key market drivers leading to the rise in the adoption of US Electrical Protective Equipment Industry?
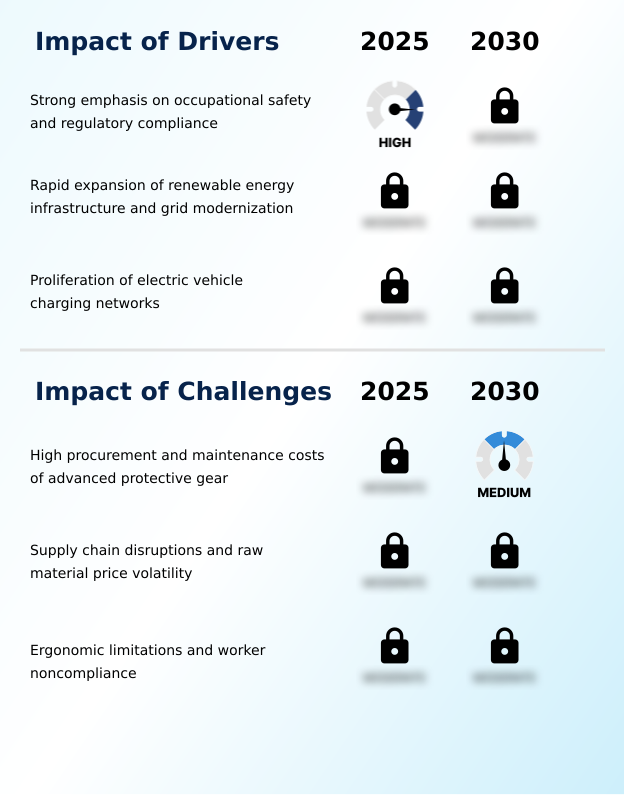
- A strong emphasis on occupational safety and stringent regulatory compliance is a key driver for the electrical protective equipment market.
- Market growth is fundamentally driven by stringent regulatory mandates and large-scale infrastructure transformations. Strict adherence to OSHA and NFPA 70E standards compels continuous investment in compliant personal protective equipment (ppe), including insulated tools and arc flash protection kits.
- The nationwide modernization of the electrical grid to support renewable energy sources is a primary catalyst, with such projects accounting for nearly one-third of new procurement contracts for high-voltage workwear.
- Furthermore, the rapid build-out of electric vehicle (EV) charging networks has spurred a 15% year-over-year increase in demand for specialized direct current protective gear.
- This confluence of regulatory pressure and infrastructural development ensures sustained demand for lineman safety equipment and other forms of electrical safety clothing across multiple industrial sectors, making safety a non-negotiable aspect of operations.
What are the market trends shaping the US Electrical Protective Equipment Industry?
- The integration of wearable sensor technology and the Internet of Things (IoT) is an emerging market trend. This innovation is transforming passive protective gear into active monitoring systems for enhanced worker safety.
- Key trends reshaping the electrical protective equipment market are centered on digitalization and sustainability. The integration of IoT sensors into arc flash suits and other electrical safety gear transforms them into active monitoring systems. This smart PPE can detect proximity to energized equipment, reducing accidental contact incidents by over 50%, and monitor worker biometrics to prevent heat stress.
- Concurrently, there is a strong push toward a circular economy, with manufacturers establishing take-back programs for items like voltage rated boots. These initiatives focus on recycling dielectric rubber and other materials, diverting up to 70% of waste from landfills.
- This pivot to sustainable manufacturing and advanced technological integration reflects a broader industry commitment to enhancing both worker safety and environmental stewardship, influencing choices in protective equipment.
What challenges does the US Electrical Protective Equipment Industry face during its growth?
- The high procurement and ongoing maintenance costs associated with advanced protective gear present a key challenge to market growth.
- Significant challenges confronting the electrical protective equipment market include high costs, supply chain vulnerabilities, and ergonomic limitations. The total cost of ownership for advanced gear such as arc flash rated coveralls can be up to 60% higher than standard equipment due to the use of specialized materials like high-performance synthetic fibers and mandatory recertification schedules.
- Supply chain disruptions have exacerbated this, causing raw material price increases of over 20% for components used in lineman climbing gear and other products. Moreover, the inherent discomfort of bulky protective clothing for electricians often leads to worker non-compliance, undermining safety protocols.
- This forces manufacturers to invest heavily in developing more ergonomic and breathable solutions without compromising the essential arc thermal performance value required for arc flash protection.
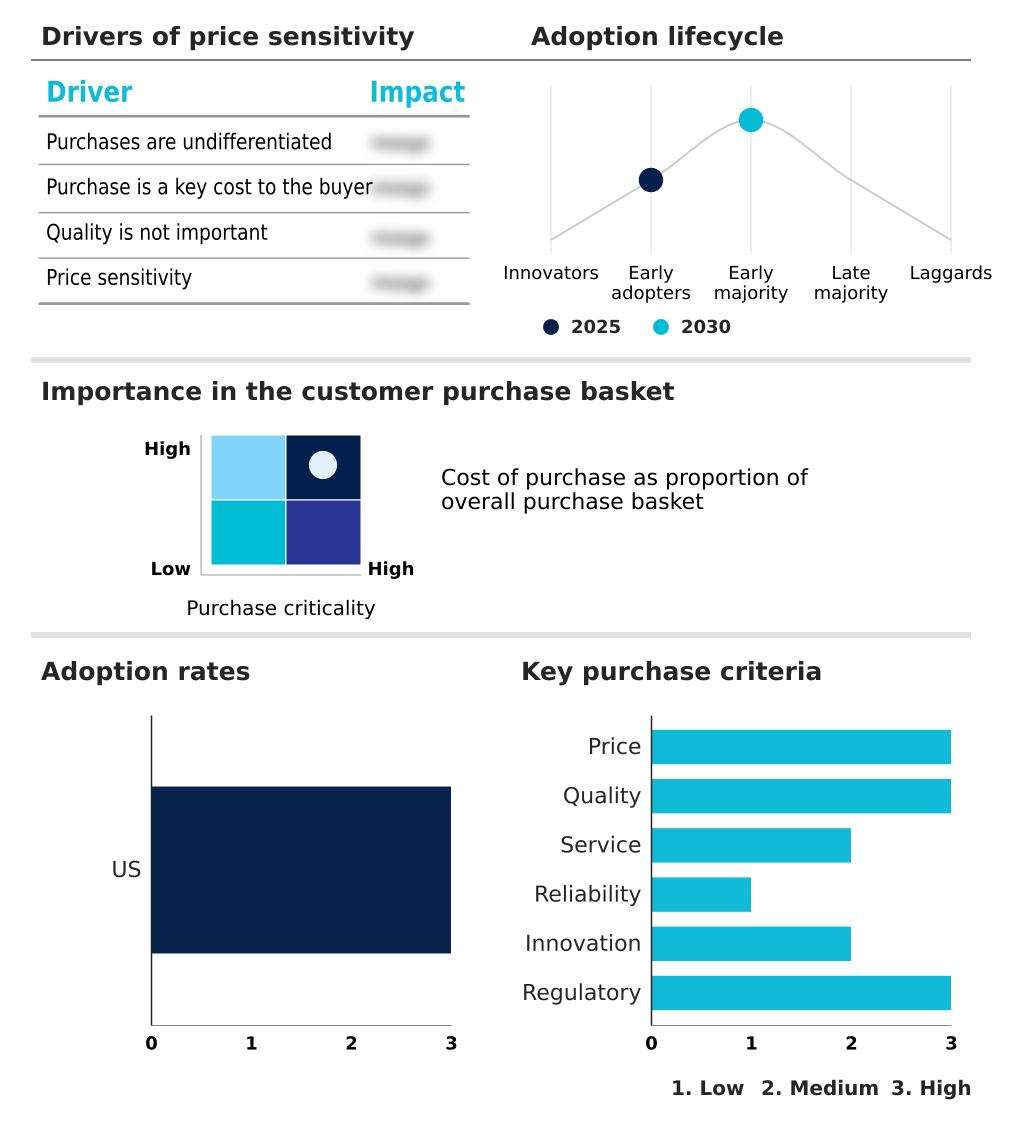
Exclusive Technavio Analysis on Customer Landscape
The us electrical protective equipment market forecasting report includes the adoption lifecycle of the market, covering from the innovator’s stage to the laggard’s stage. It focuses on adoption rates in different regions based on penetration. Furthermore, the us electrical protective equipment market report also includes key purchase criteria and drivers of price sensitivity to help companies evaluate and develop their market growth analysis strategies.
Customer Landscape of US Electrical Protective Equipment Industry
Competitive Landscape
Companies are implementing various strategies, such as strategic alliances, us electrical protective equipment market forecast, partnerships, mergers and acquisitions, geographical expansion, and product/service launches, to enhance their presence in the industry.
3M Co. - Offerings include advanced arc flash harnesses, dielectric head protection, and integrated communication systems, targeting high-risk electrical safety applications and enhancing personal protection.
The industry research and growth report includes detailed analyses of the competitive landscape of the market and information about key companies, including:
- 3M Co.
- Ansell Ltd.
- CATU SAS
- Cementex Products, Inc
- Cintas Corp.
- DuPont de Nemours Inc.
- Kimberly Clark Corp.
- Lakeland Industries Inc.
- Magid Glove and Safety Co
- MSA Safety Inc.
- National Safety Apparel Inc.
- Oberon
- ProGARM Ltd.
- Protective Industrial Products Inc.
- Radians Inc.
- Sofamel SL
- Steel Grip Inc.
- US Rubber Supply Co.
- WESCO International Inc.
- WW Grainger Inc.
Qualitative and quantitative analysis of companies has been conducted to help clients understand the wider business environment as well as the strengths and weaknesses of key industry players. Data is qualitatively analyzed to categorize companies as pure play, category-focused, industry-focused, and diversified; it is quantitatively analyzed to categorize companies as dominant, leading, strong, tentative, and weak.
Recent Development and News in Us electrical protective equipment market
- In January 2025, Tyndale Company expanded its portfolio of arc-rated and flame-resistant (FR) clothing, introducing new garment styles and enhanced fabric technologies to improve comfort and protection.
- In March 2025, the Occupational Safety and Health Administration (OSHA) released updated guidance on personal protective equipment (PPE) requirements and standards for arc flash hazard protection.
- In May 2025, Protective Industrial Products (PIP) finalized its acquisition of Honeywell's personal protective equipment business, significantly expanding its footprint in the electrical safety market with brands like Salisbury.
- In November 2024, a major utility provider and an automotive manufacturer announced a strategic partnership to standardize safety protocols and personal protective equipment for maintaining electric vehicle fast-charging networks.
Dive into Technavio’s robust research methodology, blending expert interviews, extensive data synthesis, and validated models for unparalleled US Electrical Protective Equipment Market insights. See full methodology.
| Market Scope | |
|---|---|
| Page number | 216 |
| Base year | 2025 |
| Historic period | 2020-2024 |
| Forecast period | 2026-2030 |
| Growth momentum & CAGR | Accelerate at a CAGR of 3.8% |
| Market growth 2026-2030 | USD 244.2 million |
| Market structure | Fragmented |
| YoY growth 2025-2026(%) | 3.7% |
| Key countries | US |
| Competitive landscape | Leading Companies, Market Positioning of Companies, Competitive Strategies, and Industry Risks |
Research Analyst Overview
- The electrical protective equipment market's trajectory is defined by the critical intersection of regulatory enforcement and material science innovation. Boardroom decisions are increasingly influenced by the need to mitigate liability through investment in superior personal protection solutions.
- The development of advanced flame-resistant textiles and high-performance synthetic fibers is a direct response to demand for gear that offers higher arc thermal performance value without sacrificing comfort.
- This shift toward lightweight, breathable arc-rated clothing is not merely a trend but a strategic move to boost worker compliance and productivity; companies that pair advanced PPE with comprehensive training achieve a 40% lower rate of electrical-related safety violations.
- The market is built on foundational components like dielectric rubber and non-conductive plastics, which are essential for manufacturing voltage-rated gloves and electrical hazard rated boots. The emphasis on shock protection, arc flash protection, and thermal insulation governs all product design, from fall protection systems to head and face shields.
- As high-voltage systems become more prevalent, the demand for equipment that meets stringent safety standards will continue to intensify, cementing the market's essential role in industrial operations.
What are the Key Data Covered in this US Electrical Protective Equipment Market Research and Growth Report?
-
What is the expected growth of the US Electrical Protective Equipment Market between 2026 and 2030?
-
USD 244.2 million, at a CAGR of 3.8%
-
-
What segmentation does the market report cover?
-
The report is segmented by Product (HEFPM, PC, HAPM, and FLP), End-user (Manufacturing, Construction, Automotive, Oil and gas, and Others), Material (Rubber, Fabric, Plastic, Metal, and Leather), Distribution Channel (Offline, and Online) and Geography (North America)
-
-
Which regions are analyzed in the report?
-
North America
-
-
What are the key growth drivers and market challenges?
-
Strong emphasis on occupational safety and regulatory compliance, High procurement and maintenance costs of advanced protective gear
-
-
Who are the major players in the US Electrical Protective Equipment Market?
-
3M Co., Ansell Ltd., CATU SAS, Cementex Products, Inc, Cintas Corp., DuPont de Nemours Inc., Kimberly Clark Corp., Lakeland Industries Inc., Magid Glove and Safety Co, MSA Safety Inc., National Safety Apparel Inc., Oberon, ProGARM Ltd., Protective Industrial Products Inc., Radians Inc., Sofamel SL, Steel Grip Inc., US Rubber Supply Co., WESCO International Inc. and WW Grainger Inc.
-
Market Research Insights
- The dynamics of the electrical protective equipment market are dictated by a convergence of regulatory mandates, technological innovation, and operational demands. The market for personal protective equipment (PPE) is heavily influenced by standards from bodies like OSHA and NFPA, which compel investment in compliant electrical safety gear.
- Innovations in smart PPE, incorporating sensors for real-time hazard detection, have demonstrated a 25% reduction in heat-stress incidents, enhancing electrical shock prevention. The adoption of high-voltage workwear made from advanced, lightweight textiles improves both safety and productivity, with adherence to NFPA 70E standards capable of reducing arc flash injuries by up to 80%.
- This evolution makes protective clothing for electricians more effective. Demand for lineman safety equipment and insulated hand tools is also rising, driven by grid modernization and the expansion of high-voltage systems, ensuring worker safety remains a paramount concern for all end-users.
We can help! Our analysts can customize this us electrical protective equipment market research report to meet your requirements.
 RIA -
RIA - 
