US|North America Organic Packaged Food Market Analysis, Size, and Forecast 2024-2028

US|North America Organic Packaged Food Market Analysis, Size, and Forecast 2024-2028

Published: Feb 2024 152 Pages SKU: IRTNTR77515

Market Overview at a Glance

$7.4 B
Market Opportunity
7.65%
CAGR
6.77
YoY growth 2023-2024(%)

US Organic Packaged Food Market Size 2024-2028 

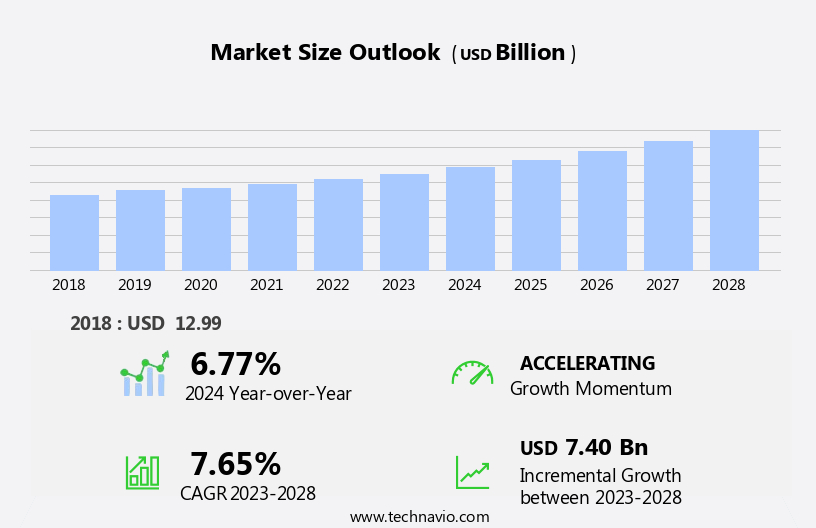
US organic packaged food market size is forecast to increase by USD 7.40 billion, at a CAGR of 7.65% between 2023 and 2028.

  • The organic packaged food market in the US is booming, driven by conscious consumerism, rising demand for healthy eating, and a shift toward natural ingredients and non-GMO food. Consumers, including athletes, working women, and pets owners, seek organic snacks, organic treats, and gluten-free options to support a healthy lifestyle and weight loss goals.
  • Trends in plant-based food, vegan food, and dairy-free food are influencing food innovation and food technology, with organic meal kits, subscription boxes, and grocery delivery gaining traction. Emphasis on sustainable packaging, eco-friendly bakery, and sustainable food aligns with ethics and the movement toward food safety. Meanwhile, social media, influencers, and online distribution drive food branding, food marketing, and corporate wellness, shaping modern food trends and recipes.

What will be the size of the US Organic Packaged Food Market during the forecast period?

Organic Packaged Food Market in US Size

Explore in-depth regional segment analysis with market size data - historical 2018-2022 and forecasts 2024-2028 - in the full report.  
 Request Free Sample

  • The organic packaged food market is experiencing significant growth, with a focus on healthy options that cater to the demands of busy professionals and ethical consumers. Delivery services have become increasingly popular, offering taste benefits and convenience for those with limited time. Natural sweeteners and ingredients are prioritized, reflecting the trend towards clean eating and responsible consumption. Wholesale food distribution and food manufacturing have adapted to this shift, ensuring certification and ethical sourcing. Packaging plays a crucial role in food retail, with a focus on transparency and food labeling that accurately reflects organic and natural credentials.
  • Research and development in food processing and marketing have led to an abundance of plant-based options, including organic confectionery , bakery products and vegan bakery products. Offline distribution channels, such as health food stores and organic grocery, continue to thrive, while online shopping and recipe sharing have expanded the market's reach. Festivals and events have become platforms for showcasing organic and natural food offerings, highlighting the availability and benefits of these options. Time-saving meals and workplace snacks have gained popularity, with a focus on reducing food waste and maintaining food quality. Restaurants have responded by offering organic and plant-based options, further expanding the market's scope. Overall, the organic packaged food market in the US is a dynamic and evolving industry, driven by consumer demand for healthy, natural, and ethically sourced options.

How is this market segmented?

The market research report provides comprehensive data (region-wise segment analysis), with forecasts and estimates in "USD billion" for the period 2024-2028, as well as historical data from 2018-2022 for the following segments.

  • Product
    • Dairy bakery and confectionaries
    • Meat seafood fruits and vegetables
    • Sauces dressings condiments and spreads
    • Others
  • Packaging
    • Flexible packaging
    • Rigid packaging
    • Paperboard packaging
    • Metal packaging
  • Distribution Channel
    • Offline
    • Online
    • Supermarkets and Hypermarkets
    • Specialty Stores
    • Convenience Stores
  • Consumer Segment
    • Health-Conscious Consumers
    • Vegans
    • Vegetarians
    • General Consumers
  • Geography
    • North America
      • US

By Product Insights

The dairy bakery and confectionaries segment is estimated to witness significant growth during the forecast period.

In the dynamic organic packaged food market in the US, working-class professionals and urban consumers seek delicious, healthier alternatives to conventional food. General stores and supermarkets, as well as online platforms, cater to this demand, offering a wide array of organic food products. Organic farming practices, such as natural methods and the absence of synthetic pesticides and chemical fertilizer, are increasingly preferred. This is particularly true for produce, including vegetables, fruits, and even meat, as consumers prioritize health benefits and sustainability. Snacks, such as nutrition bars and organic chips, are popular choices for busy lifestyles. Organic sauces, dressings, and condiments add flavor to meals without the added concern of health-related disorders.

Boxed food, with its long shelf life and express delivery, is a convenient option for eco-conscious consumers seeking clear sourcing and natural food options. Organic certification ensures the absence of antibiotics, growth hormones, and irradiation. The organic packaged food market encompasses various product categories, including dairy products, bakery items, and organic beverages. Dairy products, such as milk, yogurt, cheese, and butter, are sourced from organically raised animals, ensuring animal welfare and the absence of synthetic additives. In the bakery sector, items like bread, pastries, cookies, and cakes are made from organic ingredients, contributing to the market's growth. Organic farming practices extend to fish and other seafood, as well as organic farm products, such as sauces, dressings, and condiments.

Sustainability and eco-consciousness are key selling points for these products, appealing to modern work-lifestyles and household chores. The market's unique selling proposition lies in its commitment to healthier, natural food options, catering to the diverse needs and preferences of consumers.

Organic Packaged Food Market in US Size

Download Free Sample Report

The Dairy bakery and confectionaries segment was valued at  USD 7.41 billion in 2018 and showed a gradual increase during the forecast period.

Market Dynamics

Our researchers analyzed the data with 2023 as the base year, along with the key drivers, trends, and challenges. A holistic analysis of drivers will help companies refine their marketing strategies to gain a competitive advantage.

What are the US Organic Packaged Food Market drivers leading to the rise in adoption of the Industry?

  • ai_driver_intro 

ai_driver_content_dynamics_gai.multili

What are the US Organic Packaged Food Market trends shaping the Industry?

  • ai_trend_intro

ai_trends_content_dynamics_gai.multili

How does US Organic Packaged Food Market faces challenges face during its growth?

  • ai_challenge_intro 

ai_challenge_content_dynamic_gai.multili

Exclusive US Organic Packaged Food Market Customer Landscape

The market forecasting report includes the adoption lifecycle of the market, covering from the innovator's stage to the laggard's stage. It focuses on adoption rates in different regions based on penetration. Furthermore, the report also includes key purchase criteria and drivers of price sensitivity to help companies evaluate and develop their market growth analysis strategies.

Organic Packaged Food Market in US Share by Geography

 Customer Landscape

Key Companies & Market Insights

Companies are implementing various strategies, such as strategic alliances, market forecast partnerships, mergers and acquisitions, geographical expansion, and product/service launches, to enhance their presence in the market.

The market research and growth report includes detailed analyses of the competitive landscape of the market and information about key companies, including:

  • Amys Kitchen Inc.
  • Arla Foods amba
  • Aurora Organic Dairy
  • Barilla G. e R. Fratelli Spa
  • Campbell Soup Co.
  • Corporativo Bimbo SA de CV
  • Danone
  • DAVES KILLER BREAD
  • Flowers Foods Inc.
  • General Mills Inc.
  • LT Foods Ltd.
  • Nestle SA
  • Organic Valley
  • Perdue Farms Inc.
  • The Hain Celestial Group Inc.
  • The Hershey Co.
  • Tyson Foods Inc.
  • Hormel Foods Corp.

Qualitative and quantitative analysis of companies has been conducted to help clients understand the wider business environment as well as the strengths and weaknesses of key market players. Data is qualitatively analyzed to categorize companies as pure play, category-focused, industry-focused, and diversified; it is quantitatively analyzed to categorize companies as dominant, leading, strong, tentative, and weak.

Recent Development and News in Organic Packaged Food Market In US

ai_recent_development.aili

Research Analyst Overview

ai_research_analyst_overview.multip

Dive into Technavio's robust research methodology, blending expert interviews, extensive data synthesis, and validated models for unparalleled Organic Packaged Food Market in US insights. See full methodology.

Market Scope

Report Coverage

Details

Page number

152

Base year

2023

Historic period

2018-2022

Forecast period

2024-2028

Growth momentum & CAGR

Accelerate at a CAGR of 7.65%

Market growth 2024-2028

USD 7.40 billion

Market structure

Fragmented

YoY growth 2023-2024(%)

6.77

Competitive landscape

Leading Companies, Market Positioning of Companies, Competitive Strategies, and Industry Risks

Request Free Sample

What are the Key Data Covered in this Market Research Report?

  • CAGR of the market during the forecast period
  • Detailed information on factors that will drive the market growth and forecasting between 2024 and 2028
  • Precise estimation of the size of the market  and its contribution of the market in focus to the parent market
  • Accurate predictions about upcoming market growth and trends and changes in consumer behaviour
  • Growth of the market across US
  • Thorough analysis of the market's competitive landscape and detailed information about companies
  • Comprehensive analysis of factors that will challenge the growth of market companies

We can help! Our analysts can customize this market research report to meet your requirements Get in touch

1 Executive Summary

  • 1.1 Market overview
    • Exhibit 01: Executive Summary – Chart on Market Overview
    • Exhibit 02: Executive Summary – Data Table on Market Overview
    • Exhibit 03: Executive Summary – Chart on Country Market Characteristics
    • Exhibit 04: Executive Summary – Chart on Market Segmentation by Product
    • Exhibit 05: Executive Summary – Chart on Market Segmentation by Packaging
    • Exhibit 06: Executive Summary – Chart on Market Segmentation by Distribution Channel
    • Exhibit 07: Executive Summary – Chart on Vendor Market Positioning

2 Market Landscape

  • 2.1 Market ecosystem
    • Exhibit 08: Parent market
    • Exhibit 09: Market Characteristics

3 Market Sizing

  • 3.1 Market definition
    • Exhibit 10: Offerings of vendors included in the market definition
  • 3.2 Market segment analysis
    • Exhibit 11: Market segments
  • 3.3 Market size 2023
    • 3.4 Market outlook: Forecast for 2023-2028
      • Exhibit 12: Chart on US - Market size and forecast 2023-2028 ($ million)
      • Exhibit 13: Data Table on US - Market size and forecast 2023-2028 ($ million)
      • Exhibit 14: Chart on US: Year-over-year growth 2023-2028 (%)
      • Exhibit 15: Data Table on US: Year-over-year growth 2023-2028 (%)

    4 Historic Market Size

    • 4.1 Organic packaged food market in US 2018 - 2022
      • Exhibit 16: Historic Market Size – Data Table on organic packaged food market in US 2018 - 2022 ($ million)
    • 4.2 Product Segment Analysis 2018 - 2022
      • Exhibit 17: Historic Market Size – Product Segment 2018 - 2022 ($ million)
    • 4.3 Packaging Segment Analysis 2018 - 2022
      • Exhibit 18: Historic Market Size – Packaging Segment 2018 - 2022 ($ million)
    • 4.4 Distribution Channel Segment Analysis 2018 - 2022
      • Exhibit 19: Historic Market Size – Distribution Channel Segment 2018 - 2022 ($ million)

    5 Five Forces Analysis

    • 5.1 Five forces summary
      • Exhibit 20: Five forces analysis - Comparison between 2023 and 2028
    • 5.2 Bargaining power of buyers
      • Exhibit 21: Chart on Bargaining power of buyers – Impact of key factors 2023 and 2028
    • 5.3 Bargaining power of suppliers
      • Exhibit 22: Bargaining power of suppliers – Impact of key factors in 2023 and 2028
    • 5.4 Threat of new entrants
      • Exhibit 23: Threat of new entrants – Impact of key factors in 2023 and 2028
    • 5.5 Threat of substitutes
      • Exhibit 24: Threat of substitutes – Impact of key factors in 2023 and 2028
    • 5.6 Threat of rivalry
      • Exhibit 25: Threat of rivalry – Impact of key factors in 2023 and 2028
    • 5.7 Market condition
      • Exhibit 26: Chart on Market condition - Five forces 2023 and 2028

    6 Market Segmentation by Product

    • 6.1 Market segments
      • Chart on Product - Market share (2023-2028) (%)
      • Data Table on Product - Market share (2023-2028) (%)
    • 6.2 Comparison by Product
      • Chart on Comparison by Product
      • Data Table on Comparison by Product
    • 6.3 Dairy bakery and confectionaries - Market size and forecast (2023-2028)
      • Chart on Dairy bakery and confectionaries - Market size and forecast (2023-2028) ($ million)
      • Data Table on Dairy bakery and confectionaries - Market size and forecast (2023-2028) ($ million)
      • Chart on Dairy bakery and confectionaries - Year-over-year growth (2023-2028) (%)
      • Data Table on Dairy bakery and confectionaries - Year-over-year growth (2023-2028) (%)
    • 6.4 Meat seafood fruits and vegetables - Market size and forecast (2023-2028)
      • Chart on Meat seafood fruits and vegetables - Market size and forecast (2023-2028) ($ million)
      • Data Table on Meat seafood fruits and vegetables - Market size and forecast (2023-2028) ($ million)
      • Chart on Meat seafood fruits and vegetables - Year-over-year growth (2023-2028) (%)
      • Data Table on Meat seafood fruits and vegetables - Year-over-year growth (2023-2028) (%)
    • 6.5 Sauces dressings condiments and spreads - Market size and forecast (2023-2028)
      • Chart on Sauces dressings condiments and spreads - Market size and forecast (2023-2028) ($ million)
      • Data Table on Sauces dressings condiments and spreads - Market size and forecast (2023-2028) ($ million)
      • Chart on Sauces dressings condiments and spreads - Year-over-year growth (2023-2028) (%)
      • Data Table on Sauces dressings condiments and spreads - Year-over-year growth (2023-2028) (%)
    • 6.6 Others - Market size and forecast (2023-2028)
      • Chart on Others - Market size and forecast (2023-2028) ($ million)
      • Data Table on Others - Market size and forecast (2023-2028) ($ million)
      • Chart on Others - Year-over-year growth (2023-2028) (%)
      • Data Table on Others - Year-over-year growth (2023-2028) (%)
    • 6.7 Market opportunity by Product
      • Market opportunity by Product ($ million)
      • Data Table on Market opportunity by Product ($ million)

    7 Market Segmentation by Packaging

    • 7.1 Market segments
      • Chart on Packaging - Market share (2023-2028) (%)
      • Data Table on Packaging - Market share (2023-2028) (%)
    • 7.2 Comparison by Packaging
      • Chart on Comparison by Packaging
      • Data Table on Comparison by Packaging
    • 7.3 Flexible packaging - Market size and forecast (2023-2028)
      • Chart on Flexible packaging - Market size and forecast (2023-2028) ($ million)
      • Data Table on Flexible packaging - Market size and forecast (2023-2028) ($ million)
      • Chart on Flexible packaging - Year-over-year growth (2023-2028) (%)
      • Data Table on Flexible packaging - Year-over-year growth (2023-2028) (%)
    • 7.4 Rigid packaging - Market size and forecast (2023-2028)
      • Chart on Rigid packaging - Market size and forecast (2023-2028) ($ million)
      • Data Table on Rigid packaging - Market size and forecast (2023-2028) ($ million)
      • Chart on Rigid packaging - Year-over-year growth (2023-2028) (%)
      • Data Table on Rigid packaging - Year-over-year growth (2023-2028) (%)
    • 7.5 Paperboard packaging - Market size and forecast (2023-2028)
      • Chart on Paperboard packaging - Market size and forecast (2023-2028) ($ million)
      • Data Table on Paperboard packaging - Market size and forecast (2023-2028) ($ million)
      • Chart on Paperboard packaging - Year-over-year growth (2023-2028) (%)
      • Data Table on Paperboard packaging - Year-over-year growth (2023-2028) (%)
    • 7.6 Metal packaging - Market size and forecast (2023-2028)
      • Chart on Metal packaging - Market size and forecast (2023-2028) ($ million)
      • Data Table on Metal packaging - Market size and forecast (2023-2028) ($ million)
      • Chart on Metal packaging - Year-over-year growth (2023-2028) (%)
      • Data Table on Metal packaging - Year-over-year growth (2023-2028) (%)
    • 7.7 Market opportunity by Packaging
      • Market opportunity by Packaging ($ million)
      • Data Table on Market opportunity by Packaging ($ million)

    8 Market Segmentation by Distribution Channel

    • 8.1 Market segments
      • Chart on Distribution Channel - Market share (2023-2028) (%)
      • Data Table on Distribution Channel - Market share (2023-2028) (%)
    • 8.2 Comparison by Distribution Channel
      • Chart on Comparison by Distribution Channel
      • Data Table on Comparison by Distribution Channel
    • 8.3 Offline - Market size and forecast (2023-2028)
      • Chart on Offline - Market size and forecast (2023-2028) ($ million)
      • Data Table on Offline - Market size and forecast (2023-2028) ($ million)
      • Chart on Offline - Year-over-year growth (2023-2028) (%)
      • Data Table on Offline - Year-over-year growth (2023-2028) (%)
    • 8.4 Online - Market size and forecast (2023-2028)
      • Chart on Online - Market size and forecast (2023-2028) ($ million)
      • Data Table on Online - Market size and forecast (2023-2028) ($ million)
      • Chart on Online - Year-over-year growth (2023-2028) (%)
      • Data Table on Online - Year-over-year growth (2023-2028) (%)
    • 8.5 Supermarkets and Hypermarkets - Market size and forecast (2023-2028)
      • Chart on Supermarkets and Hypermarkets - Market size and forecast (2023-2028) ($ million)
      • Data Table on Supermarkets and Hypermarkets - Market size and forecast (2023-2028) ($ million)
      • Chart on Supermarkets and Hypermarkets - Year-over-year growth (2023-2028) (%)
      • Data Table on Supermarkets and Hypermarkets - Year-over-year growth (2023-2028) (%)
    • 8.6 Specialty Stores - Market size and forecast (2023-2028)
      • Chart on Specialty Stores - Market size and forecast (2023-2028) ($ million)
      • Data Table on Specialty Stores - Market size and forecast (2023-2028) ($ million)
      • Chart on Specialty Stores - Year-over-year growth (2023-2028) (%)
      • Data Table on Specialty Stores - Year-over-year growth (2023-2028) (%)
    • 8.7 Convenience Stores - Market size and forecast (2023-2028)
      • Chart on Convenience Stores - Market size and forecast (2023-2028) ($ million)
      • Data Table on Convenience Stores - Market size and forecast (2023-2028) ($ million)
      • Chart on Convenience Stores - Year-over-year growth (2023-2028) (%)
      • Data Table on Convenience Stores - Year-over-year growth (2023-2028) (%)
    • 8.8 Market opportunity by Distribution Channel
      • Market opportunity by Distribution Channel ($ million)
      • Data Table on Market opportunity by Distribution Channel ($ million)

    9 Market Segmentation by Consumer Segment

    • 9.1 Market segments
      • Chart on Consumer Segment - Market share (2023-2028) (%)
      • Data Table on Consumer Segment - Market share (2023-2028) (%)
    • 9.2 Comparison by Consumer Segment
      • Chart on Comparison by Consumer Segment
      • Data Table on Comparison by Consumer Segment
    • 9.3 Health-Conscious Consumers - Market size and forecast (2023-2028)
      • Chart on Health-Conscious Consumers - Market size and forecast (2023-2028) ($ million)
      • Data Table on Health-Conscious Consumers - Market size and forecast (2023-2028) ($ million)
      • Chart on Health-Conscious Consumers - Year-over-year growth (2023-2028) (%)
      • Data Table on Health-Conscious Consumers - Year-over-year growth (2023-2028) (%)
    • 9.4 Vegans - Market size and forecast (2023-2028)
      • Chart on Vegans - Market size and forecast (2023-2028) ($ million)
      • Data Table on Vegans - Market size and forecast (2023-2028) ($ million)
      • Chart on Vegans - Year-over-year growth (2023-2028) (%)
      • Data Table on Vegans - Year-over-year growth (2023-2028) (%)
    • 9.5 Vegetarians - Market size and forecast (2023-2028)
      • Chart on Vegetarians - Market size and forecast (2023-2028) ($ million)
      • Data Table on Vegetarians - Market size and forecast (2023-2028) ($ million)
      • Chart on Vegetarians - Year-over-year growth (2023-2028) (%)
      • Data Table on Vegetarians - Year-over-year growth (2023-2028) (%)
    • 9.6 General Consumers - Market size and forecast (2023-2028)
      • Chart on General Consumers - Market size and forecast (2023-2028) ($ million)
      • Data Table on General Consumers - Market size and forecast (2023-2028) ($ million)
      • Chart on General Consumers - Year-over-year growth (2023-2028) (%)
      • Data Table on General Consumers - Year-over-year growth (2023-2028) (%)
    • 9.7 Market opportunity by Consumer Segment
      • Market opportunity by Consumer Segment ($ million)
      • Data Table on Market opportunity by Consumer Segment ($ million)

    9 Customer Landscape

    • 9.1 Customer landscape overview
      • Exhibit 85: Analysis of price sensitivity, lifecycle, customer purchase basket, adoption rates, and purchase criteria

    10 Drivers, Challenges, and Trends

    • 10.1 Market drivers
      • 10.2 Market challenges
        • 10.3 Impact of drivers and challenges
          • Exhibit 86: Impact of drivers and challenges in 2023 and 2028
        • 10.4 Market trends

          11 Vendor Landscape

          • 11.1 Overview
            • 11.2 Vendor landscape
              • Exhibit 87: Overview on Criticality of inputs and Factors of differentiation
            • 11.3 Landscape disruption
              • Exhibit 88: Overview on factors of disruption
            • 11.4 Industry risks
              • Exhibit 89: Impact of key risks on business

            12 Vendor Analysis

            • 12.1 Vendors covered
              • Exhibit 90: Vendors covered
            • 12.2 Market positioning of vendors
              • Exhibit 91: Matrix on vendor position and classification
            • 12.3 Amys Kitchen Inc.
              • Exhibit 92: Amys Kitchen Inc. - Overview
              • Exhibit 93: Amys Kitchen Inc. - Product / Service
              • Exhibit 94: Amys Kitchen Inc. - Key offerings
            • 12.4 Arla Foods amba
              • Exhibit 95: Arla Foods amba - Overview
              • Exhibit 96: Arla Foods amba - Business segments
              • Exhibit 97: Arla Foods amba - Key offerings
              • Exhibit 98: Arla Foods amba - Segment focus
            • 12.5 Aurora Organic Dairy
              • Exhibit 99: Aurora Organic Dairy - Overview
              • Exhibit 100: Aurora Organic Dairy - Product / Service
              • Exhibit 101: Aurora Organic Dairy - Key offerings
            • 12.6 Barilla G. e R. Fratelli Spa
              • Exhibit 102: Barilla G. e R. Fratelli Spa - Overview
              • Exhibit 103: Barilla G. e R. Fratelli Spa - Business segments
              • Exhibit 104: Barilla G. e R. Fratelli Spa - Key offerings
              • Exhibit 105: Barilla G. e R. Fratelli Spa - Segment focus
            • 12.7 Campbell Soup Co.
              • Exhibit 106: Campbell Soup Co. - Overview
              • Exhibit 107: Campbell Soup Co. - Business segments
              • Exhibit 108: Campbell Soup Co. - Key news
              • Exhibit 109: Campbell Soup Co. - Key offerings
              • Exhibit 110: Campbell Soup Co. - Segment focus
            • 12.8 Corporativo Bimbo SA de CV
              • Exhibit 111: Corporativo Bimbo SA de CV - Overview
              • Exhibit 112: Corporativo Bimbo SA de CV - Business segments
              • Exhibit 113: Corporativo Bimbo SA de CV - Key news
              • Exhibit 114: Corporativo Bimbo SA de CV - Key offerings
              • Exhibit 115: Corporativo Bimbo SA de CV - Segment focus
            • 12.9 Danone
              • Exhibit 116: Danone - Overview
              • Exhibit 117: Danone - Business segments
              • Exhibit 118: Danone - Key news
              • Exhibit 119: Danone - Key offerings
              • Exhibit 120: Danone - Segment focus
            • 12.10 General Mills Inc.
              • Exhibit 121: General Mills Inc. - Overview
              • Exhibit 122: General Mills Inc. - Business segments
              • Exhibit 123: General Mills Inc. - Key news
              • Exhibit 124: General Mills Inc. - Key offerings
              • Exhibit 125: General Mills Inc. - Segment focus
            • 12.11 Hormel Foods Corp.
              • Exhibit 126: Hormel Foods Corp. - Overview
              • Exhibit 127: Hormel Foods Corp. - Business segments
              • Exhibit 128: Hormel Foods Corp. - Key news
              • Exhibit 129: Hormel Foods Corp. - Key offerings
              • Exhibit 130: Hormel Foods Corp. - Segment focus
            • 12.12 LT Foods Ltd.
              • Exhibit 131: LT Foods Ltd. - Overview
              • Exhibit 132: LT Foods Ltd. - Business segments
              • Exhibit 133: LT Foods Ltd. - Key offerings
              • Exhibit 134: LT Foods Ltd. - Segment focus
            • 12.13 Nestle SA
              • Exhibit 135: Nestle SA - Overview
              • Exhibit 136: Nestle SA - Business segments
              • Exhibit 137: Nestle SA - Key news
              • Exhibit 138: Nestle SA - Key offerings
              • Exhibit 139: Nestle SA - Segment focus
            • 12.14 Organic Valley
              • Exhibit 140: Organic Valley - Overview
              • Exhibit 141: Organic Valley - Product / Service
              • Exhibit 142: Organic Valley - Key offerings
            • 12.15 The Hain Celestial Group Inc.
              • Exhibit 143: The Hain Celestial Group Inc. - Overview
              • Exhibit 144: The Hain Celestial Group Inc. - Business segments
              • Exhibit 145: The Hain Celestial Group Inc. - Key news
              • Exhibit 146: The Hain Celestial Group Inc. - Key offerings
              • Exhibit 147: The Hain Celestial Group Inc. - Segment focus
            • 12.16 The Hershey Co.
              • Exhibit 148: The Hershey Co. - Overview
              • Exhibit 149: The Hershey Co. - Business segments
              • Exhibit 150: The Hershey Co. - Key news
              • Exhibit 151: The Hershey Co. - Key offerings
              • Exhibit 152: The Hershey Co. - Segment focus
            • 12.17 Tyson Foods Inc.
              • Exhibit 153: Tyson Foods Inc. - Overview
              • Exhibit 154: Tyson Foods Inc. - Business segments
              • Exhibit 155: Tyson Foods Inc. - Key news
              • Exhibit 156: Tyson Foods Inc. - Key offerings
              • Exhibit 157: Tyson Foods Inc. - Segment focus

            13 Appendix

            • 13.1 Scope of the report
              • 13.2 Inclusions and exclusions checklist
                • Exhibit 158: Inclusions checklist
                • Exhibit 159: Exclusions checklist
              • 13.3 Currency conversion rates for US$
                • Exhibit 160: Currency conversion rates for US$
              • 13.4 Research methodology
                • Exhibit 161: Research methodology
                • Exhibit 162: Validation techniques employed for market sizing
                • Exhibit 163: Information sources
              • 13.5 List of abbreviations
                • Exhibit 164: List of abbreviations

              Research Methodology

              Technavio presents a detailed picture of the market by way of study, synthesis, and summation of data from multiple sources. The analysts have presented the various facets of the market with a particular focus on identifying the key industry influencers. The data thus presented is comprehensive, reliable, and the result of extensive research, both primary and secondary.

              INFORMATION SOURCES

              Primary sources

              • Manufacturers and suppliers
              • Channel partners
              • Industry experts
              • Strategic decision makers

              Secondary sources

              • Industry journals and periodicals
              • Government data
              • Financial reports of key industry players
              • Historical data
              • Press releases

              DATA ANALYSIS

              Data Synthesis

              • Collation of data
              • Estimation of key figures
              • Analysis of derived insights

              Data Validation

              • Triangulation with data models
              • Reference against proprietary databases
              • Corroboration with industry experts

              REPORT WRITING

              Qualitative

              • Market drivers
              • Market challenges
              • Market trends
              • Five forces analysis

              Quantitative

              • Market size and forecast
              • Market segmentation
              • Geographical insights
              • Competitive landscape

              Interested in this report?

              Get your sample now to see our research methodology and insights!

              Download Now

              Frequently Asked Questions

              Organic Packaged Foodin US market growth will increase by $ 7.40 bn during 2024-2028 .

              The Organic Packaged Foodin US market is expected to grow at a CAGR of 7.65% during 2024-2028 .

              Organic Packaged Foodin US market is segmented by Product( Dairy bakery and confectionaries, Meat seafood fruits and vegetables, Sauces dressings condiments and spreads, Others) Packaging( Flexible packaging, Rigid packaging, Paperboard packaging, Metal packaging) Distribution Channel( Offline, Online, Supermarkets and Hypermarkets, Specialty Stores, Convenience Stores)

              Amys Kitchen Inc., Arla Foods amba, Aurora Organic Dairy, Barilla G. e R. Fratelli Spa, Campbell Soup Co., Corporativo Bimbo SA de CV, Danone, DAVES KILLER BREAD, Flowers Foods Inc., General Mills Inc., LT Foods Ltd., Nestle SA, Organic Valley, Perdue Farms Inc., The Hain Celestial Group Inc., The Hershey Co., Tyson Foods Inc., Hormel Foods Corp. are a few of the key vendors in the Organic Packaged Foodin US market.

              North America will register the highest growth rate of 100% among the other regions. Therefore, the Organic Packaged Foodin US market in North America is expected to garner significant business opportunities for the vendors during the forecast period.

              US, North America

              • Growing awareness about health benefits of organic foodsGrowing awareness about the health benefits of organic foods is a significant driver of the organic packaged food market in US. Consumers are increasingly concerned about the potential health risks associated with conventional farming practices is the driving factor this market.
              • such as the use of synthetic pesticides is the driving factor this market.
              • hormones is the driving factor this market.
              • and GMOs. Organic packaged foods are perceived as healthier alternatives because they are produced without the use of these potentially harmful substances. Consumers are becoming more informed about the nutritional value of organic foods is the driving factor this market.
              • which are often richer in vitamins is the driving factor this market.
              • minerals is the driving factor this market.
              • and antioxidants compared with their conventional counterparts. Additionally is the driving factor this market.
              • organic farming practices promote soil health is the driving factor this market.
              • biodiversity is the driving factor this market.
              • and sustainable agriculture is the driving factor this market.
              • which further contribute to the perceived health benefits of organic foods. The growing interest in wellness and preventive healthcare has fueled the demand for organic packaged foods among health-conscious consumers seeking to improve their diets and overall wellbeing. As a result is the driving factor this market.
              • food manufacturers and retailers are increasingly expanding their organic product offerings to meet this demand is the driving factor this market.
              • driving the growth of the organic packaged food market in US during the forecast period. is the driving factor this market.

              The Organic Packaged Foodin US market vendors should focus on grabbing business opportunities from the Dairy bakery and confectionaries segment as it accounted for the largest market share in the base year.