User Provisioning Software Market Analysis, Size, and Forecast 2026-2030: North America (US, Canada, and Mexico), Europe (Germany, UK, and France), APAC (China, India, and Japan), Middle East and Africa (Saudi Arabia, UAE, and South Africa), South America (Brazil and Argentina), and Rest of World (ROW)

User Provisioning Software Market Analysis, Size, and Forecast 2026-2030:
North America (US, Canada, and Mexico), Europe (Germany, UK, and France), APAC (China, India, and Japan), Middle East and Africa (Saudi Arabia, UAE, and South Africa), South America (Brazil and Argentina), and Rest of World (ROW)

Published: Apr 2026 302 Pages SKU: IRTNTR73299

Market Overview at a Glance

$4.55 B
Market Opportunity
7.1%
CAGR 2025 - 2030
45.1%
North America Growth
$4.49 B
BFSI segment 2024

User Provisioning Software Market Size 2026-2030

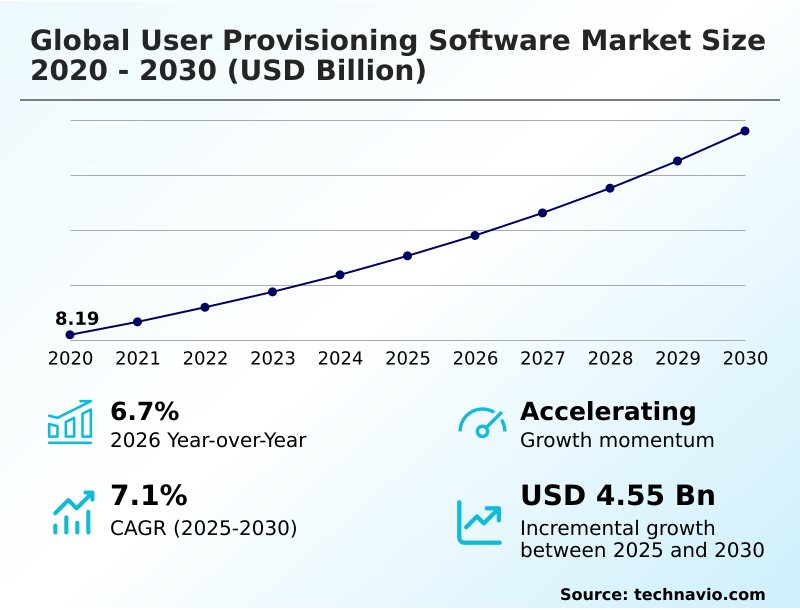
The user provisioning software market size is valued to increase by USD 4.55 billion, at a CAGR of 7.1% from 2025 to 2030. Accelerated transition to zero trust architecture and continuous verification will drive the user provisioning software market.

Major Market Trends & Insights

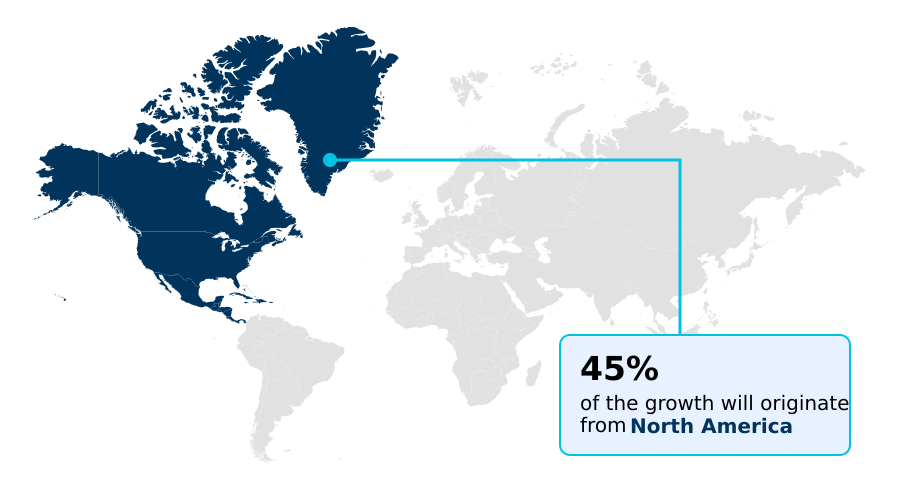
  • North America dominated the market and accounted for a 45.1% growth during the forecast period.
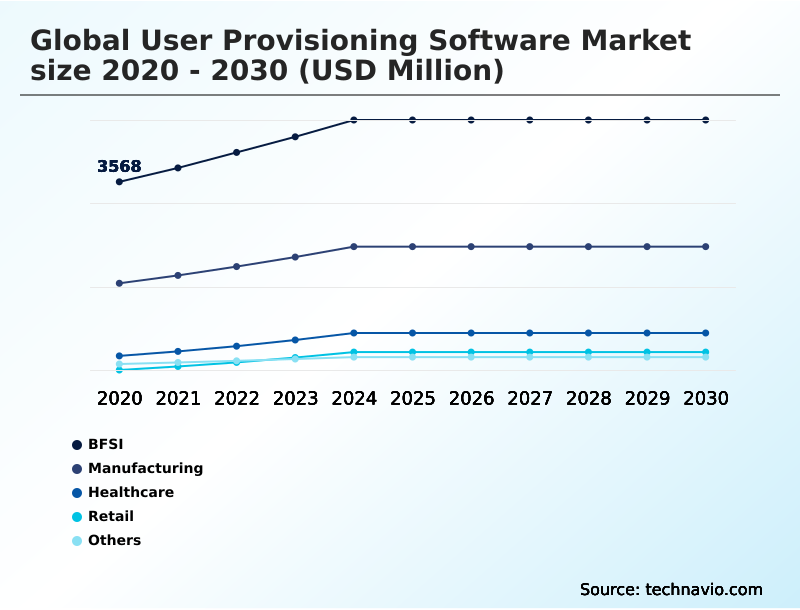
  • By End-user - BFSI segment was valued at USD 4.49 billion in 2024
  • By Type - Role-based provisioning segment accounted for the largest market revenue share in 2024

Market Size & Forecast

  • Market Opportunities: USD 7.41 billion
  • Market Future Opportunities: USD 4.55 billion
  • CAGR from 2025 to 2030 : 7.1%

Market Summary

  • The user provisioning software market is fundamentally reshaping enterprise security by automating the management of digital identities across complex IT ecosystems. This evolution is driven by the shift away from manual, error-prone processes toward automated workflows that enforce security policies consistently.
  • A core driver is the widespread adoption of zero trust security models, which demand continuous verification of every user and device, making automated provisioning a strategic necessity.
  • For instance, a multinational financial institution can leverage these solutions to instantly grant a new trader role-based access to specific applications while simultaneously creating a complete, unalterable audit trail for compliance, a process that once took days.
  • Trends such as the integration of AI for behavioral analytics and the pressing need to govern non-human identities, like bots and APIs, are pushing the boundaries of what these platforms can achieve. However, challenges persist, including the complexities of integrating with legacy systems and navigating a fragmented global regulatory landscape.
  • These tools are no longer just an IT convenience but a critical component of modern risk management, balancing operational agility with a robust defense against sophisticated identity-based threats like credential stuffing and session hijacking.

What will be the Size of the User Provisioning Software Market during the forecast period?

Get Key Insights on Market Forecast (PDF) Request Free Sample

How is the User Provisioning Software Market Segmented?

The user provisioning software industry research report provides comprehensive data (region-wise segment analysis), with forecasts and estimates in "USD million" for the period 2026-2030, as well as historical data from 2020-2024 for the following segments.

  • End-user
    • BFSI
    • Manufacturing
    • Healthcare
    • Retail
    • Others
  • Type
    • Role-based provisioning
    • Account-based provisioning
    • Self-service provisioning
  • Deployment
    • On-premises
    • Cloud
  • Geography
    • North America
      • US
      • Canada
      • Mexico
    • Europe
      • Germany
      • UK
      • France
    • APAC
      • China
      • India
      • Japan
    • Middle East and Africa
      • Saudi Arabia
      • UAE
      • South Africa
    • South America
      • Brazil
      • Argentina
    • Rest of World (ROW)

By End-user Insights

The bfsi segment is estimated to witness significant growth during the forecast period.

The banking, financial services, and insurance sector is a primary adopter of advanced user provisioning software, driven by stringent regulatory frameworks and the critical need to secure sensitive data.

These organizations prioritize automated onboarding and offboarding and identity governance and administration (iga) to enforce the principle of least privilege and maintain compliance with mandates like sarbanes-oxley.

The adoption of identity first security models, integrating solutions for automated credential rotation, is essential for mitigating risks from both internal and external threats.

Implementing ai-driven behavioral analytics allows for continuous identity verification, with some institutions reporting a reduction in access certification times by over 60%, significantly improving operational efficiency and the overall security posture through robust entitlement management and a unified identity control plane.

Request Free Sample

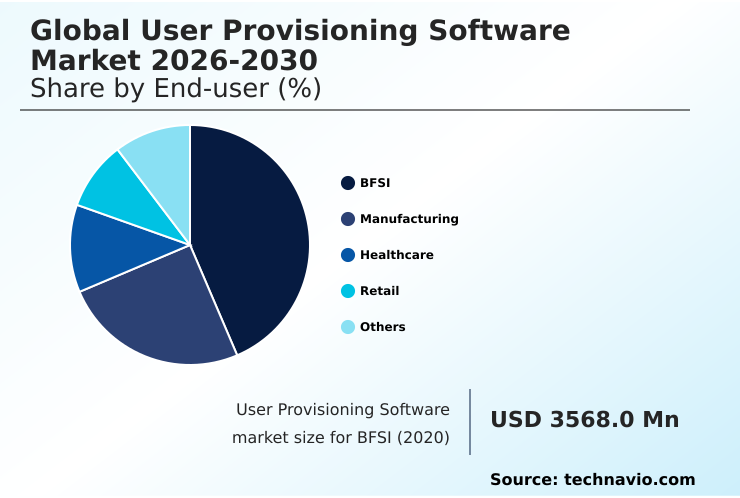
The BFSI segment was valued at USD 4.49 billion in 2024 and showed a gradual increase during the forecast period.

Request Free Sample

Regional Analysis

North America is estimated to contribute 45.1% to the growth of the global market during the forecast period.Technavio’s analysts have elaborately explained the regional trends and drivers that shape the market during the forecast period.

See How User Provisioning Software Market Demand is Rising in North America Request Free Sample

The geographic landscape of the user provisioning software market shows distinct regional dynamics, with North America leading adoption, accounting for over 45% of the market opportunity.

This maturity is driven by early adoption of zero trust architecture and stringent regulatory pressures.

In contrast, the APAC region, representing nearly 24% of the opportunity, is the fastest-growing market, fueled by widespread digital transformation and the growth of cloud-native businesses.

Europe, contributing over 21%, is heavily influenced by data sovereignty mandates like GDPR, which demand robust solutions for geo-fencing policies and automated deprovisioning.

Across mature markets, the integration of privileged access management (PAM) and advanced role-based access control (RBAC) has improved security efficiency, with organizations reporting up to a 60% reduction in time spent on access certification reviews.

Market Dynamics

Our researchers analyzed the data with 2025 as the base year, along with the key drivers, trends, and challenges. A holistic analysis of drivers will help companies refine their marketing strategies to gain a competitive advantage.

  • The evolution of the user provisioning software market reflects a strategic progression from managing identities in controlled, internal environments to governing access across a borderless digital ecosystem. Initially, the focus was on user provisioning for on-premises systems, but the rise of hybrid IT necessitated advanced solutions for user provisioning for hybrid infrastructure.
  • Today, the challenge has expanded to user provisioning for cloud-native applications and user provisioning for SaaS applications, where automated workflows are critical. This is especially true for automating access for remote workforces, a now-standard operational model.
  • Security has concurrently become more sophisticated, moving beyond basic access control to securing non-human and machine identities and enforcing the principle of least privilege automatically. For highly regulated sectors, user lifecycle automation for BFSI is a key application.
  • Modern platforms achieve this through identity governance for regulatory compliance and advanced capabilities like AI integration for autonomous identity governance and just-in-time access for contractors. Integrating identity threat detection and response integration into provisioning workflows is now a key differentiator. The complexity extends to user provisioning for operational technology, where security is paramount.
  • Overall, the goal is to achieve seamless integration, from synchronizing identities from HR systems to managing entitlements in hybrid IT and automating deprovisioning for employee offboarding. Companies that master automated compliance for data sovereignty and manage identity across multi-cloud environments have demonstrated audit readiness in less than half the time of their peers.
  • This is made possible through effective role-based provisioning for enterprise-scale and the implementation of self-service provisioning portal implementation, which combines robust privileged access management integration with user autonomy.

What are the key market drivers leading to the rise in the adoption of User Provisioning Software Industry?

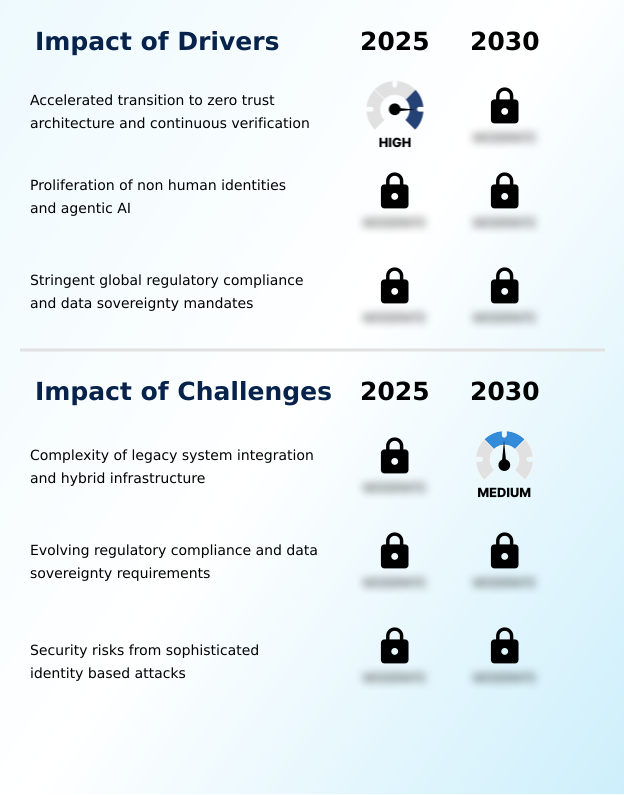
  • A key driver for the market is the accelerated transition toward zero trust architectures and the adoption of continuous verification protocols.

  • Market growth is primarily propelled by the enterprise-wide shift to identity-first security models, where continuous identity verification is paramount. This driver is a direct response to a threat landscape where over 80% of breaches involve compromised credentials.
  • The proliferation of non-human identities, which now outnumber human users by a significant margin in many cloud-native environments, necessitates automated governance frameworks to prevent identity sprawl.
  • Furthermore, stringent regulatory pressures, including data sovereignty mandates, compel organizations to adopt solutions that offer automated compliance and detailed audit trails.
  • Implementing automated user lifecycle management has been shown to reduce compliance reporting costs by up to 50% while ensuring adherence to complex legal requirements through robust secrets management and access certifications.

What are the market trends shaping the User Provisioning Software Industry?

  • The integration of AI and ML for autonomous identity governance is emerging as a significant market trend, transforming reactive administration into proactive, intelligent control.

  • Key market trends are reshaping identity management, with a pronounced shift toward proactive, intelligent systems. The infusion of AI and machine learning into user provisioning platforms enables autonomous identity governance, which has been shown to reduce policy violations by over 75% through predictive analysis of peer group activities and segregation of duty violations.
  • This trend is crucial for managing workload identities and other non-human identities. Another significant development is the expansion of frameworks to include just-in-time provisioning, ensuring that access for all identities is granted on a least-privilege basis. This approach is critical as organizations adopt passwordless authentication and adaptive access policies.
  • These trends have improved identity-related threat detection rates by more than 40% in early-adopter organizations, strengthening their overall security.

What challenges does the User Provisioning Software Industry face during its growth?

  • A key challenge affecting industry growth is the complexity associated with integrating modern solutions with legacy systems and hybrid infrastructures.

  • Significant challenges persist, primarily stemming from the complexity of legacy system integration within modern IT ecosystems. Attempts to connect cloud-native identity solutions with older, on-premises systems using protocols like system for cross-domain identity management (scim) can increase project deployment times by over 60% due to issues like inconsistent attribute mapping.
  • Navigating the evolving landscape of global regulations, such as right-to-be-forgotten compliance, also presents a major hurdle. Furthermore, the platforms themselves are high-value targets for sophisticated identity-based attack vectors, including AI-driven impersonation and attacks targeting robotic process automation bots.
  • With identity-related breaches accounting for a substantial portion of security incidents, maintaining a resilient defense through continuous monitoring and proactive threat detection remains a critical and resource-intensive challenge.

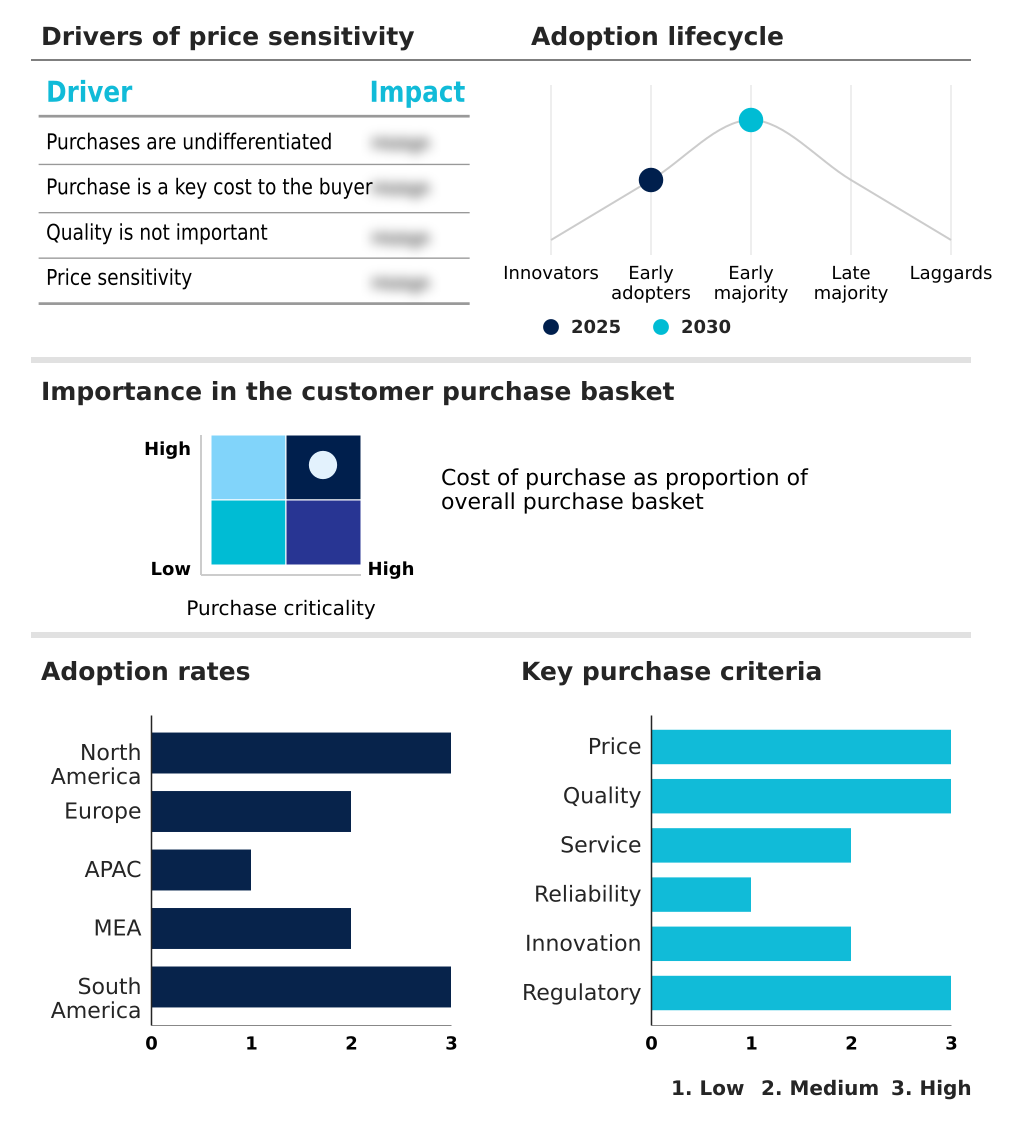
Exclusive Technavio Analysis on Customer Landscape

The user provisioning software market forecasting report includes the adoption lifecycle of the market, covering from the innovator’s stage to the laggard’s stage. It focuses on adoption rates in different regions based on penetration. Furthermore, the user provisioning software market report also includes key purchase criteria and drivers of price sensitivity to help companies evaluate and develop their market growth analysis strategies.

Customer Landscape of User Provisioning Software Industry

Competitive Landscape

Companies are implementing various strategies, such as strategic alliances, user provisioning software market forecast, partnerships, mergers and acquisitions, geographical expansion, and product/service launches, to enhance their presence in the industry.

Atos SE - Specializing in identity security solutions to protect privileged credentials, manage entitlements, and secure access for human and machine identities in complex cloud infrastructures.

The industry research and growth report includes detailed analyses of the competitive landscape of the market and information about key companies, including:

  • Atos SE
  • Avatier Corp.
  • Broadcom Inc.
  • Centrify Corp.
  • CyberArk Software Ltd.
  • Dell Technologies Inc.
  • EmpowerID Inc.
  • Happiest Minds Technologies Ltd.
  • Hitachi Ltd.
  • IBM Corp.
  • Microsoft Corp.
  • Motorola Solutions Inc.
  • Okta Inc.
  • Oracle Corp.
  • Quest Software Inc.
  • Rippling People Center Inc.
  • SailPoint Technologies Inc.
  • SAP SE
  • SolarWinds Corp.
  • Zoho Corp. Pvt. Ltd.

Qualitative and quantitative analysis of companies has been conducted to help clients understand the wider business environment as well as the strengths and weaknesses of key industry players. Data is qualitatively analyzed to categorize companies as pure play, category-focused, industry-focused, and diversified; it is quantitatively analyzed to categorize companies as dominant, leading, strong, tentative, and weak.

Recent Development and News in User provisioning software market

  • In November 2024, IBM Corp. introduced new AI-driven identity governance and user lifecycle automation features within its security identity platform, enhancing automated user provisioning and access governance for enterprise IT environments.
  • In December 2024, the Chilean government finalized its register of operators of vital importance, identifying over nine hundred organizations that must now implement rigorous security management systems, including advanced identity governance and automated provisioning tools.
  • In January 2025, Okta Inc. announced the global release of its next-generation Identity Governance platform, which incorporates advanced automated role discovery and lifecycle management capabilities to support intelligent automation.
  • In March 2025, SailPoint Technologies Inc. introduced its Shadow AI Remediation solution, a cloud-driven governance framework emphasizing the need for hybrid visibility to monitor users on private, on-premises networks for unauthorized AI tool usage.

Dive into Technavio’s robust research methodology, blending expert interviews, extensive data synthesis, and validated models for unparalleled User Provisioning Software Market insights. See full methodology.

Market Scope
Page number 302
Base year 2025
Historic period 2020-2024
Forecast period 2026-2030
Growth momentum & CAGR Accelerate at a CAGR of 7.1%
Market growth 2026-2030 USD 4546.2 million
Market structure Fragmented
YoY growth 2025-2026(%) 6.7%
Key countries US, Canada, Mexico, Germany, UK, France, Italy, Spain, The Netherlands, China, India, Japan, South Korea, Australia, Indonesia, Saudi Arabia, UAE, South Africa, Israel, Egypt, Brazil, Argentina and Chile
Competitive landscape Leading Companies, Market Positioning of Companies, Competitive Strategies, and Industry Risks

Request Free Sample

Research Analyst Overview

  • The user provisioning software market has transitioned from a back-office IT function to a cornerstone of enterprise cybersecurity strategy, directly influencing boardroom decisions on risk and compliance. The adoption of a zero trust architecture is no longer optional, making continuous identity verification and robust access request workflows essential.
  • Advanced platforms now integrate identity governance and administration (IGA), privileged access management (PAM), and identity threat detection and response (ITDR) into a cohesive identity fabric. This convergence addresses the challenge of managing an expanding landscape of non-human identities and agentic AI through sophisticated secrets management and automated credential rotation.
  • A key boardroom consideration is the impact of these technologies on compliance with evolving data sovereignty mandates. By leveraging autonomous identity governance and role-based access control (RBAC), organizations are not only strengthening their security posture with features like multi-factor authentication (MFA) and single sign-on (SSO) but also realizing significant operational efficiencies.
  • Some have achieved over a 60% reduction in access certification times, directly impacting operational costs. Effective user lifecycle management, including automated onboarding and offboarding, is critical for mitigating risks from outdated permissions.

What are the Key Data Covered in this User Provisioning Software Market Research and Growth Report?

  • What is the expected growth of the User Provisioning Software Market between 2026 and 2030?

    • USD 4.55 billion, at a CAGR of 7.1%

  • What segmentation does the market report cover?

    • The report is segmented by End-user (BFSI, Manufacturing, Healthcare, Retail, and Others), Type (Role-based provisioning, Account-based provisioning, and Self-service provisioning), Deployment (On-premises, and Cloud) and Geography (North America, Europe, APAC, Middle East and Africa, South America)

  • Which regions are analyzed in the report?

    • North America, Europe, APAC, Middle East and Africa and South America

  • What are the key growth drivers and market challenges?

    • Accelerated transition to zero trust architecture and continuous verification, Complexity of legacy system integration and hybrid infrastructure

  • Who are the major players in the User Provisioning Software Market?

    • Atos SE, Avatier Corp., Broadcom Inc., Centrify Corp., CyberArk Software Ltd., Dell Technologies Inc., EmpowerID Inc., Happiest Minds Technologies Ltd., Hitachi Ltd., IBM Corp., Microsoft Corp., Motorola Solutions Inc., Okta Inc., Oracle Corp., Quest Software Inc., Rippling People Center Inc., SailPoint Technologies Inc., SAP SE, SolarWinds Corp. and Zoho Corp. Pvt. Ltd.

Market Research Insights

  • The market is defined by a dynamic push toward identity-centric security models that prioritize automated governance and risk mitigation. Organizations are adopting dynamic policy-based access and just-in-time access, which has been shown to reduce excessive permissions and strengthen security posture.
  • This shift, which supports credential abuse mitigation, has resulted in a 40% reduction in security incidents related to compromised accounts in some firms. Furthermore, automated onboarding and offboarding and identity data synchronization have streamlined user lifecycle management, with some enterprises reporting up to a 60% decrease in help desk tickets for access-related issues.
  • The focus on preventing identity sprawl and implementing a self-healing identity ecosystem through user behavior analytics is essential for managing both on-premises and cloud-based deployments and achieving a unified security framework.

We can help! Our analysts can customize this user provisioning software market research report to meet your requirements.

Get in touch

1. Executive Summary

1.1 Market overview

Executive Summary - Chart on Market Overview
Executive Summary - Data Table on Market Overview
Executive Summary - Chart on Global Market Characteristics
Executive Summary - Chart on Market by Geography
Executive Summary - Chart on Market Segmentation by End-user
Executive Summary - Chart on Market Segmentation by Type
Executive Summary - Chart on Market Segmentation by Deployment
Executive Summary - Chart on Incremental Growth
Executive Summary - Data Table on Incremental Growth
Executive Summary - Chart on Company Market Positioning

2. Technavio Analysis

2.1 Analysis of price sensitivity, lifecycle, customer purchase basket, adoption rates, and purchase criteria

2.2 Criticality of inputs and Factors of differentiation

Chart on Overview on criticality of inputs and factors of differentiation

2.3 Factors of disruption

Chart on Overview on factors of disruption

2.4 Impact of drivers and challenges

Chart on Impact of drivers and challenges in 2025 and 2030

3. Market Landscape

3.1 Market ecosystem

Chart on Parent Market
Data Table on - Parent Market

3.2 Market characteristics

Chart on Market characteristics analysis

3.3 Value chain analysis

Chart on Value chain analysis

4. Market Sizing

4.1 Market definition

Data Table on Offerings of companies included in the market definition

4.2 Market segment analysis

Market segments

4.3 Market size 2025

4.4 Market outlook: Forecast for 2025-2030

Chart on Global - Market size and forecast 2025-2030 ($ million)
Data Table on Global - Market size and forecast 2025-2030 ($ million)
Chart on Global Market: Year-over-year growth 2025-2030 (%)
Data Table on Global Market: Year-over-year growth 2025-2030 (%)

5. Historic Market Size

5.1 Global User Provisioning Software Market 2020 - 2024

Historic Market Size - Data Table on Global User Provisioning Software Market 2020 - 2024 ($ million)

5.2 End-user segment analysis 2020 - 2024

Historic Market Size - End-user Segment 2020 - 2024 ($ million)

5.3 Type segment analysis 2020 - 2024

Historic Market Size - Type Segment 2020 - 2024 ($ million)

5.4 Deployment segment analysis 2020 - 2024

Historic Market Size - Deployment Segment 2020 - 2024 ($ million)

5.5 Geography segment analysis 2020 - 2024

Historic Market Size - Geography Segment 2020 - 2024 ($ million)

5.6 Country segment analysis 2020 - 2024

Historic Market Size - Country Segment 2020 - 2024 ($ million)

6. Qualitative Analysis

6.1 Impact of AI on global user provisioning software market

6.2 Impact of geopolitical conflicts on global user provisioning software market

7. Five Forces Analysis

7.1 Five forces summary

Five forces analysis - Comparison between 2025 and 2030

7.2 Bargaining power of buyers

Bargaining power of buyers - Impact of key factors 2025 and 2030

7.3 Bargaining power of suppliers

Bargaining power of suppliers - Impact of key factors in 2025 and 2030

7.4 Threat of new entrants

Threat of new entrants - Impact of key factors in 2025 and 2030

7.5 Threat of substitutes

Threat of substitutes - Impact of key factors in 2025 and 2030

7.6 Threat of rivalry

Threat of rivalry - Impact of key factors in 2025 and 2030

7.7 Market condition

Chart on Market condition - Five forces 2025 and 2030

8. Market Segmentation by End-user

8.1 Market segments

Chart on End-user - Market share 2025-2030 (%)
Data Table on End-user - Market share 2025-2030 (%)

8.2 Comparison by End-user

Chart on Comparison by End-user
Data Table on Comparison by End-user

8.3 BFSI - Market size and forecast 2025-2030

Chart on BFSI - Market size and forecast 2025-2030 ($ million)
Data Table on BFSI - Market size and forecast 2025-2030 ($ million)
Chart on BFSI - Year-over-year growth 2025-2030 (%)
Data Table on BFSI - Year-over-year growth 2025-2030 (%)

8.4 Manufacturing - Market size and forecast 2025-2030

Chart on Manufacturing - Market size and forecast 2025-2030 ($ million)
Data Table on Manufacturing - Market size and forecast 2025-2030 ($ million)
Chart on Manufacturing - Year-over-year growth 2025-2030 (%)
Data Table on Manufacturing - Year-over-year growth 2025-2030 (%)

8.5 Healthcare - Market size and forecast 2025-2030

Chart on Healthcare - Market size and forecast 2025-2030 ($ million)
Data Table on Healthcare - Market size and forecast 2025-2030 ($ million)
Chart on Healthcare - Year-over-year growth 2025-2030 (%)
Data Table on Healthcare - Year-over-year growth 2025-2030 (%)

8.6 Retail - Market size and forecast 2025-2030

Chart on Retail - Market size and forecast 2025-2030 ($ million)
Data Table on Retail - Market size and forecast 2025-2030 ($ million)
Chart on Retail - Year-over-year growth 2025-2030 (%)
Data Table on Retail - Year-over-year growth 2025-2030 (%)

8.7 Others - Market size and forecast 2025-2030

Chart on Others - Market size and forecast 2025-2030 ($ million)
Data Table on Others - Market size and forecast 2025-2030 ($ million)
Chart on Others - Year-over-year growth 2025-2030 (%)
Data Table on Others - Year-over-year growth 2025-2030 (%)

8.8 Market opportunity by End-user

Market opportunity by End-user ($ million)
Data Table on Market opportunity by End-user ($ million)

9. Market Segmentation by Type

9.1 Market segments

Chart on Type - Market share 2025-2030 (%)
Data Table on Type - Market share 2025-2030 (%)

9.2 Comparison by Type

Chart on Comparison by Type
Data Table on Comparison by Type

9.3 Role-based provisioning - Market size and forecast 2025-2030

Chart on Role-based provisioning - Market size and forecast 2025-2030 ($ million)
Data Table on Role-based provisioning - Market size and forecast 2025-2030 ($ million)
Chart on Role-based provisioning - Year-over-year growth 2025-2030 (%)
Data Table on Role-based provisioning - Year-over-year growth 2025-2030 (%)

9.4 Account-based provisioning - Market size and forecast 2025-2030

Chart on Account-based provisioning - Market size and forecast 2025-2030 ($ million)
Data Table on Account-based provisioning - Market size and forecast 2025-2030 ($ million)
Chart on Account-based provisioning - Year-over-year growth 2025-2030 (%)
Data Table on Account-based provisioning - Year-over-year growth 2025-2030 (%)

9.5 Self-service provisioning - Market size and forecast 2025-2030

Chart on Self-service provisioning - Market size and forecast 2025-2030 ($ million)
Data Table on Self-service provisioning - Market size and forecast 2025-2030 ($ million)
Chart on Self-service provisioning - Year-over-year growth 2025-2030 (%)
Data Table on Self-service provisioning - Year-over-year growth 2025-2030 (%)

9.6 Market opportunity by Type

Market opportunity by Type ($ million)
Data Table on Market opportunity by Type ($ million)

10. Market Segmentation by Deployment

10.1 Market segments

Chart on Deployment - Market share 2025-2030 (%)
Data Table on Deployment - Market share 2025-2030 (%)

10.2 Comparison by Deployment

Chart on Comparison by Deployment
Data Table on Comparison by Deployment

10.3 On-premises - Market size and forecast 2025-2030

Chart on On-premises - Market size and forecast 2025-2030 ($ million)
Data Table on On-premises - Market size and forecast 2025-2030 ($ million)
Chart on On-premises - Year-over-year growth 2025-2030 (%)
Data Table on On-premises - Year-over-year growth 2025-2030 (%)

10.4 Cloud - Market size and forecast 2025-2030

Chart on Cloud - Market size and forecast 2025-2030 ($ million)
Data Table on Cloud - Market size and forecast 2025-2030 ($ million)
Chart on Cloud - Year-over-year growth 2025-2030 (%)
Data Table on Cloud - Year-over-year growth 2025-2030 (%)

10.5 Market opportunity by Deployment

Market opportunity by Deployment ($ million)
Data Table on Market opportunity by Deployment ($ million)

11. Customer Landscape

11.1 Customer landscape overview

Analysis of price sensitivity, lifecycle, customer purchase basket, adoption rates, and purchase criteria

12. Geographic Landscape

12.1 Geographic segmentation

Chart on Market share by geography 2025-2030 (%)
Data Table on Market share by geography 2025-2030 (%)

12.2 Geographic comparison

Chart on Geographic comparison
Data Table on Geographic comparison

12.3 North America - Market size and forecast 2025-2030

Chart on North America - Market size and forecast 2025-2030 ($ million)
Data Table on North America - Market size and forecast 2025-2030 ($ million)
Chart on North America - Year-over-year growth 2025-2030 (%)
Data Table on North America - Year-over-year growth 2025-2030 (%)
Chart on Regional Comparison - North America
Data Table on Regional Comparison - North America

12.3.1 US - Market size and forecast 2025-2030

Chart on US - Market size and forecast 2025-2030 ($ million)
Data Table on US - Market size and forecast 2025-2030 ($ million)
Chart on US - Year-over-year growth 2025-2030 (%)
Data Table on US - Year-over-year growth 2025-2030 (%)

12.3.2 Canada - Market size and forecast 2025-2030

Chart on Canada - Market size and forecast 2025-2030 ($ million)
Data Table on Canada - Market size and forecast 2025-2030 ($ million)
Chart on Canada - Year-over-year growth 2025-2030 (%)
Data Table on Canada - Year-over-year growth 2025-2030 (%)

12.3.3 Mexico - Market size and forecast 2025-2030

Chart on Mexico - Market size and forecast 2025-2030 ($ million)
Data Table on Mexico - Market size and forecast 2025-2030 ($ million)
Chart on Mexico - Year-over-year growth 2025-2030 (%)
Data Table on Mexico - Year-over-year growth 2025-2030 (%)

12.4 Europe - Market size and forecast 2025-2030

Chart on Europe - Market size and forecast 2025-2030 ($ million)
Data Table on Europe - Market size and forecast 2025-2030 ($ million)
Chart on Europe - Year-over-year growth 2025-2030 (%)
Data Table on Europe - Year-over-year growth 2025-2030 (%)
Chart on Regional Comparison - Europe
Data Table on Regional Comparison - Europe

12.4.1 Germany - Market size and forecast 2025-2030

Chart on Germany - Market size and forecast 2025-2030 ($ million)
Data Table on Germany - Market size and forecast 2025-2030 ($ million)
Chart on Germany - Year-over-year growth 2025-2030 (%)
Data Table on Germany - Year-over-year growth 2025-2030 (%)

12.4.2 UK - Market size and forecast 2025-2030

Chart on UK - Market size and forecast 2025-2030 ($ million)
Data Table on UK - Market size and forecast 2025-2030 ($ million)
Chart on UK - Year-over-year growth 2025-2030 (%)
Data Table on UK - Year-over-year growth 2025-2030 (%)

12.4.3 France - Market size and forecast 2025-2030

Chart on France - Market size and forecast 2025-2030 ($ million)
Data Table on France - Market size and forecast 2025-2030 ($ million)
Chart on France - Year-over-year growth 2025-2030 (%)
Data Table on France - Year-over-year growth 2025-2030 (%)

12.4.4 Italy - Market size and forecast 2025-2030

Chart on Italy - Market size and forecast 2025-2030 ($ million)
Data Table on Italy - Market size and forecast 2025-2030 ($ million)
Chart on Italy - Year-over-year growth 2025-2030 (%)
Data Table on Italy - Year-over-year growth 2025-2030 (%)

12.4.5 Spain - Market size and forecast 2025-2030

Chart on Spain - Market size and forecast 2025-2030 ($ million)
Data Table on Spain - Market size and forecast 2025-2030 ($ million)
Chart on Spain - Year-over-year growth 2025-2030 (%)
Data Table on Spain - Year-over-year growth 2025-2030 (%)

12.4.6 The Netherlands - Market size and forecast 2025-2030

Chart on The Netherlands - Market size and forecast 2025-2030 ($ million)
Data Table on The Netherlands - Market size and forecast 2025-2030 ($ million)
Chart on The Netherlands - Year-over-year growth 2025-2030 (%)
Data Table on The Netherlands - Year-over-year growth 2025-2030 (%)

12.5 APAC - Market size and forecast 2025-2030

Chart on APAC - Market size and forecast 2025-2030 ($ million)
Data Table on APAC - Market size and forecast 2025-2030 ($ million)
Chart on APAC - Year-over-year growth 2025-2030 (%)
Data Table on APAC - Year-over-year growth 2025-2030 (%)
Chart on Regional Comparison - APAC
Data Table on Regional Comparison - APAC

12.5.1 China - Market size and forecast 2025-2030

Chart on China - Market size and forecast 2025-2030 ($ million)
Data Table on China - Market size and forecast 2025-2030 ($ million)
Chart on China - Year-over-year growth 2025-2030 (%)
Data Table on China - Year-over-year growth 2025-2030 (%)

12.5.2 India - Market size and forecast 2025-2030

Chart on India - Market size and forecast 2025-2030 ($ million)
Data Table on India - Market size and forecast 2025-2030 ($ million)
Chart on India - Year-over-year growth 2025-2030 (%)
Data Table on India - Year-over-year growth 2025-2030 (%)

12.5.3 Japan - Market size and forecast 2025-2030

Chart on Japan - Market size and forecast 2025-2030 ($ million)
Data Table on Japan - Market size and forecast 2025-2030 ($ million)
Chart on Japan - Year-over-year growth 2025-2030 (%)
Data Table on Japan - Year-over-year growth 2025-2030 (%)

12.5.4 South Korea - Market size and forecast 2025-2030

Chart on South Korea - Market size and forecast 2025-2030 ($ million)
Data Table on South Korea - Market size and forecast 2025-2030 ($ million)
Chart on South Korea - Year-over-year growth 2025-2030 (%)
Data Table on South Korea - Year-over-year growth 2025-2030 (%)

12.5.5 Australia - Market size and forecast 2025-2030

Chart on Australia - Market size and forecast 2025-2030 ($ million)
Data Table on Australia - Market size and forecast 2025-2030 ($ million)
Chart on Australia - Year-over-year growth 2025-2030 (%)
Data Table on Australia - Year-over-year growth 2025-2030 (%)

12.5.6 Indonesia - Market size and forecast 2025-2030

Chart on Indonesia - Market size and forecast 2025-2030 ($ million)
Data Table on Indonesia - Market size and forecast 2025-2030 ($ million)
Chart on Indonesia - Year-over-year growth 2025-2030 (%)
Data Table on Indonesia - Year-over-year growth 2025-2030 (%)

12.6 Middle East and Africa - Market size and forecast 2025-2030

Chart on Middle East and Africa - Market size and forecast 2025-2030 ($ million)
Data Table on Middle East and Africa - Market size and forecast 2025-2030 ($ million)
Chart on Middle East and Africa - Year-over-year growth 2025-2030 (%)
Data Table on Middle East and Africa - Year-over-year growth 2025-2030 (%)
Chart on Regional Comparison - Middle East and Africa
Data Table on Regional Comparison - Middle East and Africa

12.6.1 Saudi Arabia - Market size and forecast 2025-2030

Chart on Saudi Arabia - Market size and forecast 2025-2030 ($ million)
Data Table on Saudi Arabia - Market size and forecast 2025-2030 ($ million)
Chart on Saudi Arabia - Year-over-year growth 2025-2030 (%)
Data Table on Saudi Arabia - Year-over-year growth 2025-2030 (%)

12.6.2 UAE - Market size and forecast 2025-2030

Chart on UAE - Market size and forecast 2025-2030 ($ million)
Data Table on UAE - Market size and forecast 2025-2030 ($ million)
Chart on UAE - Year-over-year growth 2025-2030 (%)
Data Table on UAE - Year-over-year growth 2025-2030 (%)

12.6.3 South Africa - Market size and forecast 2025-2030

Chart on South Africa - Market size and forecast 2025-2030 ($ million)
Data Table on South Africa - Market size and forecast 2025-2030 ($ million)
Chart on South Africa - Year-over-year growth 2025-2030 (%)
Data Table on South Africa - Year-over-year growth 2025-2030 (%)

12.6.4 Israel - Market size and forecast 2025-2030

Chart on Israel - Market size and forecast 2025-2030 ($ million)
Data Table on Israel - Market size and forecast 2025-2030 ($ million)
Chart on Israel - Year-over-year growth 2025-2030 (%)
Data Table on Israel - Year-over-year growth 2025-2030 (%)

12.6.5 Egypt - Market size and forecast 2025-2030

Chart on Egypt - Market size and forecast 2025-2030 ($ million)
Data Table on Egypt - Market size and forecast 2025-2030 ($ million)
Chart on Egypt - Year-over-year growth 2025-2030 (%)
Data Table on Egypt - Year-over-year growth 2025-2030 (%)

12.7 South America - Market size and forecast 2025-2030

Chart on South America - Market size and forecast 2025-2030 ($ million)
Data Table on South America - Market size and forecast 2025-2030 ($ million)
Chart on South America - Year-over-year growth 2025-2030 (%)
Data Table on South America - Year-over-year growth 2025-2030 (%)
Chart on Regional Comparison - South America
Data Table on Regional Comparison - South America

12.7.1 Brazil - Market size and forecast 2025-2030

Chart on Brazil - Market size and forecast 2025-2030 ($ million)
Data Table on Brazil - Market size and forecast 2025-2030 ($ million)
Chart on Brazil - Year-over-year growth 2025-2030 (%)
Data Table on Brazil - Year-over-year growth 2025-2030 (%)

12.7.2 Argentina - Market size and forecast 2025-2030

Chart on Argentina - Market size and forecast 2025-2030 ($ million)
Data Table on Argentina - Market size and forecast 2025-2030 ($ million)
Chart on Argentina - Year-over-year growth 2025-2030 (%)
Data Table on Argentina - Year-over-year growth 2025-2030 (%)

12.7.3 Chile - Market size and forecast 2025-2030

Chart on Chile - Market size and forecast 2025-2030 ($ million)
Data Table on Chile - Market size and forecast 2025-2030 ($ million)
Chart on Chile - Year-over-year growth 2025-2030 (%)
Data Table on Chile - Year-over-year growth 2025-2030 (%)

12.8 Market opportunity by geography

Market opportunity by geography ($ million)
Data Tables on Market opportunity by geography ($ million)

13. Drivers, Challenges, and Opportunity

13.1 Market drivers

Accelerated transition to zero trust architecture and continuous verification
Proliferation of non human identities and agentic AI
Stringent global regulatory compliance and data sovereignty mandates

13.2 Market challenges

Complexity of legacy system integration and hybrid infrastructure
Evolving regulatory compliance and data sovereignty requirements
Security risks from sophisticated identity based attacks

13.3 Impact of drivers and challenges

Impact of drivers and challenges in 2025 and 2030

13.4 Market opportunities

Integration of AI and ML for autonomous identity governance
Expansion of provisioning frameworks to secure non human and machine identities
Convergence of identity security with zero trust architecture and identity threat detection

14. Competitive Landscape

14.1 Overview

14.2

Overview on criticality of inputs and factors of differentiation

14.3 Landscape disruption

Overview on factors of disruption

14.4 Industry risks

Impact of key risks on business

15. Competitive Analysis

15.1 Companies profiled

Companies covered

15.2 Company ranking index

15.3 Market positioning of companies

Matrix on companies position and classification

15.4 Atos SE

Atos SE - Overview
Atos SE - Business segments
Atos SE - Key offerings
Atos SE - Segment focus
SWOT

15.5 Broadcom Inc.

Broadcom Inc. - Overview
Broadcom Inc. - Business segments
Broadcom Inc. - Key offerings
Broadcom Inc. - Segment focus
SWOT

15.6 Centrify Corp.

Centrify Corp. - Overview
Centrify Corp. - Product / Service
Centrify Corp. - Key offerings
SWOT

15.7 Dell Technologies Inc.

Dell Technologies Inc. - Overview
Dell Technologies Inc. - Business segments
Dell Technologies Inc. - Key news
Dell Technologies Inc. - Key offerings
Dell Technologies Inc. - Segment focus
SWOT

15.8 Happiest Minds Technologies Ltd.

Happiest Minds Technologies Ltd. - Overview
Happiest Minds Technologies Ltd. - Business segments
Happiest Minds Technologies Ltd. - Key offerings
Happiest Minds Technologies Ltd. - Segment focus
SWOT

15.9 Hitachi Ltd.

Hitachi Ltd. - Overview
Hitachi Ltd. - Business segments
Hitachi Ltd. - Key offerings
Hitachi Ltd. - Segment focus
SWOT

15.10 IBM Corp.

IBM Corp. - Overview
IBM Corp. - Business segments
IBM Corp. - Key news
IBM Corp. - Key offerings
IBM Corp. - Segment focus
SWOT

15.11 Microsoft Corp.

Microsoft Corp. - Overview
Microsoft Corp. - Business segments
Microsoft Corp. - Key news
Microsoft Corp. - Key offerings
Microsoft Corp. - Segment focus
SWOT

15.12 Motorola Solutions Inc.

Motorola Solutions Inc. - Overview
Motorola Solutions Inc. - Business segments
Motorola Solutions Inc. - Key news
Motorola Solutions Inc. - Key offerings
Motorola Solutions Inc. - Segment focus
SWOT

15.13 Oracle Corp.

Oracle Corp. - Overview
Oracle Corp. - Business segments
Oracle Corp. - Key news
Oracle Corp. - Key offerings
Oracle Corp. - Segment focus
SWOT

15.14 Quest Software Inc.

Quest Software Inc. - Overview
Quest Software Inc. - Product / Service
Quest Software Inc. - Key offerings
SWOT

15.15 Rippling People Center Inc.

Rippling People Center Inc. - Overview
Rippling People Center Inc. - Product / Service
Rippling People Center Inc. - Key offerings
SWOT

15.16 SAP SE

SAP SE - Overview
SAP SE - Business segments
SAP SE - Key news
SAP SE - Key offerings
SAP SE - Segment focus
SWOT

15.17 SolarWinds Corp.

SolarWinds Corp. - Overview
SolarWinds Corp. - Product / Service
SolarWinds Corp. - Key offerings
SWOT

15.18 Zoho Corp. Pvt. Ltd.

Zoho Corp. Pvt. Ltd. - Overview
Zoho Corp. Pvt. Ltd. - Product / Service
Zoho Corp. Pvt. Ltd. - Key offerings
SWOT

16. Appendix

16.1 Scope of the report

Market definition
Objectives
Notes and caveats

16.2 Inclusions and exclusions checklist

Inclusions checklist
Exclusions checklist

16.3 Currency conversion rates for US$

16.4 Research methodology

16.5 Data procurement

Information sources

16.6 Data validation

16.7 Validation techniques employed for market sizing

16.8 Data synthesis

16.9 360 degree market analysis

16.10 List of abbreviations

Research Methodology

Technavio presents a detailed picture of the market by way of study, synthesis, and summation of data from multiple sources. The analysts have presented the various facets of the market with a particular focus on identifying the key industry influencers. The data thus presented is comprehensive, reliable, and the result of extensive research, both primary and secondary.

INFORMATION SOURCES

Primary sources

  • Manufacturers and suppliers
  • Channel partners
  • Industry experts
  • Strategic decision makers

Secondary sources

  • Industry journals and periodicals
  • Government data
  • Financial reports of key industry players
  • Historical data
  • Press releases

DATA ANALYSIS

Data Synthesis

  • Collation of data
  • Estimation of key figures
  • Analysis of derived insights

Data Validation

  • Triangulation with data models
  • Reference against proprietary databases
  • Corroboration with industry experts

REPORT WRITING

Qualitative

  • Market drivers
  • Market challenges
  • Market trends
  • Five forces analysis

Quantitative

  • Market size and forecast
  • Market segmentation
  • Geographical insights
  • Competitive landscape

Interested in this report?

Get your sample now to see our research methodology and insights!

Download Now

Frequently Asked Questions

User Provisioning Software market growth will increase by USD 4546.2 million during 2026-2030.

The User Provisioning Software market is expected to grow at a CAGR of 7.1% during 2026-2030.

User Provisioning Software market is segmented by End-user (BFSI, Manufacturing, Healthcare, Retail, Others) Type (Role-based provisioning, Account-based provisioning, Self-service provisioning) Deployment (On-premises, Cloud)

Atos SE, Avatier Corp., Broadcom Inc., Centrify Corp., CyberArk Software Ltd., Dell Technologies Inc., EmpowerID Inc., Happiest Minds Technologies Ltd., Hitachi Ltd., IBM Corp., Microsoft Corp., Motorola Solutions Inc., Okta Inc., Oracle Corp., Quest Software Inc., Rippling People Center Inc., SailPoint Technologies Inc., SAP SE, SolarWinds Corp., Zoho Corp. Pvt. Ltd. are a few of the key vendors in the User Provisioning Software market.

North America will register the highest growth rate of 45.1% among the other regions. Therefore, the User Provisioning Software market in North America is expected to garner significant business opportunities for the vendors during the forecast period.

US, Canada, Mexico, Germany, UK, France, Italy, Spain, The Netherlands, China, India, Japan, South Korea, Australia, Indonesia, Saudi Arabia, UAE, South Africa, Israel, Egypt, Brazil, Argentina, Chile

  • Accelerated transition to zero trust architecture and continuous verification is the driving factor this market.

The User Provisioning Software market vendors should focus on grabbing business opportunities from the End-user segment as it accounted for the largest market share in the base year.
RIA - Research AI Assistant
Ask RIA