
User Provisioning Market Size 2025-2029
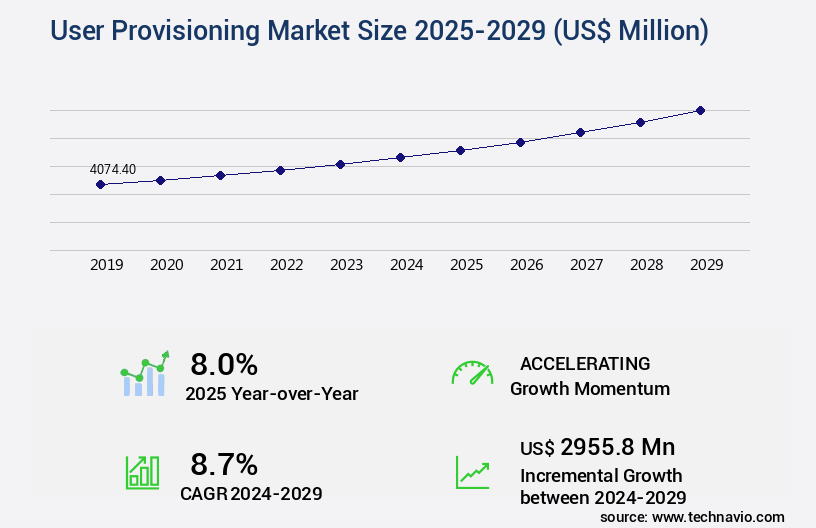
The user provisioning market size is valued to increase USD 2.96 billion, at a CAGR of 8.7% from 2024 to 2029. Growing demand for mobile user provisioning software will drive the user provisioning market.
Major Market Trends & Insights
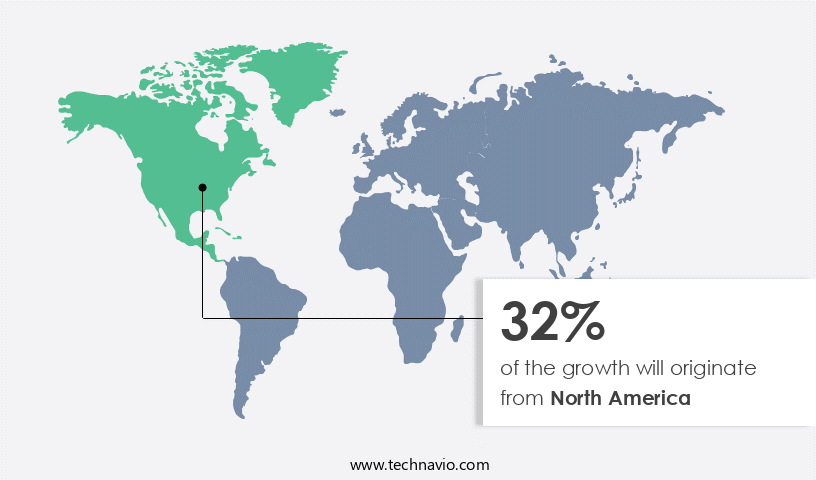
- North America dominated the market and accounted for a 32% growth during the forecast period.
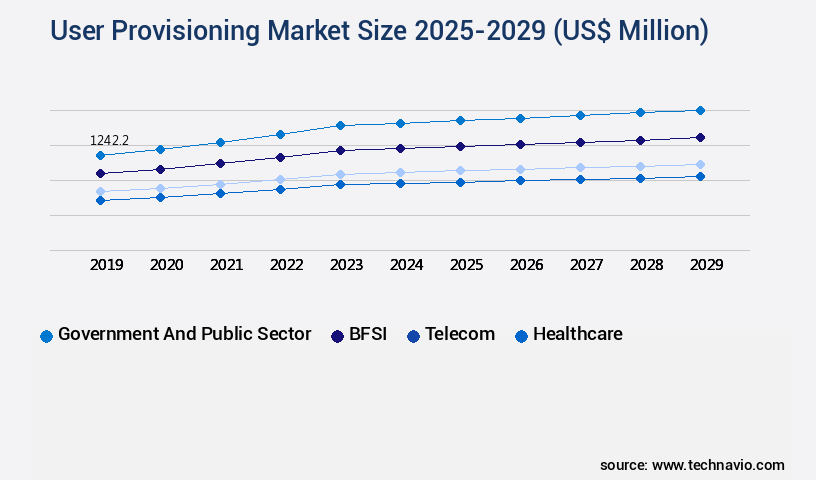
- By End-user - Government and public sector segment was valued at USD 1.24 billion in 2023
- By Application - Marketing and sales segment accounted for the largest market revenue share in 2023
Market Size & Forecast
- Market Opportunities: USD 112.73 million
- Market Future Opportunities: USD 2955.80 million
- CAGR from 2024 to 2029 : 8.7%
Market Summary
- The market has experienced significant expansion due to the increasing adoption of cloud services and the growing need for secure access management. According to recent reports, the market is projected to reach a value of USD 12.5 billion by 2025, underpinned by the demand for automating user access across various applications and systems. Despite this growth, challenges persist. The presence of multiple user-level provisions complicates the process, necessitating advanced solutions that can manage access requests, approvals, and revocations in real-time. This complexity has led to increased interest in Identity-as-a-Service (IDaaS) offerings, which streamline user provisioning and reduce the burden on IT departments.
- Moreover, the small and medium-sized enterprises (SMEs) sector is witnessing a surge in user provisioning adoption. These businesses recognize the importance of securing their digital assets and ensuring regulatory compliance. User provisioning solutions offer a cost-effective and efficient way to manage user access, making them an attractive proposition for SMEs. In conclusion, the market is poised for continued growth, driven by the increasing adoption of cloud services and the need for secure access management. The challenges associated with managing multiple user-level provisions are being addressed through advanced solutions like IDaaS, and SMEs are increasingly recognizing the benefits of user provisioning.
- This market's evolution underscores the importance of streamlined access management in today's digital landscape.
What will be the Size of the User Provisioning Market during the forecast period?
Get Key Insights on Market Forecast (PDF) Request Free Sample
How is the User Provisioning Market Segmented ?
The user provisioning industry research report provides comprehensive data (region-wise segment analysis), with forecasts and estimates in "USD million" for the period 2025-2029, as well as historical data from 2019-2023 for the following segments.
- End-user
- Government and public sector
- BFSI
- Telecom
- Healthcare
- Others
- Application
- Marketing and sales
- IT
- HR
- Administration
- Finance
- Deployment
- Cloud-based
- On-premises
- Type
- Solution
- Services
- Geography
- North America
- US
- Canada
- Mexico
- Europe
- France
- Germany
- Italy
- UK
- APAC
- China
- India
- Japan
- Rest of World (ROW)
- North America
By End-user Insights
The government and public sector segment is estimated to witness significant growth during the forecast period.
In the dynamic realm of user provisioning, the market is witnessing ongoing evolution, with a significant focus on ensuring secure and compliant access to data and applications. The government and public sectors lead this market due to stringent regulatory requirements and the need for effective access management. The North American region is spearheading growth in the user provisioning and governance tools sector, with a reported 25% year-over-year increase in demand. This surge is attributed to the growing emphasis on data security, regulatory compliance, and the adoption of advanced technologies such as multi-factor authentication, password management systems, privileged access management, directory synchronization tools, federated identity management, user entitlement management, API-driven provisioning, self-service provisioning, user attribute management, access control policies, automation scripting, identity proofing, account provisioning automation, data loss prevention, risk-based access control, group policy management, security incident management, data governance policies, single sign-on integration, behavioral analytics, access request management, audit trails, authentication protocols, deprovisioning workflows, authorization frameworks, identity management systems, account provisioning workflows, user lifecycle management, workflow orchestration, delegated administration, access control lists, role-based access control, and compliance regulations.
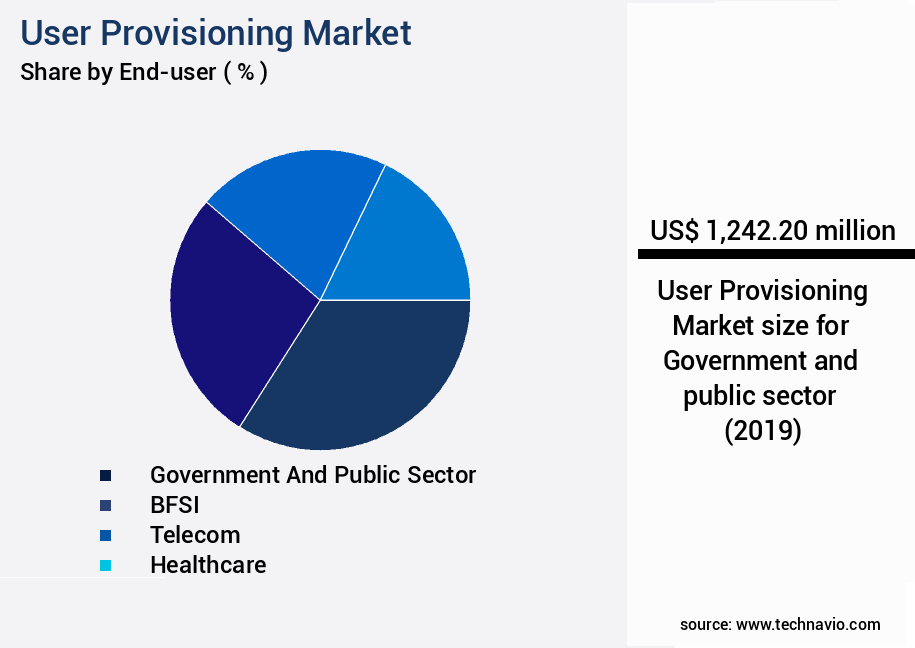
The Government and public sector segment was valued at USD 1.24 billion in 2019 and showed a gradual increase during the forecast period.
Regional Analysis
North America is estimated to contribute 32% to the growth of the global market during the forecast period. Technavio's analysts have elaborately explained the regional trends and drivers that shape the market during the forecast period.
See How User Provisioning Market Demand is Rising in North America Request Free Sample
The market in several technologically advanced countries in North America, including the US, Canada, and Mexico, is experiencing significant growth. This region's industrial sector's technological maturity enables swift adoption of modern technology, driving market expansion. Increased investments in technological development by various regional governments and the presence of leading industry players further fuel market growth. Furthermore, the continuous evolution of technologies, such as user database information management, cloud computing, mobility solutions, and social app integration, contribute to the market's expansion during the forecast period.
Market Dynamics
Our researchers analyzed the data with 2024 as the base year, along with the key drivers, trends, and challenges. A holistic analysis of drivers will help companies refine their marketing strategies to gain a competitive advantage.
The market is experiencing significant growth as businesses seek to streamline and automate user account management processes. Automated user provisioning workflows are becoming increasingly popular, allowing organizations to integrating identity management systems and managing user entitlements and access more effectively. Role-based access control is a key component of this, ensuring that employees only have the necessary permissions to perform their job functions. Implementing centralized user identity management systems is another trend in the market. These systems enable organizations to improve identity governance and administration, enforcing strong password policies and mitigating identity-related security risks. API integration for user provisioning is also important, allowing for seamless integration with other business applications and ensuring compliance with various regulatory requirements for user access. Effective identity access management is crucial for reducing risk from privileged accounts and ensuring secure user account management systems. Best practices for user access management include real-time user provisioning capabilities, scalable user provisioning architecture, and improving self-service user provisioning. Identity and access governance policies are essential for ensuring that access is granted in accordance with organizational policies and regulations. Overall, the market is focused on providing solutions that help organizations streamline user account provisioning and deprovisioning processes, improve identity governance and administration, and mitigate identity-related security risks. By automating these processes and implementing strong identity and access management practices, businesses can improve operational efficiency and reduce the risk of security breaches.
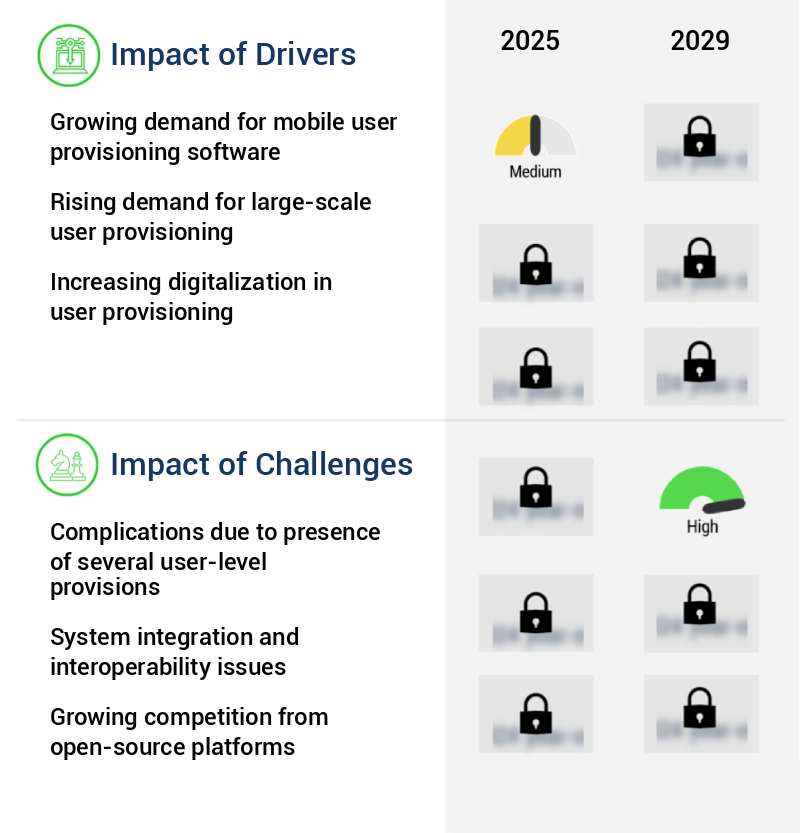
What are the key market drivers leading to the rise in the adoption of User Provisioning Industry?
- The increasing demand for mobile user provisioning software serves as the primary market driver. This solution enables organizations to efficiently and securely manage the mobile devices and applications used by their employees, addressing the growing need for remote work and bring-your-own-device (BYOD) policies in today's business landscape.
- The user provisioning software market is witnessing a surge in demand for advanced customizations, particularly mobile solutions with unified connectivity and mobility. This trend is driven by the increasing dependency on mobile technology and the need for seamless, remote management of digital identities. In response to this demand, innovative companies are integrating mobile solutions into their user provisioning software offerings. For instance, in October 2024, Sensorise introduced the first M2M Remote SIM Provisioning (RSP) technology for consumer SIMs.
- This groundbreaking development enables users to manage their eSIM profiles without physically swapping SIM cards, highlighting the market's continuous evolution. The integration of mobile solutions is expected to significantly boost the adoption of user provisioning software during the forecast period.
What are the market trends shaping the User Provisioning Industry?
- The increasing adoption of user provisioning is becoming a prominent trend in Small and Medium Enterprises (SMEs). User provisioning, a process of automatically managing digital identities, is gaining popularity among SMEs.
- The market is experiencing significant growth due to the increasing deployment of cloud encryption in Small and Medium Enterprises (SMEs). This trend is driven by the shifting consumer demands towards digitalization and the need for advanced security features offered by cloud encryption solutions. SMEs are frequently migrating from on-premises servers to various cloud-based applications, which not only lowers their overall running costs but also reduces maintenance costs. This trend is particularly prominent in the developing economies of the Asia Pacific region, where the demand for Software as a Service (SaaS) applications is on the rise.
- The adoption of new, advanced data storage technology by SMEs is also facilitating the increased penetration of cloud-based encryption solutions. This shift towards cloud encryption is a significant development in the market and is expected to continue during the forecast period.
What challenges does the User Provisioning Industry face during its growth?
- The presence of multiple user-level provisions poses a significant challenge to the industry's growth, as it introduces complications that require extensive expertise and resources to navigate effectively.
- The market is a dynamic and complex landscape, catering to the diverse needs of various user types within organizations. This market encompasses basic, power, IT, and administrator users in software systems. Project managers in the software industry play a pivotal role in understanding these user groups and managing their access rights and permissions. The implementation of user-specific or role-based models adds to the intricacy of the process. Significant technical expertise is essential to ensure a seamless deployment of systems and adherence to end-user requirements. Compliance with internal controls is crucial, particularly in financial system implementations, which must adhere to generally accepted accounting principles (GAAP).
- The market for user provisioning continues to evolve, with ongoing activities shaping its applications across sectors. For instance, the healthcare industry leverages user provisioning to secure sensitive patient data, while the finance sector employs it to maintain regulatory compliance. The market's growth is characterized by a shift towards cloud-based solutions and an increasing focus on automation and integration with other IT systems.
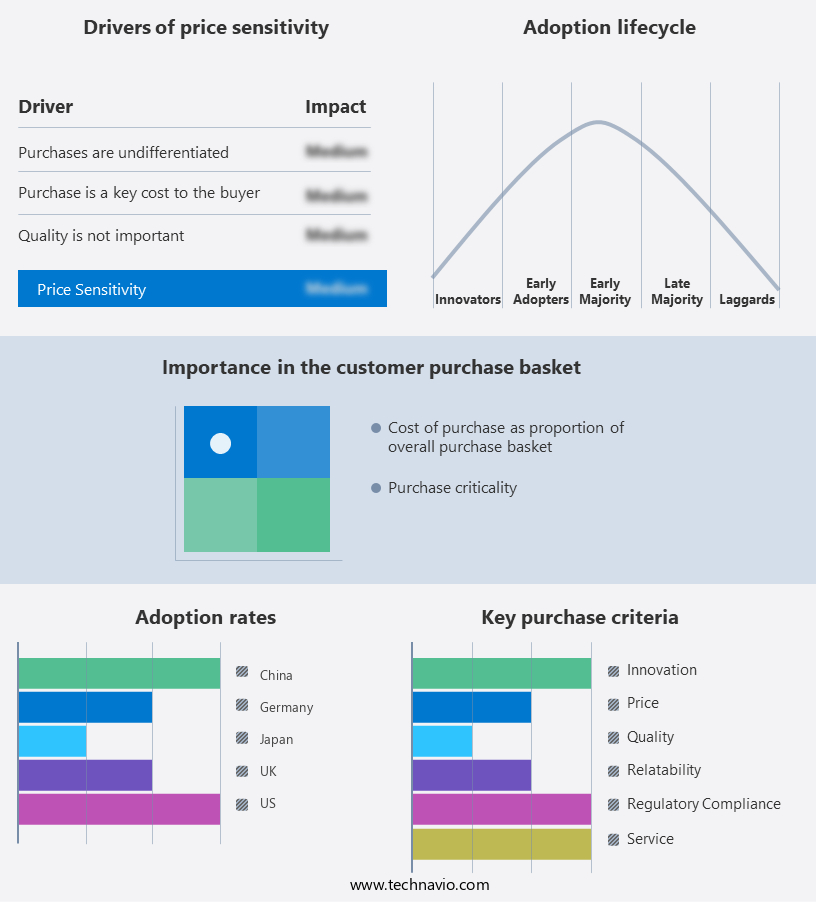
Exclusive Technavio Analysis on Customer Landscape
The user provisioning market forecasting report includes the adoption lifecycle of the market, covering from the innovator's stage to the laggard's stage. It focuses on adoption rates in different regions based on penetration. Furthermore, the user provisioning market report also includes key purchase criteria and drivers of price sensitivity to help companies evaluate and develop their market growth analysis strategies.
Customer Landscape of User Provisioning Industry
Competitive Landscape
Companies are implementing various strategies, such as strategic alliances, user provisioning market forecast, partnerships, mergers and acquisitions, geographical expansion, and product/service launches, to enhance their presence in the industry.
Atos SE - This company specializes in Identity and Access Management (IAM), delivering user provisioning solutions that ensure secure and efficient access to resources based on identity, authorization, and business need.
The industry research and growth report includes detailed analyses of the competitive landscape of the market and information about key companies, including:
- Atos SE
- Avatier Corp.
- Broadcom Inc.
- Centrify Corp.
- CyberArk Software Ltd.
- Dell Technologies Inc.
- EmpowerID Inc.
- Happiest Minds Technologies Ltd.
- Hitachi Ltd.
- International Business Machines Corp.
- Microsoft Corp.
- Motorola Solutions Inc.
- Okta Inc.
- Oracle Corp.
- Quest Software Inc.
- Rippling People Center Inc.
- SailPoint Technologies Inc.
- SAP SE
- SolarWinds Corp.
- Zoho Corp. Pvt. Ltd.
Qualitative and quantitative analysis of companies has been conducted to help clients understand the wider business environment as well as the strengths and weaknesses of key industry players. Data is qualitatively analyzed to categorize companies as pure play, category-focused, industry-focused, and diversified; it is quantitatively analyzed to categorize companies as dominant, leading, strong, tentative, and weak.
Recent Development and News in User Provisioning Market
- In January 2024, Okta, a leading identity and access management provider, announced the launch of Okta Identity Cloud for Workforce and Customer Identity, expanding its user provisioning solutions to cater to both workforce and customer needs (Okta Press Release, 2024).
- In March 2024, Microsoft and Oracle signed a strategic partnership to integrate Microsoft Azure Active Directory with Oracle Cloud Infrastructure, enabling seamless user provisioning and single sign-on between the two platforms (Microsoft News Center, 2024).
- In May 2024, One Identity, a Quest Software business, secured a strategic investment of USD 150 million from TA Associates to fuel its growth in identity and access management solutions, including user provisioning (Business Wire, 2024).
- In January 2025, the European Union's General Data Protection Regulation (GDPR) introduced new user provisioning requirements, mandating organizations to implement stricter access controls and user consent processes, driving increased demand for user provisioning solutions (European Commission, 2025).
Dive into Technavio's robust research methodology, blending expert interviews, extensive data synthesis, and validated models for unparalleled User Provisioning Market insights. See full methodology.
|
Market Scope |
|
|
Report Coverage |
Details |
|
Page number |
235 |
|
Base year |
2024 |
|
Historic period |
2019-2023 |
|
Forecast period |
2025-2029 |
|
Growth momentum & CAGR |
Accelerate at a CAGR of 8.7% |
|
Market growth 2025-2029 |
USD 2955.8 million |
|
Market structure |
Fragmented |
|
YoY growth 2024-2025(%) |
8.0 |
|
Key countries |
US, China, UK, Germany, Japan, Canada, France, India, Italy, and Mexico |
|
Competitive landscape |
Leading Companies, Market Positioning of Companies, Competitive Strategies, and Industry Risks |
Research Analyst Overview
- The market continues to evolve, driven by the increasing complexity of digital identities and access management requirements across various sectors. Multi-factor authentication and password management systems form the foundation of secure access, while privileged access management ensures the protection of sensitive data. Directory synchronization tools and federated identity management facilitate seamless identity transfer between systems. User entitlement management, API-driven provisioning, and self-service provisioning enable efficient access control, with automation scripting streamlining workflows. User attribute management and access control policies provide granular access control, while risk-based access control adds an extra layer of security. Data loss prevention, behavioral analytics, and access request management help mitigate potential threats, with audit trails and authentication protocols ensuring accountability.
- Deprovisioning workflows and authorization frameworks enable efficient identity management, while single sign-on integration enhances user experience. According to recent industry reports, the market is expected to grow by over 15% annually, driven by the increasing adoption of cloud services and the need for more robust identity and access management solutions. For instance, a large financial institution reported a 30% reduction in access-related security incidents after implementing a comprehensive user provisioning solution.
What are the Key Data Covered in this User Provisioning Market Research and Growth Report?
-
What is the expected growth of the User Provisioning Market between 2025 and 2029?
-
USD 2.96 billion, at a CAGR of 8.7%
-
-
What segmentation does the market report cover?
-
The report is segmented by End-user (Government and public sector, BFSI, Telecom, Healthcare, and Others), Application (Marketing and sales, IT, HR, Administration, and Finance), Deployment (Cloud-based and On-premises), Type (Solution and Services), and Geography (North America, Europe, APAC, Middle East and Africa, and South America)
-
-
Which regions are analyzed in the report?
-
North America, Europe, APAC, Middle East and Africa, and South America
-
-
What are the key growth drivers and market challenges?
-
Growing demand for mobile user provisioning software, Complications due to presence of several user-level provisions
-
-
Who are the major players in the User Provisioning Market?
-
Atos SE, Avatier Corp., Broadcom Inc., Centrify Corp., CyberArk Software Ltd., Dell Technologies Inc., EmpowerID Inc., Happiest Minds Technologies Ltd., Hitachi Ltd., International Business Machines Corp., Microsoft Corp., Motorola Solutions Inc., Okta Inc., Oracle Corp., Quest Software Inc., Rippling People Center Inc., SailPoint Technologies Inc., SAP SE, SolarWinds Corp., and Zoho Corp. Pvt. Ltd.
-
Market Research Insights
- The market is a continually evolving landscape, encompassing various solutions and services that facilitate the management of digital identities within organizations. Two key aspects of this market highlight its significance. First, the number of identity and access management (IAM) tools deployed is projected to increase by 20% over the next five years. Second, consider an instance where a company successfully implemented a user provisioning solution, resulting in a 30% reduction in account recovery time and a 25% decrease in security incidents due to unauthorized access.
- This market includes solutions addressing account recovery, security monitoring, compliance auditing, automation platforms, data encryption, access control models, identity proofing methods, permission sets, risk mitigation, attribute mapping, password resets, policy enforcement, user self-registration, identity federation, system integration, account reconciliation, profile management, role management, governance frameworks, user provisioning tools, user offboarding, identity lifecycle, access certification, user onboarding, access reviews, and privilege escalation.
We can help! Our analysts can customize this user provisioning market research report to meet your requirements.
 RIA -
RIA - 
