UWB Anchor And Tags Market Size 2024-2028
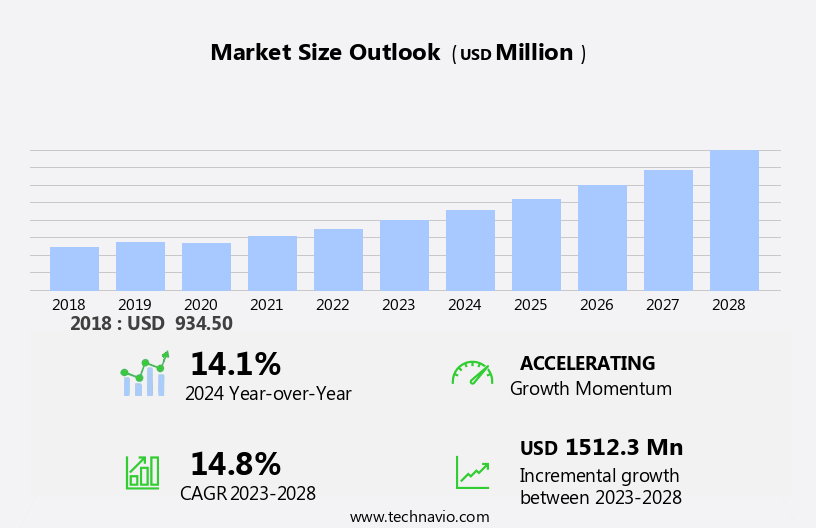
The UWB anchor and tags market size is forecast to increase by USD 1.51 billion at a CAGR of 14.8% between 2023 and 2028.
- The UWB (Ultra-Wideband) Anchor and Tags Market is experiencing significant growth due to several key trends. The increasing demand for Real-Time Location Systems (RTLS) in various industries is driving market growth. companies are focusing on new product launches to cater to this demand and gain a competitive edge. Additionally, government regulations supporting the use of UWB devices are boosting market expansion. UWB tags, which are compact electronic devices, emit signals that are detected by UWB anchors and transmitted to a location server for precise positioning. These trends are shaping the future of the market, making it an attractive investment opportunity for businesses In the US and globally. This industrial base is expected to fuel the demand for UWB technology, as manufacturers prioritize automation, real-time tracking, and heightened operational efficiency. UWB technology offers high accuracy, low power consumption, and strongness, making it an ideal solution for various applications such as asset tracking, indoor navigation, and proximity marketing. The market is expected to continue its growth trajectory, driven by these trends and the increasing adoption of UWB technology in various industries.
What will be the Size of the UWB Anchor And Tags Market During the Forecast Period?
- The ultra-wideband (UWB) anchor and tag market is experiencing significant growth due to the transformative impact of UWB technology on various industries, particularly in asset tracking and industrial signaling. UWB radar technology enables high-accuracy positioning systems, allowing for real-time distance measurement and motion sensor capabilities. UWB anchors serve as fixed reference points, while UWB tags attach to assets for tracking.
- Moreover, time-of-flight technology ensures precise accuracy, surpassing that of Bluetooth RSSI and RFID readers. UWB's wire-free technology eliminates the need for battery-less RFID tags and reduces installation costs. Self-forming networks enable seamless integration, while battery life and high-accuracy positioning are major advantages. UWB's speed and wireless technology make it an attractive alternative to traditional tracking methods, offering a cost-effective and efficient solution for various applications.
How is this UWB Anchor And Tags Industry segmented and which is the largest segment?
The UWB anchor and tags industry research report provides comprehensive data (region-wise segment analysis), with forecasts and estimates in "USD billion" for the period 2024-2028, as well as historical data from 2018-2022 for the following segments.
- Component
- Tags
- Anchors
- Technology
- Indoor positioning
- Outdoor positioning
- Geography
- North America
- Canada
- US
- Europe
- Germany
- UK
- France
- APAC
- China
- India
- Japan
- South Korea
- South America
- Brazil
- Middle East and Africa
- North America
By Component Insights
- The tags segment is estimated to witness significant growth during the forecast period.
Ultra-Wideband (UWB) technology plays a crucial role in Real-Time Location Systems (RTLS) through the use of UWB anchors and tags. These tags are essential for asset tracking, vehicle tracking, material flow analysis, and employee location monitoring, enhancing safety and operational efficiency in various industries. UWB tags are particularly valuable due to their high accuracy, making them ideal for applications requiring real-time visibility and control. In sectors such as logistics and healthcare, UWB tags are attached to goods, equipment, or individuals to ensure enhanced visibility and safety. UWB technology utilizes Bluetooth Received Signal Strength Indicator (RSSI) and Bluetooth beacons for improved tracking capabilities. Additionally, battery-less RFID tags offer an added advantage in terms of cost savings and maintenance.

Get a glance at the UWB Anchor And Tags Industry report of share of various segments Request Free Sample
The tags segment was valued at USD 567.30 million in 2018 and showed a gradual increase during the forecast period.
Regional Analysis
- North America is estimated to contribute 39% to the growth of the global market during the forecast period.
Technavio's analysts have elaborately explained the regional trends and drivers that shape the market during the forecast period.

For more insights on the market share of various regions, Request Free Sample
The UWB (Ultra-Wideband) anchor and tags market in North America is witnessing significant growth due to the increasing demand for real-time asset tracking in industries such as manufacturing, logistics, healthcare, and retail. UWB anchors, functioning as reference points for UWB tags, are increasingly being adopted in indoor environments for accurate and efficient asset tracking. The industrial sector in North America, represented by the US manufacturing sector, which contributed USD 2.3 trillion to the GDP in 2022, and the machinery manufacturing sector of Ontario, Canada, accounting for 10.3% of the region's manufacturing GDP, underscores the region's industrial strength. UWB technology, with its low power consumption, short distances, high accuracy, and time measurement capabilities, offers a promising solution for indoor asset tracking applications.
Market Dynamics
Our UWB anchor and tags market researchers analyzed the data with 2023 as the base year, along with the key drivers, trends, and challenges. A holistic analysis of drivers will help companies refine their marketing strategies to gain a competitive advantage.
What are the key market drivers leading to the rise In the adoption of UWB Anchor And Tags Industry?
Increasing demand for RTLS in end-user industries is the key driver of the market.
- Ultra-Wideband (UWB) technology, a wireless communication standard, is revolutionizing various industries through its integration with Real-Time Location Systems (RTLS). In healthcare, UWB-enabled RTLS offers high-accuracy asset tracking for patients and medical equipment, improving safety, workflow efficiency, and resource utilization. This technology enables hospitals to monitor medical equipment in real time, reducing search times and preventing theft. In the manufacturing sector, UWB systems are utilized for tracking tools and materials on assembly lines, ensuring smooth operations and preventing losses. Real-time location monitoring of employees and machinery enhances workplace safety and operational efficiency. By providing detailed insights into asset movement and usage, UWB RTLS assists manufacturers in streamlining processes and minimizing downtime.
- In addition, UWB applications extend beyond industrial settings, with entertainment, logistics, and security industries also benefiting from this transformative technology. UWB radar, motion sensors, and time-of-flight systems enable high-resolution imaging and distance measurement, while self-forming networks and low power consumption contribute to wireless communication's efficiency. UWB's precision and speed offer significant advantages over traditional tracking technologies like Bluetooth RSSI and Bluetooth beacons. Battery-less RFID tags and RFID readers, along with wire-free technology, further reduce installation costs. FCC approval for commercial use and smartphone integration expand UWB's reach and versatility. UWB chips and wireless communication technology's integration into smart electronic devices, such as keyless entry systems, smart homes, and wearables, provide contactless solutions for various applications.
What are the market trends shaping the UWB Anchor And Tags Industry?
Increasing focus of companies on new product launches is the upcoming market trend.
- The Ultra-Wideband (UWB) anchor and tags market is witnessing substantial growth due to the increasing demand for high-accuracy Real-Time Location System (RTLS) solutions in various industries. UWB technology, which includes applications such as radar, industrial signaling, asset tracking, motion sensor, time-of-flight, and positioning systems, offers significant advantages over traditional technologies like Bluetooth RSSI and Bluetooth beacons. UWB's high-accuracy, wireless technology enables precise distance measurement and calculation, making it an ideal choice for tracking assets, monitoring motion, and measuring time. UWB's self-forming network, battery-less RFID tags, and wire-free technology offer several benefits, including low installation cost, long battery life, and high-resolution imaging.
- In addition, UWB's transformative impact is evident in various sectors, including entertainment, healthcare, aerospace, smart electronic devices, logistics, security, and industrial automation. The technology's ability to provide real-time data transmission at low power consumption and short distances makes it a preferred choice for applications requiring high accuracy and time measurement. Recent developments in UWB technology include the launch of new UWB chips and smartphone integration, enabling contactless solutions for keyless entry systems, smart homes, and wearables. The FCC's approval for commercial use of UWB technology has further accelerated its adoption, making it an essential component of various industries' digital transformation. With its speed, precision, and transformative impact, UWB is poised to revolutionize wireless communication and data transmission across multiple applications.
What challenges does the UWB Anchor And Tags Industry face during its growth?
Government regulations associated with UWB devices is a key challenge affecting the industry growth.
- The Ultra-Wideband (UWB) anchor and tags market is witnessing significant growth due to the transformative impact of UWB technology on various applications, including industrial signaling, asset tracking, motion sensor, time-of-flight, and positioning systems. UWB radar technology offers high-accuracy tracking capabilities for assets, making it an ideal solution for industries requiring precise distance measurement and positioning. UWB's self-forming network, low power consumption, and wireless technology enable seamless connectivity and data transmission, even at short distances. UWB's applications extend to entertainment, healthcare, aerospace, smart electronic devices, and more. For instance, UWB's high-resolution imaging and wireless communication capabilities make it an essential component In the entertainment industry for applications like virtual and augmented reality.
- In addition, in healthcare, UWB technology is used for contactless solutions like keyless entry systems, smart homes, and wearables, enhancing patient safety and convenience. However, regulatory compliance is a significant challenge In the market. In the US, the Federal Communications Commission (FCC) regulates UWB devices under Part 15 of its rules, setting strict limits on power emissions and defining operational parameters to mitigate interference with existing services. Manufacturers must adhere to these regulations to gain FCC approval for commercial use. UWB chips and smartphone integration are also driving the market's growth. For example, UWB technology is used in logistics for real-time tracking of assets, improving efficiency and reducing costs.
Exclusive Customer Landscape
The UWB anchor and tags market forecasting report includes the adoption lifecycle of the market, covering from the innovator's stage to the laggard's stage. It focuses on adoption rates in different regions based on penetration. Furthermore, the uwb anchor and tags market report also includes key purchase criteria and drivers of price sensitivity to help companies evaluate and develop their market growth analysis strategies.

Customer Landscape
Key Companies & Market Insights
Companies are implementing various strategies, such as strategic alliances, UWB anchor and tags market forecast, partnerships, mergers and acquisitions, geographical expansion, and product/service launches, to enhance their presence In the industry.
The industry research and growth report includes detailed analyses of the competitive landscape of the market and information about key companies, including:
- ASSA ABLOY AB
- BlueIOT Technology Co Ltd.
- Callitrix
- Eliko Tehnoloogia Arenduskeskus
- Estimote Inc.
- Kinexon GmbH
- Murata Manufacturing Co. Ltd.
- Nanotron Technologies GmbH
- Navigine Corp.
- NXP Semiconductors NV
- Pozyx NV
- Qorvo Inc.
- Quuppa Oy
- Sewio Networks s r o
- Shenzhen Skylab Co LTD
- STMicroelectronics International N.V.
- Taoglas Group Holdings Ltd.
- Ubisense Ltd.
- Zebra Technologies Corp.
- ZIGPOS GmbH
Qualitative and quantitative analysis of companies has been conducted to help clients understand the wider business environment as well as the strengths and weaknesses of key industry players. Data is qualitatively analyzed to categorize companies as pure play, category-focused, industry-focused, and diversified; it is quantitatively analyzed to categorize companies as dominant, leading, strong, tentative, and weak.
Research Analyst Overview
Ultra-Wideband (UWB) technology, a revolutionary wireless communication technology, is gaining significant traction in various industries due to its unique capabilities and transformative impact. UWB operates on the principle of time-domain reflectometry, which allows for high-accuracy distance measurement and positioning systems. This technology is not limited to short distances and offers low power consumption, making it an ideal solution for a multitude of applications. UWB radar is a key component of this technology, enabling motion sensing and asset tracking. It operates by sending out a radio wave and measuring the time it takes for the wave to bounce back after hitting an object.
In addition, this time measurement provides accurate distance information, making it suitable for applications such as industrial signaling and asset tracking. UWB technology's high-accuracy positioning system is another significant advantage. It offers centimeter-level accuracy, making it an attractive option for various industries. For instance, in healthcare, this technology can be used for tracking patients' vital signs and monitoring their movements. In aerospace, it can be used for high-resolution imaging and wireless communication. UWB's transformative impact can also be seen In the entertainment industry, where it is used for wireless data transmission and connectivity. It enables contactless solutions such as keyless entry systems and smart homes.
Moreover, in logistics, it is used for industrial asset tracking and motion sensing, reducing the need for manual labor and increasing efficiency. Moreover, UWB technology is ideal for applications where battery life is a concern. It offers self-forming networks, which eliminates the need for installation costs and complex wiring. UWB chips can be integrated into smartphones, making it a viable solution for various applications. The accuracy and speed of UWB technology make it an attractive option for various industries. It offers high-resolution imaging, making it suitable for radar applications. Its low power consumption and wireless communication capabilities make it an ideal solution for various applications, including healthcare tracking, industrial automation, and smart electronic devices.
Furthermore, UWB technology's transformative impact is evident in its ability to offer high-accuracy, low-power, and wireless solutions for various industries. Its ability to measure distance and time accurately makes it an attractive option for applications such as industrial signaling, asset tracking, and motion sensing. With its continued development and adoption, UWB technology is poised to transform the way we communicate and interact with our environment.
|
UWB Anchor And Tags Market Scope |
|
|
Report Coverage |
Details |
|
Page number |
198 |
|
Base year |
2023 |
|
Historic period |
2018-2022 |
|
Forecast period |
2024-2028 |
|
Growth momentum & CAGR |
Accelerate at a CAGR of 14.8% |
|
Market growth 2024-2028 |
USD 1.51 billion |
|
Market structure |
Fragmented |
|
YoY growth 2023-2024(%) |
14.1 |
|
Key countries |
US, Germany, UK, China, France, Japan, India, Canada, South Korea, and Brazil |
|
Competitive landscape |
Leading Companies, Market Positioning of Companies, Competitive Strategies, and Industry Risks |
What are the Key Data Covered in this UWB Anchor And Tags Market Research and Growth Report?
- CAGR of the UWB Anchor And Tags industry during the forecast period
- Detailed information on factors that will drive the UWB Anchor And Tags growth and forecasting between 2024 and 2028
- Precise estimation of the size of the market and its contribution of the industry in focus to the parent market
- Accurate predictions about upcoming growth and trends and changes in consumer behaviour
- Growth of the market across North America, Europe, APAC, South America, and Middle East and Africa
- Thorough analysis of the market's competitive landscape and detailed information about companies
- Comprehensive analysis of factors that will challenge the uwb anchor and tags market growth of industry companies
We can help! Our analysts can customize this uwb anchor and tags market research report to meet your requirements.
 RIA -
RIA - 
