V2L Inverters Market Size 2024-2028
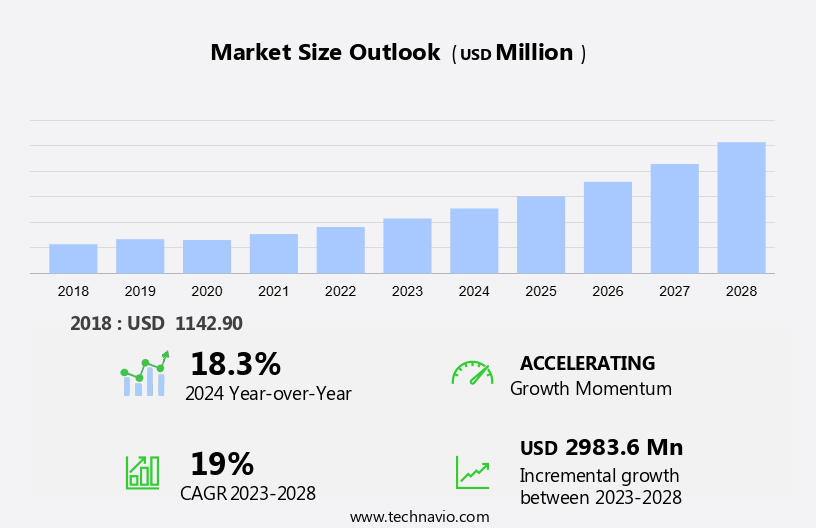
The V2L inverters market size is forecast to increase by USD 2.98 billion at a CAGR of 19% between 2023 and 2028.
- The market is witnessing significant growth due to the increasing sales of electric vehicles (EVs) and the launch of new inverter models. The market is driven by the need for efficient energy transfer from the grid to EVs and other electrical devices. However, high development and manufacturing costs pose a challenge to market growth. The market is expected to grow at a steady pace, with advancements in technology leading to cost reductions and increased efficiency. Additionally, the increasing focus on renewable energy and the integration of V2L inverters into smart grid systems are expected to provide significant opportunities for market growth. Overall, the market is a dynamic and evolving space, with a strong focus on innovation and cost reduction.
What will be the Size of the V2L Inverters Market During the Forecast Period?
- The market encompasses the production, sales, and integration of inverters that facilitate the conversion of DC power from renewable energy sources, such as solar panels, into AC power for various appliances and loads. This market caters to a diverse range of applications, including powering AC appliances like televisions, laptops, refrigerators, and even EV charging stations. Integrated inverters, which combine the functions of an inverter and a bidirectional charger, are gaining popularity due to their efficiency and versatility. V2L inverters also play a crucial role in vehicle-to-grid (V2G) systems, enabling bi-directional power flow between electric vehicles and the grid. The market is driven by the increasing adoption of renewable energy sources, the growing demand for backup power solutions, and the integration of V2L inverters in off-grid solar systems.
- Moreover, the market is expected to grow significantly due to the increasing power rating demands, with continuous and peak ratings ranging from kilowatts (kw) to amps (a), and the increasing importance of load run-time and load rating in ensuring optimal performance.
How is this V2L Inverters Industry segmented and which is the largest segment?
The V2L inverters industry research report provides comprehensive data (region-wise segment analysis), with forecasts and estimates in "USD billion" for the period 2024-2028, as well as historical data from 2018-2022 for the following segments.
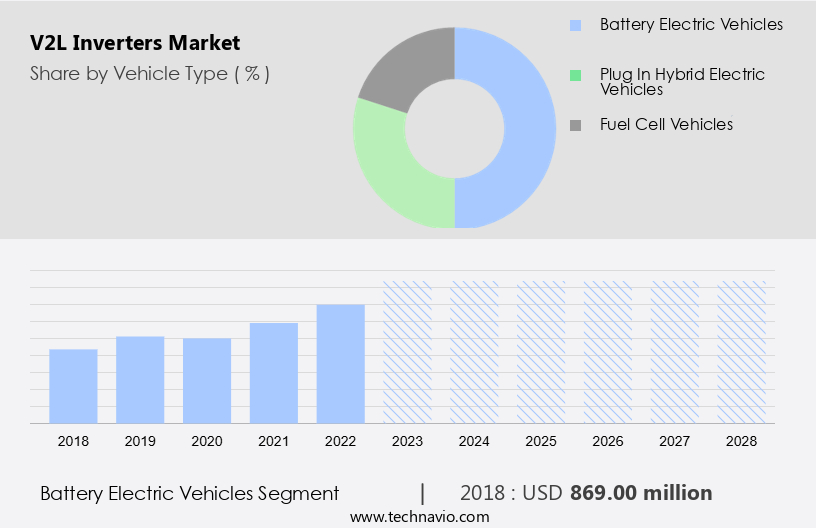
- Vehicle Type
- Battery electric vehicles
- Plug in hybrid electric vehicles
- Fuel cell vehicles
- Application
- Residential use
- Commercial use
- Industrial use
- Geography
- North America
- Canada
- US
- Europe
- Germany
- UK
- France
- Norway
- APAC
- China
- Japan
- South Korea
- South America
- Middle East and Africa
- North America
By Vehicle Type Insights
- The battery electric vehicles segment is estimated to witness significant growth during the forecast period.
The market is witnessing significant growth due to the increasing integration of renewable energy sources and advanced technology in various applications. Battery electric vehicles (BEVs) are leading this market trend, enabling them to function as both a means of transportation and a mobile energy storage solution. This innovation allows BEVs to supply electricity to appliances, lights, laptops, TVs, refrigerators, and even power grids during emergencies or peak demand periods. The next-generation Neue Klasse electric vehicles by BMW Group, set to launch in 2025, are a prime example of this development. These vehicles will not only be capable of storing electricity but also sending it back to the grid or powering homes, acting as versatile mobile power sources.
Get a glance at the V2L Inverters Industry report of share of various segments Request Free Sample
The battery electric vehicles segment was valued at USD 869.00 million in 2018 and showed a gradual increase during the forecast period.
Regional Analysis
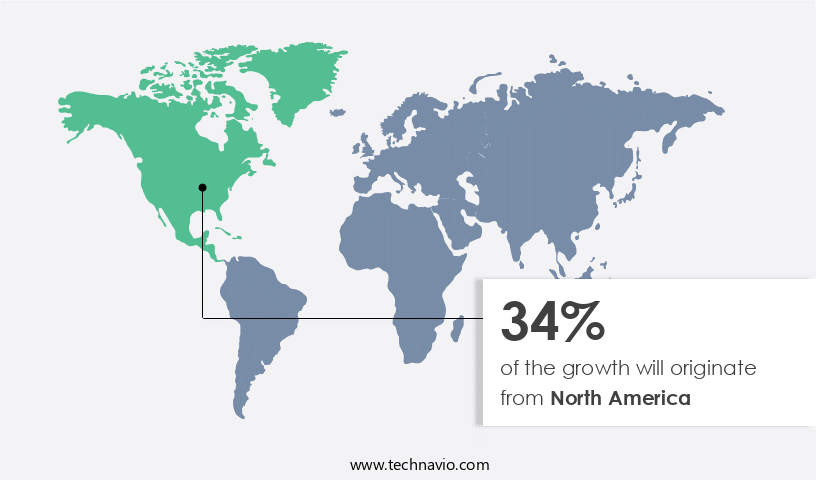
- North America is estimated to contribute 34% to the growth of the global market during the forecast period.
Technavio's analysts have elaborately explained the regional trends and drivers that shape the market during the forecast period.
For more insights on the market share of various regions, Request Free Sample
The North American market is playing a pivotal role In the market due to technological advancements in grid-forming inverters and a growing focus on renewable energy integration. The U.S. Department of Energy (DOE) is leading this transition, with initiatives such as the UNIFI consortium, funded by a USD 25 million grant from the Solar Energy and Wind Energy Technologies Offices. Grid-forming inverters convert DC power from renewable sources into AC power for the grid, improving its stability and efficiency. V2L inverters enable energy flow between the grid and electric vehicles (EVs) or off-grid systems, supporting V2H and V2G applications.
Market Dynamics
Our researchers analyzed the data with 2023 as the base year, along with the key drivers, trends, and challenges. A holistic analysis of drivers will help companies refine their marketing strategies to gain a competitive advantage.
What are the key market drivers leading to the rise In the adoption of V2L Inverters Industry?
Growing sales of electric vehicles is the key driver of the market.
- The market is experiencing significant growth due to the increasing sales of electric vehicles (EVs). By 2024, the revenue In the EV sector is projected to reach approximately USD786 billion worldwide. This growth is driven by the rising demand for both fully electric (BEV) and plug-in hybrid vehicles (PHEV). In September 2024, global sales of EVs saw an impressive annual increase of about 29.5%, with China achieving record numbers that surpassed its previous peak in August 2024. Europe also resumed its growth trajectory In the EV sector in October 2024. Chinese carmakers, despite facing import duties and declining global demand, continue to expand their sales In the EU.
- In addition, V2L inverters play a crucial role in enabling bidirectional power flow between EVs and household appliances or the power grid. They facilitate the integration of EVs into the power supply system, allowing for vehicle-to-grid (V2G) and vehicle-to-home (V2H) applications. These inverters enable EVs to act as energy storage systems during off-peak hours and provide backup power during blackouts. They also support the integration of solar energy storage systems and can be used with extension power leads, emergency backup power, and bidirectional chargers. V2L inverters have various power ratings, from kilowatts (kW) to amps (A), and support continuous and peak ratings, load run-time, load rating, and common appliances such as lights, appliances, laptops, TVs, refrigerators, and critical appliances.
What are the market trends shaping the V2L Inverters Industry?
Product launches is the upcoming market trend.
- The market is witnessing significant advancements, driven by the development of integrated inverters for various applications. For instance, ABB launched an innovative propulsion package for electric buses in May 2024, which includes the AMXE250 motor and HES580 inverter. This solution offers improved efficiency and sustainability, with the HES580 inverter being the first 3-level inverter for electric buses. It delivers superior energy efficiency and power output, resulting in up to 12% fewer motor losses on typical drive cycles and up to 75% reduction in motor harmonic losses compared to conventional 2-level inverters. This innovation is essential for powering household appliances, such as AC appliances, lights, laptops, TVs, refrigerators, and even charging electric vehicles (EVs) through bidirectional charging or vehicle-to-home (V2H) and vehicle-to-grid (V2G) systems.
- Furthermore, the market growth is further fueled by the increasing adoption of solar energy storage, smart meters, and bidirectional EV chargers with CHAdeMO plugs. The market is poised for growth, offering solutions for emergency backup power, extension power leads, and off-grid solar systems, while also reducing the reliance on diesel and petrol generators. The integration of bi-directional power flow, lithium-ion batteries, and energy management systems is transforming the power supply landscape, enabling efficient energy consumption and smart grid integration.
What challenges does the V2L Inverters Industry face during its growth?
High development and manufacturing costs is a key challenge affecting the industry growth.
- The global market for V2L inverters is experiencing growth driven by the increasing adoption of electric vehicles (EVs) and the integration of renewable energy sources into power grids. These inverters enable bidirectional power flow between EVs and appliances or grids, allowing for vehicle-to-home (V2H) and vehicle-to-grid (V2G) applications. Key components of EV drivetrain inverters, such as silicon carbide (SiC) and gallium nitride (GaN) semiconductors, play essential roles in converting DC battery voltage to AC waveforms. SiC can handle higher power levels, making it suitable for more powerful EVs, while GaN offers faster switching capabilities. However, the high cost of SiC devices remains a significant challenge.
- Despite this hurdle, advancements in technology continue to drive innovation. For instance, Tesla's adoption of SiC technology in its Model 3 drive train inverter marked a significant expansion of the SiC industry, with potential implications beyond the transportation sector. V2L inverters are also crucial for emergency backup power, enabling the use of appliances, lights, laptops, TVs, and even refrigerators during power outages. They can be integrated with lithium-ion batteries, solar energy storage, and smart meters to optimize energy consumption and provide reliable power supply. Bidirectional chargers, V2G systems, and extension power leads further expand the application scope of V2L inverters, enabling energy trading between EVs and grids, providing power to off-grid solar systems, and supplying power to diesel or petrol generators through changeover switches.
Exclusive Customer Landscape
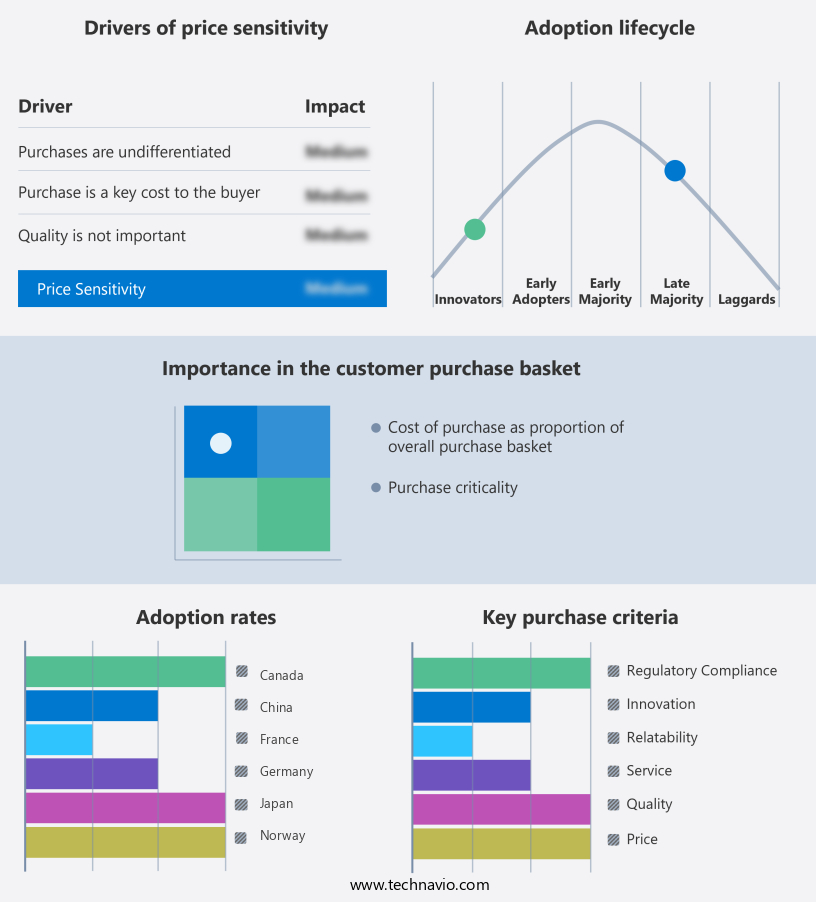
The V2L inverters market forecasting report includes the adoption lifecycle of the market, covering from the innovator's stage to the laggard's stage. It focuses on adoption rates in different regions based on penetration. Furthermore, the v2l inverters market report also includes key purchase criteria and drivers of price sensitivity to help companies evaluate and develop their market growth analysis strategies.
Customer Landscape
Key Companies & Market Insights
Companies are implementing various strategies, such as strategic alliances, v2l inverters market forecast, partnerships, mergers and acquisitions, geographical expansion, and product/service launches, to enhance their presence In the industry.
The industry research and growth report includes detailed analyses of the competitive landscape of the market and information about key companies, including:
- AG Electrical Technology Co. Ltd.
- Amphenol Corp.
- BorgWarner Inc.
- BYD Company Ltd
- Delta Electronics Inc.
- DENSO Corp.
- Eaton Corp plc
- Hitachi Astemo Ltd.
- Honda Motor Co. Ltd.
- KIA CORP.
- LTEC Corporation
- Marelli Holdings Co. Ltd.
- Shindengen Electric Manufacturing Co. Ltd.
- Toyota Industries Corp.
- Valeo SA
Qualitative and quantitative analysis of companies has been conducted to help clients understand the wider business environment as well as the strengths and weaknesses of key industry players. Data is qualitatively analyzed to categorize companies as pure play, category-focused, industry-focused, and diversified; it is quantitatively analyzed to categorize companies as dominant, leading, strong, tentative, and weak.
Research Analyst Overview
The AC power market encompasses a diverse range of applications, from powering household appliances and electronics to supplying energy to electric vehicles (EVs). One essential component of this market is the AC inverter, which converts DC power from renewable energy sources or batteries into AC power suitable for various loads. AC inverters play a crucial role in managing power flow in various scenarios. In the context of renewable energy systems, they facilitate the integration of solar energy into the power grid, ensuring a stable and consistent power supply. In the transportation sector, they enable vehicle-to-grid (V2G) and vehicle-to-home (V2H) applications, allowing EVs to serve as mobile energy storage systems and power sources.
In addition, the demand for AC inverters is driven by the increasing adoption of renewable energy sources and the growing popularity of electric appliances and EVs. Appliances such as lights, laptops, TVs, refrigerators, and freezers all require AC power to function efficiently. The integration of AC inverters in off-grid solar systems and backup power solutions ensures uninterrupted power supply during grid outages or power shortages. The AC inverter market is characterized by continuous innovation, with advancements in technology leading to improvements in power rating, load run-time, and bi-directional power flow. Integrated inverters, which combine the functions of an inverter and a charger, offer increased efficiency and convenience.
Furthermore, integrating an off-grid solar system with a bidirectional EV charger enables various power solutions for a household. When coupled with an electric vehicle (EV) and a V2H (vehicle-to-home) system, this configuration allows the EV's battery to power the house, supplying essential appliances like refrigerators and other AC outlets during a blackout. An integrated inverter ensures the conversion of DC power from the solar panels and the EV battery into usable AC voltage. To provide continuous power, a backup generator, either diesel or potentially powered by alternative fuels, can be connected through a changeover switch to provide power if the solar or EV battery is not enough. The changeover switch is an example of a break-then-make switch to help with continuous rating and avoid disruption. Furthermore, technologies like V2G (vehicle-to-grid) and the use of a virtual power plant (VPP) allow for power sharing with the grid. The setup also involves a generator inlet and power points, enhancing the system's adaptability and making it possible to manage both continuous and peak power requirements.
|
Market Scope |
|
|
Report Coverage |
Details |
|
Page number |
210 |
|
Base year |
2023 |
|
Historic period |
2018-2022 |
|
Forecast period |
2024-2028 |
|
Growth momentum & CAGR |
Accelerate at a CAGR of 19% |
|
Market growth 2024-2028 |
USD 2.98 billion |
|
Market structure |
Fragmented |
|
YoY growth 2023-2024(%) |
18.3 |
|
Key countries |
US, China, Germany, UK, France, Japan, Canada, South Korea, Norway, and The Netherlands |
|
Competitive landscape |
Leading Companies, market growth and forecasting , Market Positioning of Companies, Competitive Strategies, and Industry Risks |
What are the Key Data Covered in this V2L Inverters Market Research and Growth Report?
- CAGR of the V2L Inverters industry during the forecast period
- Detailed information on factors that will drive the growth and forecasting between 2024 and 2028
- Precise estimation of the size of the market and its contribution of the industry in focus to the parent market
- Accurate predictions about upcoming growth and trends and changes in consumer behaviour
- Growth of the market across North America, Europe, APAC, South America, and Middle East and Africa
- Thorough analysis of the market's competitive landscape and detailed information about companies
- Comprehensive analysis of factors that will challenge the V2L inverters market growth of industry companies
We can help! Our analysts can customize this V2L inverters market research report to meet your requirements.
 RIA -
RIA - 
