Value-Based Care Analytics Platforms Market Size and Growth Forecast 2026-2030
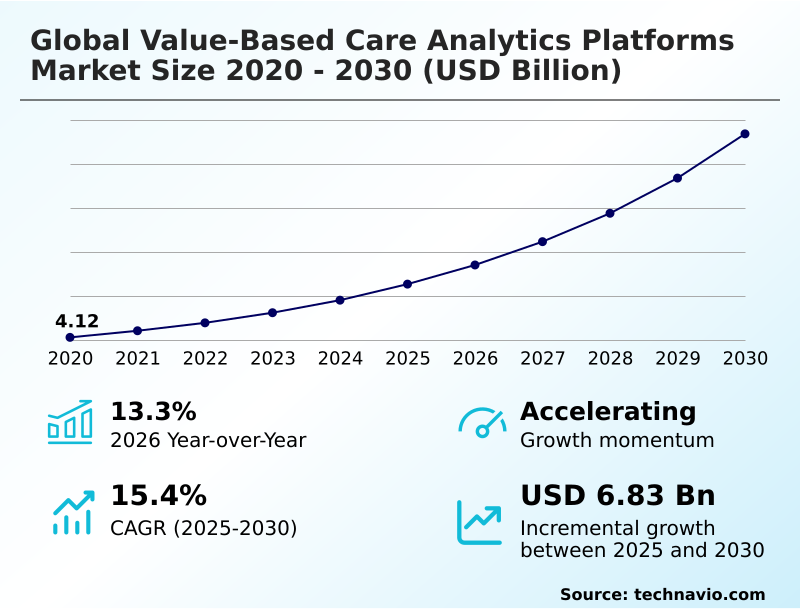
The Value-Based Care Analytics Platforms Market size was valued at USD 6.54 billion in 2025 growing at a CAGR of 15.4% during the forecast period 2026-2030.
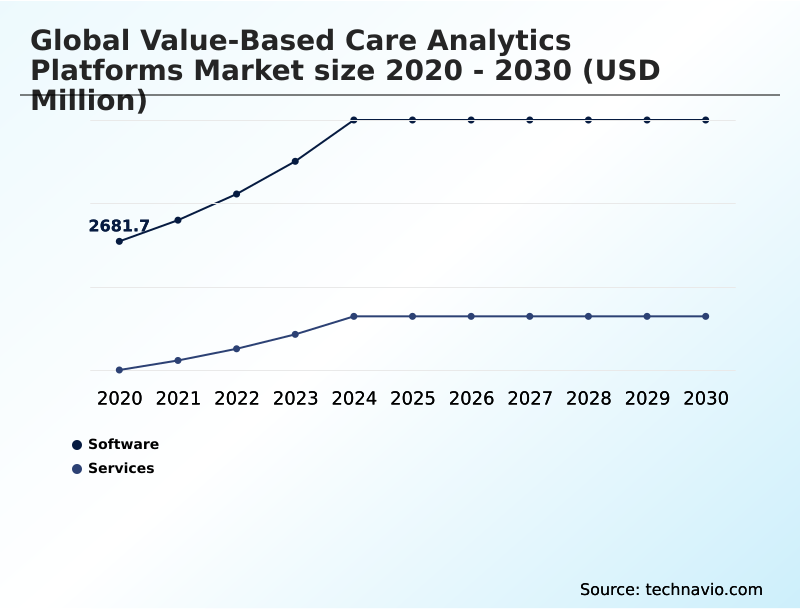
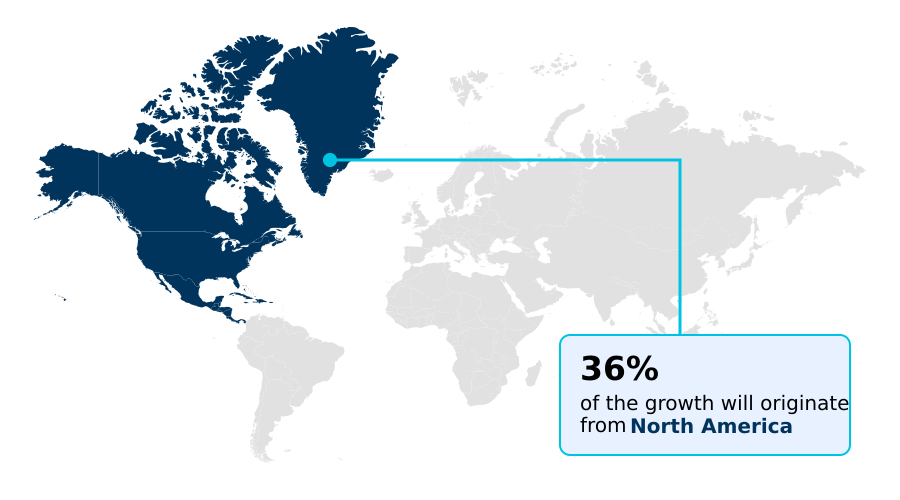
North America accounts for 36% of incremental growth during the forecast period. The Software segment by Component was valued at USD 3.85 billion in 2024, while the Hospitals and healthcare providers segment holds the largest revenue share by End-user.
The market is projected to grow by USD 9.25 billion from 2020 to 2030, with USD 6.83 billion of the growth expected during the forecast period of 2025 to 2030.
Get Key Insights on Market Forecast (PDF) Request Free Sample
Value-Based Care Analytics Platforms Market Overview
The value-based care analytics platforms market is defined by the critical need for healthcare organizations to manage the transition to outcome-focused payment structures. With North America contributing over 36% to the market's incremental growth, the pressure to adopt sophisticated data tools is immense. A key trend is the integration of AI-driven risk scoring and predictive analytics models to proactively manage patient populations. This allows a large hospital network, for instance, to deploy care coordination software that analyzes longitudinal patient records in real-time, identifying individuals at high risk for readmission and enabling targeted interventions. This shift is driven by the potential for significant cost reductions in chronic condition management. However, progress is often constrained by persistent data silos, making electronic health records integration a perpetual challenge. For procurement decision-makers, selecting a platform involves balancing advanced capabilities like care gap identification and patient engagement tools with the practicalities of implementation across diverse clinical workflows, all while navigating regulations like the Health Insurance Portability and Accountability Act (HIPAA).
Drivers, Trends, and Challenges in the Value-Based Care Analytics Platforms Market
Strategic adoption of value-based care analytics platforms is becoming essential for providers and payers navigating complex reimbursement landscapes. For instance, analytics for accountable care organizations are critical for managing shared risk, where a 1% improvement in predictive accuracy can translate into substantial savings.
A key component is integrating SDOH into clinical workflows, a process governed by privacy rules under frameworks like the Health Insurance Portability and Accountability Act (HIPAA).
In practice, a large health system might deploy AI platforms for population health management to stratify thousands of diabetic patients, identifying those at highest risk for complications based on a combination of clinical data and socioeconomic factors. This requires robust ehr-integrated population health management tools and effective financial risk management in healthcare analytics.
The goal is improving patient outcomes with data analytics, particularly in analytics platforms for chronic disease management. Success hinges on value-based care reporting and compliance, real-time interoperability with FHIR standards, and clear strategies for payer-provider collaboration through analytics platforms.
Decision-makers must evaluate everything from overcoming data silos in healthcare analytics to the security considerations for healthcare analytics platforms and the total cost of ownership when comparing cloud-based vs on-premise value-based care analytics.
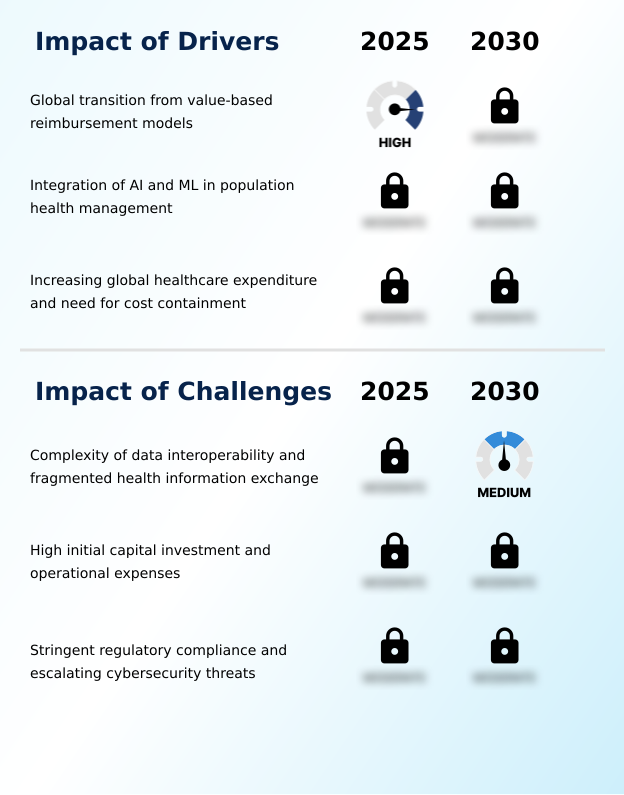
Primary Growth Driver: The primary driver for the market is the global healthcare industry's fundamental transition from traditional fee-for-service to value-based reimbursement models.
The market's robust expansion, marked by a projected 15.4% CAGR, is propelled by a confluence of economic and technological drivers. The fundamental driver remains the global transition to value-based payment models, which mandates a shift from volume to value.
This transition necessitates sophisticated tools for value-based contract modeling and total cost of care analysis. Furthermore, the integration of AI and machine learning has become a powerful catalyst, enabling advanced capabilities like AI-driven risk scoring and readmission risk prediction.
These technologies transform raw data into actionable intelligence, allowing healthcare organizations to contain costs and improve the quality of care. This focus on data-driven decision-making is a direct response to rising global healthcare expenditures.
Emerging Market Trend: A significant market trend is the increasing focus on cross-border data harmonization and regulatory alignment, particularly in Europe and the Asia-Pacific region. This movement aims to create interoperable health data ecosystems while adhering to stringent privacy standards.
Key trends are reshaping the capabilities of value-based care analytics platforms, with a focus on deeper data integration and proactive interventions. The systematic incorporation of social determinants of health data is moving from a niche concept to a standard feature, allowing for more accurate health equity analytics.
Concurrently, the drive for real-time interoperability, primarily through the adoption of FHIR standards, is enabling more effective clinical workflow automation and patient journey analytics. This is particularly critical in the fast-growing APAC market, which is projected to expand at a CAGR of 16.9%.
The goal is to create unified clinical data repositories that support advanced care management platforms, enabling providers to move from retrospective reporting to prospective care.
Key Industry Challenge: A key challenge restraining market growth is the inherent complexity of achieving data interoperability amid a fragmented health information exchange landscape.
Despite strong growth drivers, the value-based care analytics platforms market faces significant structural challenges that temper its adoption. The primary restraint is the complexity of achieving seamless data interoperability. Healthcare data remains fragmented across disparate systems, making the creation of a unified patient record for care quality improvement a costly and resource-intensive endeavor.
This is compounded by the high initial capital investment and ongoing operational expenses required for these advanced platforms, posing a barrier for smaller providers. Finally, the stringent regulatory environment, governed by laws such as HIPAA and GDPR, combined with escalating cybersecurity threats, places a heavy burden of compliance and security on both vendors and users, slowing innovation and deployment.
Explore Full Market Dynamics Analysis Request Free Sample
Value-Based Care Analytics Platforms Market Segmentation
The value-based care analytics platforms industry research report provides comprehensive data including region-wise segment analysis, with forecasts and analysis for the period 2026-2030, as well as historical data from 2020-2024 for the following segments.
Component Segment Analysis
The software segment is estimated to witness significant growth during the forecast period.
The software segment represents the core technological engine of the value-based care analytics platforms market, providing the digital tools essential for shifting from fee-for-service to outcome-oriented reimbursement.
These applications, which account for a significant portion of the market including a projected size of USD 4361.5 million in 2025, encompass a range of functionalities.
Core offerings include data integration engines for compiling disparate information from electronic health records, claims data analytics, and social determinants of health data. Stakeholders utilize these tools for financial performance tracking and to automate HEDIS reporting automation.
Advanced platforms incorporate risk stratification algorithms and clinical decision support systems, focusing on interoperability to ensure seamless information flow, a key component of effective care coordination software and chronic condition management.
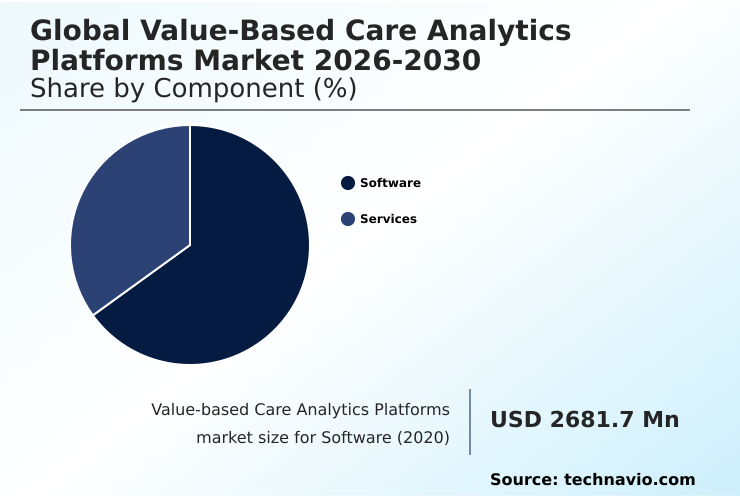
The Software segment was valued at USD 3.85 billion in 2024 and showed a gradual increase during the forecast period.
Value-Based Care Analytics Platforms Market by Region: North America Leads with 36% Growth Share
North America is estimated to contribute 36% to the growth of the global market during the forecast period.
The geographic landscape of the value-based care analytics platforms market is characterized by varied adoption rates and priorities.
North America, representing 36.04% of the market opportunity, leads due to established regulatory frameworks and a mature health IT infrastructure facilitating advanced healthcare analytics.
In contrast, the APAC region, which accounts for 26.08%, is the fastest-growing market, driven by government initiatives to modernize healthcare, especially in countries like China and India.
Europe follows with a 24.65% share, where the focus is on creating federated data networks compliant with GDPR.
A common thread across regions is the demand for platforms capable of patient cohort analysis and clinical data repositories to support population health intelligence and improve outcomes.
Customer Landscape Analysis for the Value-Based Care Analytics Platforms Market
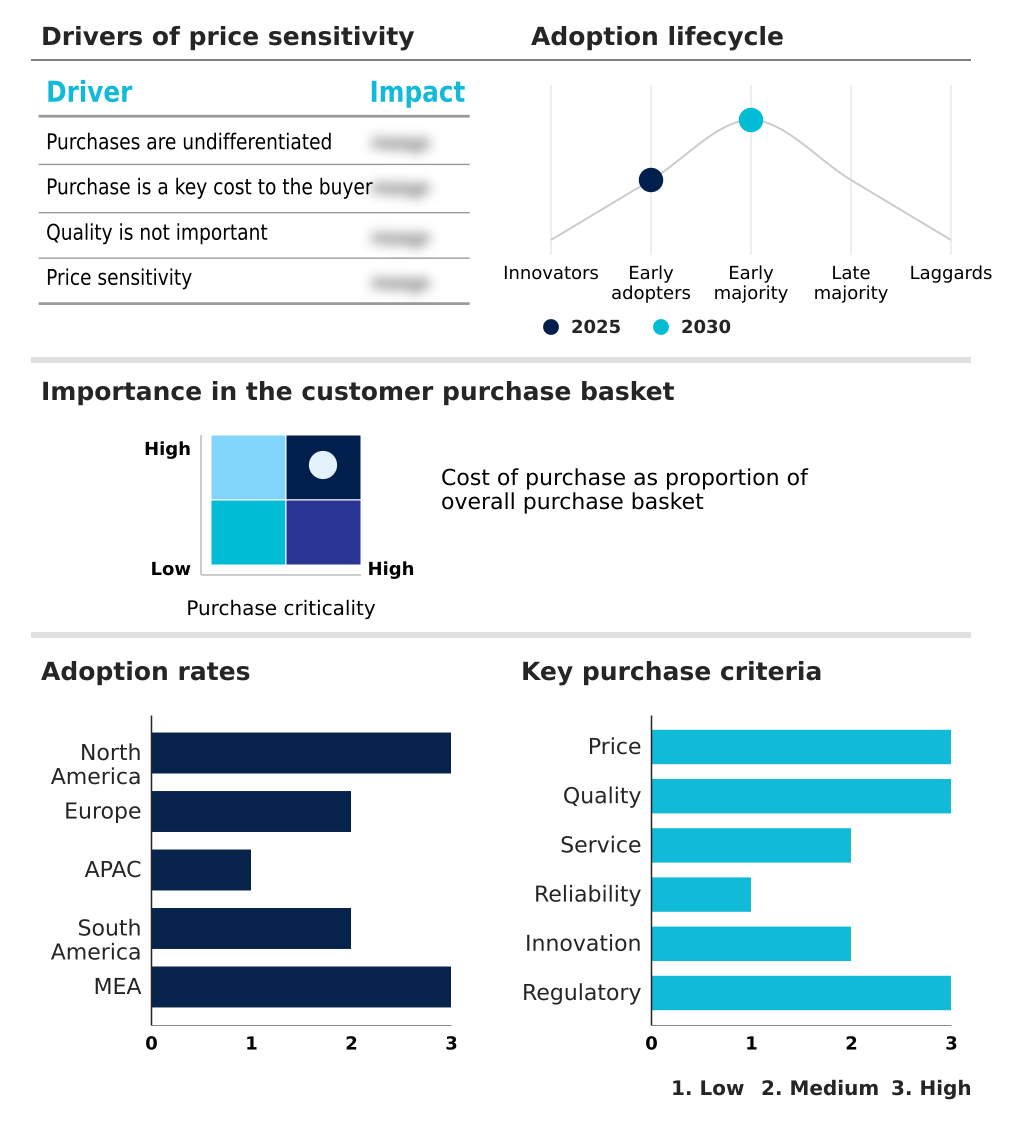
The value-based care analytics platforms market forecasting report includes the adoption lifecycle of the market, covering from the innovator’s stage to the laggard’s stage. It focuses on adoption rates in different regions based on penetration. Furthermore, the value-based care analytics platforms market report also includes key purchase criteria and drivers of price sensitivity to help companies evaluate and develop their market growth analysis strategies.
Competitive Landscape of the Value-Based Care Analytics Platforms Market
Companies are implementing various strategies, such as strategic alliances, partnerships, mergers and acquisitions, geographical expansion, and product/service launches, to enhance their presence in the value-based care analytics platforms market industry.
Arcadia Solutions LLC - Provides an enterprise-grade data platform focused on high-fidelity data integration to support population health initiatives and financial risk management in value-based care contracts.
The industry research and growth report includes detailed analyses of the competitive landscape of the market and information about key companies, including:
- Arcadia Solutions LLC
- Azara Healthcare
- Cedar Gate Technologies
- Clarify Health Solutions Inc.
- Conifer Health Solutions LLC
- Cotiviti Inc.
- CVS Health Corp.
- Epic Systems Corp.
- ExlService Holdings Inc.
- Gainwell Technologies LLC
- Health Catalyst Inc.
- Innovaccer Inc.
- Inovalon Holdings Inc.
- Lightbeam Health Solutions
- Medeanalytics Inc.
- Merative L.P.
- Persivia
- SpectraMedix
- United Health Group Inc.
- Vizient Inc.
Qualitative and quantitative analysis of companies has been conducted to help clients understand the wider business environment as well as the strengths and weaknesses of key industry players. Data is qualitatively analyzed to categorize companies as pure play, category-focused, industry-focused, and diversified; it is quantitatively analyzed to categorize companies as dominant, leading, strong, tentative, and weak.
Recent Developments in the Value-Based Care Analytics Platforms Market
- In May 2025, Health Catalyst Inc. announced the launch of its next-generation predictive analytics models, designed to provide more accurate readmission risk prediction and improve care transition management for large hospital systems.
- In March 2025, Innovaccer Inc. secured a major partnership with a large, multi-state accountable care organization to deploy its data aggregation platform, aiming to unify patient data and enhance provider performance benchmarking.
- In January 2025, Clarify Health Solutions Inc. released a new module for its analytics platform focused on health equity analytics, allowing payers and providers to identify and address care disparities using social determinants of health data.
- In November 2024, Epic Systems Corp. rolled out a significant update to its Healthy Planet module, enhancing its capabilities for ehr-integrated population health management tools and improving real-time clinical surveillance for chronic conditions.
Research Analyst Overview: Value-Based Care Analytics Platforms Market
The value-based care analytics platforms market is shifting toward more integrated and predictive solutions as healthcare organizations move beyond basic reporting. While the software segment remains dominant, the strategic value is now measured by a platform's ability to facilitate care transition management and clinical pathway optimization.
Boardroom decisions are increasingly influenced by a platform's capacity for prospective risk adjustment and its ability to provide clear provider performance benchmarking, which is essential for negotiating value-based contracts.
For example, compliance with the Medicare Access and CHIP Reauthorization Act (MACRA) requires sophisticated quality metrics reporting, making platforms with strong capabilities in this area a strategic necessity rather than a technical one. The focus is on systems that enable real-time data processing and support patient attribution logic to accurately measure performance.
Investment in these platforms is no longer just an IT expenditure but a core strategy for financial sustainability and clinical excellence, especially for managing a health information exchange effectively.
Dive into Technavio’s robust research methodology, blending expert interviews, extensive data synthesis, and validated models for unparalleled Value-Based Care Analytics Platforms Market insights. See full methodology.
| Market Scope | |
|---|---|
| Page number | 287 |
| Base year | 2025 |
| Historic period | 2020-2024 |
| Forecast period | 2026-2030 |
| Growth momentum & CAGR | Accelerate at a CAGR of 15.4% |
| Market growth 2026-2030 | USD 6831.5 million |
| Market structure | Fragmented |
| YoY growth 2025-2026(%) | 13.3% |
| Key countries | US, Canada, Mexico, UK, Germany, France, The Netherlands, Italy, Spain, China, India, Japan, Australia, South Korea, Indonesia, Brazil, Argentina, Colombia, Saudi Arabia, UAE, South Africa, Israel and Turkey |
| Competitive landscape | Leading Companies, Market Positioning of Companies, Competitive Strategies, and Industry Risks |
Value-Based Care Analytics Platforms Market: Key Questions Answered in This Report
-
What is the expected growth of the Value-Based Care Analytics Platforms Market between 2026 and 2030?
-
The Value-Based Care Analytics Platforms Market is expected to grow by USD 6.83 billion during 2026-2030, registering a CAGR of 15.4%. Year-over-year growth in 2026 is estimated at 13.3%%. This acceleration is shaped by global transition from value-based reimbursement models, which is intensifying demand across multiple end-use verticals covered in the report.
-
-
What segmentation does the market report cover?
-
The report is segmented by Component (Software, and Services), End-user (Hospitals and healthcare providers, Payers, and Accountable care organizations), Deployment (Cloud-based, and On-premises) and Geography (North America, Europe, APAC, South America, Middle East and Africa). Among these, the Software segment is estimated to witness significant growth during the forecast period, driven by rising adoption across key application areas. Each segment includes detailed qualitative and quantitative analysis, along with historical data from 2020-2024 and forecasts through 2030 with year-over-year growth rates.
-
-
Which regions are analyzed in the report?
-
The report covers North America, Europe, APAC, South America and Middle East and Africa. North America is estimated to contribute 36% to market growth during the forecast period. Country-level analysis includes US, Canada, Mexico, UK, Germany, France, The Netherlands, Italy, Spain, China, India, Japan, Australia, South Korea, Indonesia, Brazil, Argentina, Colombia, Saudi Arabia, UAE, South Africa, Israel and Turkey, with dedicated market size tables and year-over-year growth for each.
-
-
What are the key growth drivers and market challenges?
-
The primary driver is global transition from value-based reimbursement models, which is accelerating investment and industry demand. The main challenge is complexity of data interoperability and fragmented health information exchange, creating operational barriers for key market participants. The report quantifies the impact of each driver and challenge across 2026 and 2030 with comparative analysis.
-
-
Who are the major players in the Value-Based Care Analytics Platforms Market?
-
Key vendors include Arcadia Solutions LLC, Azara Healthcare, Cedar Gate Technologies, Clarify Health Solutions Inc., Conifer Health Solutions LLC, Cotiviti Inc., CVS Health Corp., Epic Systems Corp., ExlService Holdings Inc., Gainwell Technologies LLC, Health Catalyst Inc., Innovaccer Inc., Inovalon Holdings Inc., Lightbeam Health Solutions, Medeanalytics Inc., Merative L.P., Persivia, SpectraMedix, United Health Group Inc. and Vizient Inc.. The report provides qualitative and quantitative analysis categorizing companies as dominant, leading, strong, tentative, and weak based on their market positioning. Company profiles include business segment analysis, SWOT assessment, key offerings, and recent strategic developments.
-
Value-Based Care Analytics Platforms Market Research Insights
Market dynamics are heavily influenced by the push for greater efficiency and accountability in healthcare delivery. In North America, which accounts for 36.04% of the geographic opportunity, the adoption of value-based payment models is driven by mandates like the Medicare Access and CHIP Reauthorization Act (MACRA).
This contrasts with the APAC region, holding a 26.08% share, where growth is fueled by the digitalization of healthcare infrastructure. An operational scenario involves a multi-site accountable care organization using a data aggregation platform for total cost of care analysis across its provider network optimization efforts.
Such platforms facilitate healthcare provider collaboration and enable member engagement strategies by providing shared insights. The ability of these clinical analytics tools to deliver actionable intelligence for care quality improvement is a primary vendor qualification criterion for healthcare business intelligence teams.
We can help! Our analysts can customize this value-based care analytics platforms market research report to meet your requirements.
 RIA -
RIA - 
