Vehicle To Grid Chargers Market Analysis North America, Europe, APAC, South America, Middle East and Africa - US, UK, China, Canada, Japan - Size and Forecast 2024-2028

Vehicle To Grid Chargers Market Analysis North America, Europe, APAC, South America, Middle East and Africa - US, UK, China, Canada, Japan - Size and Forecast 2024-2028

Published: Jul 2024 146 Pages SKU: IRTNTR74199

Market Overview at a Glance

$5.41 B
Market Opportunity
24.07%
CAGR
19.07
YoY growth 2023-2024(%)

Vehicle To Grid Chargers Market Size 2024-2028 

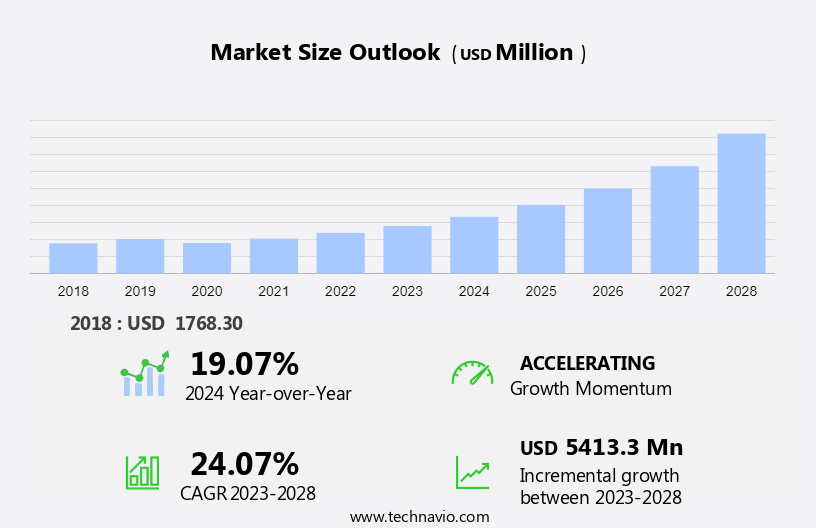
The vehicle to grid chargers market size is forecast to increase by USD 5.41 billion at a CAGR of 24.07% between 2023 and 2028. In the US market, the driver, trends, and challenges of the Vehicle-to-Grid (V2G) Chargers are shaped by several macroeconomic factors. The increasing adoption of electric vehicles (EVs) in society, driven by environmental concerns and government incentives, is a significant growth factor. The ability of V2G chargers to meet the growing demand for electricity by feeding excess power back into the grid is a key trend.

However, the high infrastructure cost is a major challenge. Employment rates in the US are expected to increase due to the growing demand for skilled labor in the installation and maintenance of V2G charging infrastructure. Smart cities, which prioritize energy efficiency and sustainability, are also expected to drive the market growth. Overall, the V2G chargers market in the US is poised for significant growth, driven by these trends and challenges.

Vehicle To Grid Chargers Market Size

 Request Free Sample

The vehicle to grid (V2G) chargers market is experiencing significant growth, driven by the increasing adoption of electric vehicles (EVs), including electric cars, plug-in electric vehicles (PHEVs), and plug-in hybrids (PHEVs). These chargers enable EVs to not only consume energy from the power grid but also supply surplus energy back to the grid. V2G chargers use advanced components such as bi-directional power converters, communication systems, and battery management systems. The technology allows electric automobiles to act as active participants in the electric power system, contributing to grid stability and energy balance.

Further, charging types include on-the-go and depot charging. On-the-go charging enables vehicles to sell energy back to the grid while they are being charged at public charging stations. Depot charging occurs at charging stations or garages, where EVs can store excess energy in their batteries and sell it back to the grid when needed. Urbanization and industrialization are key factors driving the growth of the V2G chargers market. Infrastructure development and standardization are crucial to ensuring the seamless integration of V2G technology into the power grid. As the EV market continues to expand, V2G chargers will play a vital role in optimizing energy usage and enhancing grid resilience.

Market Segmentation

The market research report provides comprehensive data (region-wise segment analysis), with forecasts and estimates in "USD million" for the period 2024-2028, as well as historical data from 2018-2022 for the following segments.
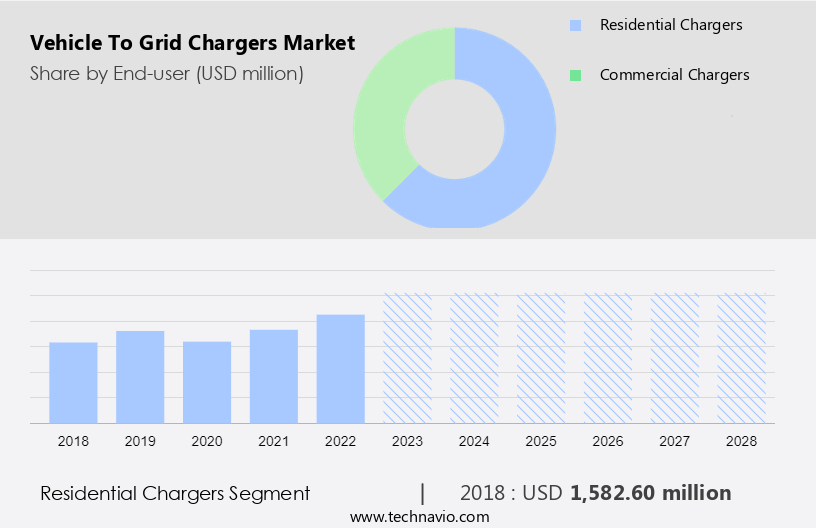
  • End-user
    • Residential chargers
    • Commercial chargers
  • Geography
    • North America
      • Canada
      • US
    • Europe
      • UK
    • APAC
      • China
      • Japan
    • South America
    • Middle East and Africa

By End-user Insights

The residential chargers segment is estimated to witness significant growth during the forecast period. Vehicle-to-Grid (V2G) chargers, also known as bi-directional home charging stations, enable Electric Vehicles (EVs) to transfer energy from their batteries to both homes and the power grid. Nissan, in collaboration with Eaton, introduced the xStorage bi-directional charging unit, which can power homes or be sent back to the grid. This innovative product achieved sales of over 1000 units within three months of its launch, underscoring its strong market acceptance. Nissan aims to sell more than 100,000 units in Europe. The proliferation of V2G chargers is contingent on various factors, including the expansion of commercial V2G infrastructure and the development of wireless charging technology for EVs.

Vehicle To Grid Chargers Market Size

Get a glance at the market share of various segments Request Free Sample

The residential chargers segment accounted for USD 1.58 billion in 2018 and showed a gradual increase during the forecast period.

Regional Insights

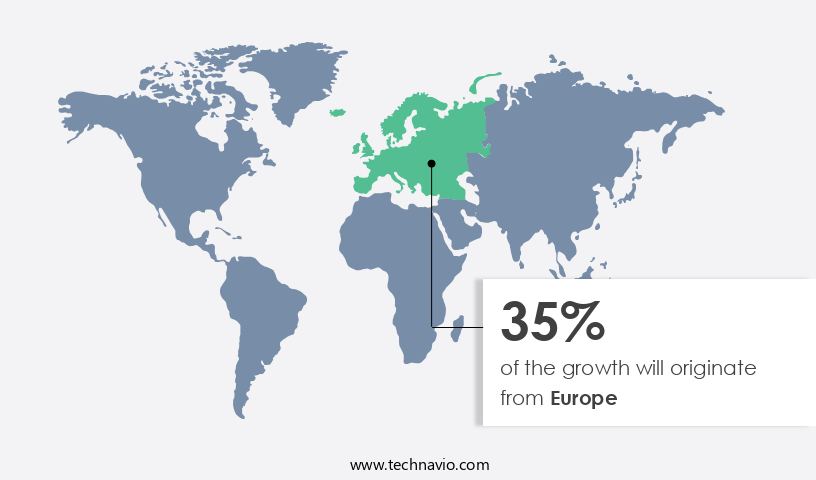
Europe is estimated to contribute 35% to the growth of the global market during the forecast period. Technavio's analysts have elaborately explained the regional trends and drivers that shape the market during the forecast period.

Vehicle To Grid Chargers Market Share by Geography

For more insights on the market share of various regions Request Free Sample

The United States is currently leading the global market for vehicle to grid (V2G) chargers due to the wave in electric vehicle (EV) sales and the expansion of charging infrastructure. In Mexico, the Federal Electricity Commission (CRE) has recently introduced new regulations, enabling individuals to sell excess electricity generated by solar panels or other renewable sources back to the power grid. This net metering policy is a significant step towards developing a more powerful distributed generation infrastructure. The growing popularity of EVs and the expanding charging infrastructure in the US, along with Mexico's net metering regulations, are major factors fueling the growth of the V2G chargers market.

Our researchers analyzed the data with 2023 as the base year, along with the key drivers, trends, and challenges. A holistic analysis of drivers will help companies refine their marketing strategies to gain a competitive advantage.

Market Driver

The ability to meet growing demand for electricity is the key driver of the market. Electric Vehicles (EVs) are gaining popularity due to their eco-friendly nature and the reduction of reliance on fossil fuels. Governments worldwide are encouraging their adoption through incentives and infrastructure development. Consequently, the number of EVs on the road is rising, leading to a ripple in demand for charging stations. Charging costs for EVs vary depending on the electricity demand. Different electric rate plans, such as flat-rate, tiered flat-rate, and critical peak pricing, determine the cost of charging based on the time of day. During peak hours, the cost is higher, while it is lower during off-peaks. The market for Vehicle to Grid (V2G) chargers is expected to grow significantly due to the increasing number of EVs and the need for efficient energy management.

Additionally, components of V2G chargers include bi-directional power converters, energy storage systems, and communication systems. Advanced Technology, such as smart grid and artificial intelligence, is being integrated into V2G chargers to optimize energy usage and grid stability. Charging types include opportunity charging and depot charging. Opportunity charging refers to charging at public charging stations, while depot charging occurs at charging stations located at garages or parking lots. The adoption of V2G chargers is expected to increase as governments and businesses seek to optimize energy usage and reduce carbon emissions.

Market Trends

Increasing adoption of EVs is the upcoming trend in the market. Electric Vehicles (EVs) emerged in the market in the 1990s but gained limited acceptance among consumers. However, with increased marketing efforts by manufacturers and growing awareness of environmental benefits, such as reduced air and noise pollution, the demand for EVs has significantly increased. Ford Motor Company provides comprehensive information on various EV types and related technologies on its website. Government incentives for both manufacturers and consumers have further boosted the market penetration of EVs.

Further, despite the initial higher total cost of ownership compared to conventional Internal Combustion Engine (ICE) vehicles, the long-term savings from lower fuel and maintenance costs make EVs an attractive option for environmentally-conscious consumers. The EV charging market comprises various components, including charging stations, charging cables, and charging connectors. Advanced charging technologies, such as Vehicle-to-Grid (V2G) and Fast Charging, are gaining popularity due to their ability to provide additional benefits to consumers and the grid.

Market Challenge

High infrastructure cost is a key challenge affecting market growth. Vehicle to Grid (V2G) charging systems enable bi-directional energy flow between electric vehicles (EVs) and the power grid. These systems require intricate infrastructure, including charging and discharging points, smart parking spaces, billing meters, and communication systems. The scale of managing EVs for substantial V2G supply is substantial, necessitating the investment in infrastructure to support approximately 30,000 EVs, each delivering 6.6kW at 50% discharge, equivalent to a 100 MW peaking gas turbine unit.

Additionally, the complexity and cost of V2G infrastructure increase with remote charging and discharging capabilities, which demand additional metering and billing systems connected to a central monitoring and controlling system. V2G technology components include batteries, power electronics, and communication systems, which require advanced technology to facilitate efficient energy exchange between vehicles and the grid.

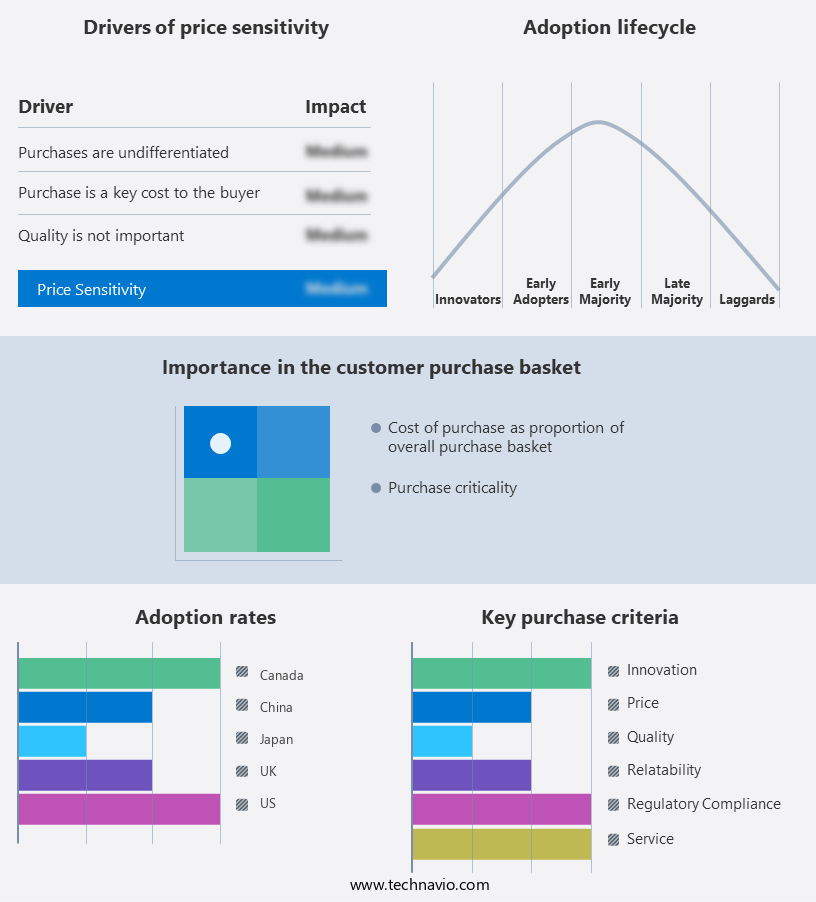
Exclusive Customer Landscape

The market forecasting report includes the adoption lifecycle of the market, covering from the innovator's stage to the laggard's stage. It focuses on adoption rates in different regions based on penetration. Furthermore, the report also includes key purchase criteria and drivers of price sensitivity to help companies evaluate and develop their market growth analysis strategies.

Vehicle To Grid Chargers Market Share by Geography

 Customer Landscape

Key Companies & Market Insights

Companies are implementing various strategies, such as strategic alliances, partnerships, mergers and acquisitions, geographical expansion, and product/service launches, to enhance their presence in the market.

  • Cenex: The company offers vehicle to grid chargers such as Sciurus.

The market research and growth report includes detailed analyses of the competitive landscape of the market and information about key companies, including:

  • ABB Ltd.
  • Enel Spa
  • ENGIE SA
  • EVTEC AG
  • Honda Motor Co. Ltd.
  • Hyundai Motor Co.
  • Liikennevirta Oy Ltd.
  • Magnum CAP
  • Mitsubishi Motors Corp.
  • Moixa Energy Holdings Ltd.
  • Nissan Motor Co. Ltd.
  • Nuvve Holding Corp.
  • OVO Group Ltd.
  • Renault SAS
  • Shell plc
  • The Mobility House GmbH
  • Toyota Motor Corp.
  • UK Power Networks Operations Ltd.

Qualitative and quantitative analysis of companies has been conducted to help clients understand the wider business environment as well as the strengths and weaknesses of key market players. Data is qualitatively analyzed to categorize companies as pure play, category-focused, industry-focused, and diversified; it is quantitatively analyzed to categorize companies as dominant, leading, strong, tentative, and weak.

Research Analyst Overview

The global vehicle-to-grid (V2G) chargers market is witnessing significant growth due to the increasing adoption of electric vehicles (EVs), including electric cars, plug-in electric vehicles (PHEVs), and plug-in hybrids (PHEVs). V2G technology enables these vehicles to supply excess energy stored in their batteries back to the power grid. Components: V2G chargers consist of bi-directional power converters, communication systems, and battery management systems. The technology is a crucial part of the electric power system, facilitating the integration of clean energy from electric automobiles into the power grid. Charging Type: V2G chargers support both charging and discharging, making them more versatile than traditional chargers. They can charge EVs when the grid has excess energy and discharge energy back to the grid when demand is high. Impact on Society and Economy: Urbanization and industrialization have led to increased energy demand and macroeconomic factors such as employment rates and clean energy initiatives.

Additionally, V2G technology offers a solution by providing a flexible and intelligent energy storage system, contributing to smart cities and smart infrastructures. Technology and Infrastructure: The V2G chargers market is driven by advancements in battery technology and the need for standardization in the electric automobile industry. This technology offers significant benefits, including grid stability, reduced energy costs, and improved energy efficiency. Estimations and Profit-Oriented Business Decisions: The V2G chargers market is expected to grow exponentially as more electric vehicles are adopted, and businesses recognize the potential for profit through energy trading and grid support services. This trend is set to continue as the world transitions towards a cleaner, more sustainable energy future.

Market Scope

Report Coverage

Details

Page number

146

Base year

2023

Historic period

2018-2022

Forecast period

2024-2028

Growth momentum & CAGR

Accelerate at a CAGR of 24.07%

Market Growth 2024-2028

USD 5.41 billion

Market structure

Fragmented

YoY growth 2023-2024(%)

19.07

Regional analysis

North America, Europe, APAC, South America, and Middle East and Africa

Performing market contribution

Europe at 35%

Key countries

US, UK, China, Canada, and Japan

Competitive landscape

Leading Companies, Market Positioning of Companies, Competitive Strategies, and Industry Risks

Key companies profiled

ABB Ltd., Cenex, Enel Spa, ENGIE SA, EVTEC AG, Honda Motor Co. Ltd., Hyundai Motor Co., Liikennevirta Oy Ltd., Magnum CAP, Mitsubishi Motors Corp., Moixa Energy Holdings Ltd., Nissan Motor Co. Ltd., Nuvve Holding Corp., OVO Group Ltd., Renault SAS, Shell plc, The Mobility House GmbH, Toyota Motor Corp., and UK Power Networks Operations Ltd.

Market dynamics

Parent market analysis, market growth inducers and obstacles, market forecast, fast-growing and slow-growing segment analysis, COVID-19 impact and recovery analysis and future consumer dynamics, market condition analysis for the forecast period

Customization purview

If our market report has not included the data that you are looking for, you can reach out to our analysts and get segments customized.

Request Free Sample

What are the Key Data Covered in this Market Research and Growth Report?

  • CAGR of the market during the forecast period
  • Detailed information on factors that will drive the market growth and forecasting between 2024 and 2028
  • Precise estimation of the size of the market  and its contribution of the market in focus to the parent market
  • Accurate predictions about upcoming market growth and trends and changes in consumer behaviour
  • Growth of the market across North America, Europe, APAC, South America, and Middle East and Africa
  • Thorough analysis of the market's competitive landscape and detailed information about companies
  • Comprehensive analysis of factors that will challenge the growth of market companies

We can help! Our analysts can customize this market research report to meet your requirements. Get in touch

1 Executive Summary

  • 1.1 Market overview
    • Executive Summary - Chart on Market Overview
    • Executive Summary - Data Table on Market Overview
    • Executive Summary - Chart on Global Market Characteristics
    • Executive Summary - Chart on Market by Geography
    • Executive Summary - Chart on Market Segmentation by End-user
    • Executive Summary - Chart on Incremental Growth
    • Executive Summary - Data Table on Incremental Growth
    • Executive Summary - Chart on Company Market Positioning

2 Market Landscape

  • 2.1 Market ecosystem
    • Parent Market
    • Data Table on - Parent Market
  • 2.2 Market characteristics
    • Market characteristics analysis
  • 2.3 Value chain analysis
    • Value Chain Analysis

3 Market Sizing

  • 3.1 Market definition
    • Offerings of companies included in the market definition
  • 3.2 Market segment analysis
    • Market segments
  • 3.3 Market size 2023
    • 3.4 Market outlook: Forecast for 2023-2028
      • Chart on Global - Market size and forecast 2023-2028 ($ million)
      • Data Table on Global - Market size and forecast 2023-2028 ($ million)
      • Chart on Global Market: Year-over-year growth 2023-2028 (%)
      • Data Table on Global Market: Year-over-year growth 2023-2028 (%)

    4 Historic Market Size

    • 4.1 Global Vehicle To Grid Chargers Market 2018 - 2022
      • Historic Market Size - Data Table on Global Vehicle To Grid Chargers Market 2018 - 2022 ($ million)
    • 4.2 End-user segment analysis 2018 - 2022
      • Historic Market Size - End-user Segment 2018 - 2022 ($ million)
    • 4.3 Geography segment analysis 2018 - 2022
      • Historic Market Size - Geography Segment 2018 - 2022 ($ million)
    • 4.4 Country segment analysis 2018 - 2022
      • Historic Market Size - Country Segment 2018 - 2022 ($ million)

    5 Five Forces Analysis

    • 5.1 Five forces summary
      • Five forces analysis - Comparison between 2023 and 2028
    • 5.2 Bargaining power of buyers
      • Bargaining power of buyers - Impact of key factors 2023 and 2028
    • 5.3 Bargaining power of suppliers
      • Bargaining power of suppliers - Impact of key factors in 2023 and 2028
    • 5.4 Threat of new entrants
      • Threat of new entrants - Impact of key factors in 2023 and 2028
    • 5.5 Threat of substitutes
      • Threat of substitutes - Impact of key factors in 2023 and 2028
    • 5.6 Threat of rivalry
      • Threat of rivalry - Impact of key factors in 2023 and 2028
    • 5.7 Market condition
      • Chart on Market condition - Five forces 2023 and 2028

    6 Market Segmentation by End-user

    • 6.1 Market segments
      • Chart on End-user - Market share 2023-2028 (%)
      • Data Table on End-user - Market share 2023-2028 (%)
    • 6.2 Comparison by End-user
      • Chart on Comparison by End-user
      • Data Table on Comparison by End-user
    • 6.3 Residential chargers - Market size and forecast 2023-2028
      • Chart on Residential chargers - Market size and forecast 2023-2028 ($ million)
      • Data Table on Residential chargers - Market size and forecast 2023-2028 ($ million)
      • Chart on Residential chargers - Year-over-year growth 2023-2028 (%)
      • Data Table on Residential chargers - Year-over-year growth 2023-2028 (%)
    • 6.4 Commercial chargers - Market size and forecast 2023-2028
      • Chart on Commercial chargers - Market size and forecast 2023-2028 ($ million)
      • Data Table on Commercial chargers - Market size and forecast 2023-2028 ($ million)
      • Chart on Commercial chargers - Year-over-year growth 2023-2028 (%)
      • Data Table on Commercial chargers - Year-over-year growth 2023-2028 (%)
    • 6.5 Market opportunity by End-user
      • Market opportunity by End-user ($ million)
      • Data Table on Market opportunity by End-user ($ million)

    7 Customer Landscape

    • 7.1 Customer landscape overview
      • Analysis of price sensitivity, lifecycle, customer purchase basket, adoption rates, and purchase criteria

    8 Geographic Landscape

    • 8.1 Geographic segmentation
      • Chart on Market share by geography 2023-2028 (%)
      • Data Table on Market share by geography 2023-2028 (%)
    • 8.2 Geographic comparison
      • Chart on Geographic comparison
      • Data Table on Geographic comparison
    • 8.3 North America - Market size and forecast 2023-2028
      • Chart on North America - Market size and forecast 2023-2028 ($ million)
      • Data Table on North America - Market size and forecast 2023-2028 ($ million)
      • Chart on North America - Year-over-year growth 2023-2028 (%)
      • Data Table on North America - Year-over-year growth 2023-2028 (%)
    • 8.4 Europe - Market size and forecast 2023-2028
      • Chart on Europe - Market size and forecast 2023-2028 ($ million)
      • Data Table on Europe - Market size and forecast 2023-2028 ($ million)
      • Chart on Europe - Year-over-year growth 2023-2028 (%)
      • Data Table on Europe - Year-over-year growth 2023-2028 (%)
    • 8.5 APAC - Market size and forecast 2023-2028
      • Chart on APAC - Market size and forecast 2023-2028 ($ million)
      • Data Table on APAC - Market size and forecast 2023-2028 ($ million)
      • Chart on APAC - Year-over-year growth 2023-2028 (%)
      • Data Table on APAC - Year-over-year growth 2023-2028 (%)
    • 8.6 South America - Market size and forecast 2023-2028
      • Chart on South America - Market size and forecast 2023-2028 ($ million)
      • Data Table on South America - Market size and forecast 2023-2028 ($ million)
      • Chart on South America - Year-over-year growth 2023-2028 (%)
      • Data Table on South America - Year-over-year growth 2023-2028 (%)
    • 8.7 Middle East and Africa - Market size and forecast 2023-2028
      • Chart on Middle East and Africa - Market size and forecast 2023-2028 ($ million)
      • Data Table on Middle East and Africa - Market size and forecast 2023-2028 ($ million)
      • Chart on Middle East and Africa - Year-over-year growth 2023-2028 (%)
      • Data Table on Middle East and Africa - Year-over-year growth 2023-2028 (%)
    • 8.8 US - Market size and forecast 2023-2028
      • Chart on US - Market size and forecast 2023-2028 ($ million)
      • Data Table on US - Market size and forecast 2023-2028 ($ million)
      • Chart on US - Year-over-year growth 2023-2028 (%)
      • Data Table on US - Year-over-year growth 2023-2028 (%)
    • 8.9 UK - Market size and forecast 2023-2028
      • Chart on UK - Market size and forecast 2023-2028 ($ million)
      • Data Table on UK - Market size and forecast 2023-2028 ($ million)
      • Chart on UK - Year-over-year growth 2023-2028 (%)
      • Data Table on UK - Year-over-year growth 2023-2028 (%)
    • 8.10 China - Market size and forecast 2023-2028
      • Chart on China - Market size and forecast 2023-2028 ($ million)
      • Data Table on China - Market size and forecast 2023-2028 ($ million)
      • Chart on China - Year-over-year growth 2023-2028 (%)
      • Data Table on China - Year-over-year growth 2023-2028 (%)
    • 8.11 Canada - Market size and forecast 2023-2028
      • Chart on Canada - Market size and forecast 2023-2028 ($ million)
      • Data Table on Canada - Market size and forecast 2023-2028 ($ million)
      • Chart on Canada - Year-over-year growth 2023-2028 (%)
      • Data Table on Canada - Year-over-year growth 2023-2028 (%)
    • 8.12 Japan - Market size and forecast 2023-2028
      • Chart on Japan - Market size and forecast 2023-2028 ($ million)
      • Data Table on Japan - Market size and forecast 2023-2028 ($ million)
      • Chart on Japan - Year-over-year growth 2023-2028 (%)
      • Data Table on Japan - Year-over-year growth 2023-2028 (%)
    • 8.13 Market opportunity by geography
      • Market opportunity by geography ($ million)
      • Data Tables on Market opportunity by geography ($ million)

    9 Drivers, Challenges, and Opportunity/Restraints

    • 9.1 Market drivers
      • 9.2 Market challenges
        • 9.3 Impact of drivers and challenges
          • Impact of drivers and challenges in 2023 and 2028
        • 9.4 Market opportunities/restraints

          10 Competitive Landscape

          • 10.1 Overview
            • 10.2 Competitive Landscape
              • Overview on criticality of inputs and factors of differentiation
            • 10.3 Landscape disruption
              • Overview on factors of disruption
            • 10.4 Industry risks
              • Impact of key risks on business

            11 Competitive Analysis

            • 11.1 Companies profiled
              • Companies covered
            • 11.2 Market positioning of companies
              • Matrix on companies position and classification
            • 11.3 Cenex
              • Cenex - Overview
              • Cenex - Product / Service
              • Cenex - Key offerings
            • 11.4 Enel Spa
              • Enel Spa - Overview
              • Enel Spa - Product / Service
              • Enel Spa - Key news
              • Enel Spa - Key offerings
            • 11.5 ENGIE SA
              • ENGIE SA - Overview
              • ENGIE SA - Business segments
              • ENGIE SA - Key news
              • ENGIE SA - Key offerings
              • ENGIE SA - Segment focus
            • 11.6 EVTEC AG
              • EVTEC AG - Overview
              • EVTEC AG - Product / Service
              • EVTEC AG - Key offerings
            • 11.7 Hyundai Motor Co.
              • Hyundai Motor Co. - Overview
              • Hyundai Motor Co. - Business segments
              • Hyundai Motor Co. - Key news
              • Hyundai Motor Co. - Key offerings
              • Hyundai Motor Co. - Segment focus
            • 11.8 Liikennevirta Oy Ltd.
              • Liikennevirta Oy Ltd. - Overview
              • Liikennevirta Oy Ltd. - Product / Service
              • Liikennevirta Oy Ltd. - Key offerings
            • 11.9 Magnum CAP
              • Magnum CAP - Overview
              • Magnum CAP - Product / Service
              • Magnum CAP - Key offerings
            • 11.10 Mitsubishi Motors Corp.
              • Mitsubishi Motors Corp. - Overview
              • Mitsubishi Motors Corp. - Business segments
              • Mitsubishi Motors Corp. - Key offerings
              • Mitsubishi Motors Corp. - Segment focus
            • 11.11 Nissan Motor Co. Ltd.
              • Nissan Motor Co. Ltd. - Overview
              • Nissan Motor Co. Ltd. - Business segments
              • Nissan Motor Co. Ltd. - Key news
              • Nissan Motor Co. Ltd. - Key offerings
              • Nissan Motor Co. Ltd. - Segment focus
            • 11.12 Nuvve Holding Corp.
              • Nuvve Holding Corp. - Overview
              • Nuvve Holding Corp. - Product / Service
              • Nuvve Holding Corp. - Key offerings

            12 Appendix

            • 12.1 Scope of the report
              • 12.2 Inclusions and exclusions checklist
                • Inclusions checklist
                • Exclusions checklist
              • 12.3 Currency conversion rates for US$
                • Currency conversion rates for US$
              • 12.4 Research methodology
                • Research methodology
              • 12.5 Data procurement
                • Information sources
              • 12.6 Data validation
                • Data validation
              • 12.7 Validation techniques employed for market sizing
                • Validation techniques employed for market sizing
              • 12.8 Data synthesis
                • Data synthesis
              • 12.9 360 degree market analysis
                • 360 degree market analysis
              • 12.10 List of abbreviations
                • List of abbreviations

              Research Methodology

              Technavio presents a detailed picture of the market by way of study, synthesis, and summation of data from multiple sources. The analysts have presented the various facets of the market with a particular focus on identifying the key industry influencers. The data thus presented is comprehensive, reliable, and the result of extensive research, both primary and secondary.

              INFORMATION SOURCES

              Primary sources

              • Manufacturers and suppliers
              • Channel partners
              • Industry experts
              • Strategic decision makers

              Secondary sources

              • Industry journals and periodicals
              • Government data
              • Financial reports of key industry players
              • Historical data
              • Press releases

              DATA ANALYSIS

              Data Synthesis

              • Collation of data
              • Estimation of key figures
              • Analysis of derived insights

              Data Validation

              • Triangulation with data models
              • Reference against proprietary databases
              • Corroboration with industry experts

              REPORT WRITING

              Qualitative

              • Market drivers
              • Market challenges
              • Market trends
              • Five forces analysis

              Quantitative

              • Market size and forecast
              • Market segmentation
              • Geographical insights
              • Competitive landscape

              Interested in this report?

              Get your sample now to see our research methodology and insights!

              Download Now

              Frequently Asked Questions

              Vehicle To Grid Chargers market growth will increase by $ 5413.3 mn during 2024-2028.

              The Vehicle To Grid Chargers market is expected to grow at a CAGR of 24.07% during 2024-2028.

              Vehicle To Grid Chargers market is segmented by End-user( Residential chargers, Commercial chargers)

              ABB Ltd., Cenex, Enel Spa, ENGIE SA, EVTEC AG, Honda Motor Co. Ltd., Hyundai Motor Co., Liikennevirta Oy Ltd., Magnum CAP, Mitsubishi Motors Corp., Moixa Energy Holdings Ltd., Nissan Motor Co. Ltd., Nuvve Holding Corp., OVO Group Ltd., Renault SAS, Shell plc, The Mobility House GmbH, Toyota Motor Corp., UK Power Networks Operations Ltd. are a few of the key vendors in the Vehicle To Grid Chargers market.

              Europe will register the highest growth rate of 35% among the other regions. Therefore, the Vehicle To Grid Chargers market in Europe is expected to garner significant business opportunities for the vendors during the forecast period.

              US, UK, China, Canada, Japan

              • Ability to meet growing demand for electricityEVs have the potential to reduce pollution and dependence on fossil fuels. Governments of various countries are providing incentives and building the necessary infrastructure to support the adoption of these vehicles. As a result is the driving factor this market.
              • the adoption rate of EVs has been increasing steadily. The growing demand for EVs has increased the demand for charging outlets is the driving factor this market.
              • which would increase the need for electricity. The cost of charging EVs has been categorized based on the demand for electricity. There are different electric rate plans like flat-rate plans is the driving factor this market.
              • tiered flat-rate plans is the driving factor this market.
              • and critical peak pricing plans. During peak hours is the driving factor this market.
              • the cost of charging is high is the driving factor this market.
              • while it is less during off-peak hours. This is because service providers could devise comparatively cheaper methods of electricity generation. Vehicle to grid technology would reduce the cost of charging EVs during peak hours when the demand for electricity is high. On average is the driving factor this market.
              • EVs are idle for 95% of the time. If that idle time could be utilized by transferring the energy from vehicle to the grid during peak hours is the driving factor this market.
              • the availability of energy would be more. This would help in meeting the growing demand for electricity at a lesser cost. This is one of the important factors which will drive the global vehicle to grid chargers market during the forecast period. is the driving factor this market.

              The Vehicle To Grid Chargers market vendors should focus on grabbing business opportunities from the Residential chargers segment as it accounted for the largest market share in the base year.
              RIA - Research AI Assistant
              Ask RIA