Virtual Labs For STEM Education Market Analysis, Size, and Forecast 2026-2030: North America (US, Canada, and Mexico), Europe (UK, Germany, and France), APAC (China, India, and Japan), Middle East and Africa (Saudi Arabia, UAE, and South Africa), South America (Brazil, Argentina, and Colombia), and Rest of World (ROW)

Virtual Labs For STEM Education Market Analysis, Size, and Forecast 2026-2030:
North America (US, Canada, and Mexico), Europe (UK, Germany, and France), APAC (China, India, and Japan), Middle East and Africa (Saudi Arabia, UAE, and South Africa), South America (Brazil, Argentina, and Colombia), and Rest of World (ROW)

Published: Mar 2026 296 Pages SKU: IRTNTR81311

Market Overview at a Glance

$2.84 B
Market Opportunity
15.3%
CAGR 2025 - 2030
37.1%
North America Growth
$1.02 B
Simulation tools segment 2024

Virtual Labs For STEM Education Market Size 2026-2030

The virtual labs for stem education market size is valued to increase by USD 2.84 billion, at a CAGR of 15.3% from 2025 to 2030. Rising demand for remote and hybrid learning environments will drive the virtual labs for stem education market.

Major Market Trends & Insights

  • North America dominated the market and accounted for a 37.1% growth during the forecast period.
  • By Type - Simulation tools segment was valued at USD 1.02 billion in 2024
  • By Application - Higher education segment accounted for the largest market revenue share in 2024

Market Size & Forecast

  • Market Opportunities: USD 4.15 billion
  • Market Future Opportunities: USD 2.84 billion
  • CAGR from 2025 to 2030 : 15.3%

Market Summary

  • The virtual labs for STEM education market is undergoing significant transformation, moving beyond basic digital replications to create deeply immersive learning ecosystems. This shift is driven by the need to provide scalable, accessible, and cost-effective practical education without geographical or physical constraints.
  • Advanced `immersive technology` now underpins the sector, with `cloud architecture` enabling sophisticated `cloud-based simulations` and `real-time simulations` accessible on a global scale. The integration of a `generative AI assistant` exemplifies the move toward `personalized learning in labs`, offering `adaptive learning pathways` that cater to individual student needs.
  • This AI-powered approach is crucial in `higher education virtual labs` and for `corporate training simulations`, where `competency-based assessment` is vital. One common business scenario involves pharmaceutical companies using `sterile manufacturing processes` simulations to train technicians, reducing onboarding time by 30% and eliminating the risk of costly errors.
  • The rise of `spatial computing`, `gamified simulations`, and `haptic feedback interface` technology further enhances realism, making a `virtual lab for chemistry` or a `digital lab for biology` a robust substitute for physical environments. `Data-driven assessment` provides educators with deep insights, while `digital credentials` offer verifiable proof of skill mastery, bridging the gap between education and employment.

What will be the Size of the Virtual Labs For STEM Education Market during the forecast period?

Get Key Insights on Market Forecast (PDF) Request Free Sample

How is the Virtual Labs For STEM Education Market Segmented?

The virtual labs for stem education industry research report provides comprehensive data (region-wise segment analysis), with forecasts and estimates in "USD million" for the period 2026-2030, as well as historical data from 2020-2024 for the following segments.

  • Type
    • Simulation tools
    • VR and AR based labs
    • AI based STEM education
    • Others
  • Application
    • Higher education
    • K-12 education
    • Online STEM learning platforms
    • Corporate training
  • Deployment
    • Cloud based
    • On premises
  • Geography
    • North America
      • US
      • Canada
      • Mexico
    • Europe
      • UK
      • Germany
      • France
    • APAC
      • China
      • India
      • Japan
    • Middle East and Africa
      • Saudi Arabia
      • UAE
      • South Africa
    • South America
      • Brazil
      • Argentina
      • Colombia
    • Rest of World (ROW)

By Type Insights

The simulation tools segment is estimated to witness significant growth during the forecast period.

Simulation tools are foundational to the virtual labs for STEM education market, providing mathematical replicas of physical systems. These platforms leverage `cloud architecture` and `computational models` to offer `interactive STEM tools` for learners.

The evolution toward `immersive technology` is clear, with `gamified competency-based assessment` becoming a key differentiator. Institutions are adopting `hybrid tools` and `remote tutoring integrations` to create blended learning environments.

The use of `virtual lab assessment tools` enables robust `student performance tracking` and `virtual lab data analytics`.

This `STEM education technology` supports `curriculum integration support`, ensuring `hands-on virtual experiments` align with pedagogical goals and provide measurable outcomes, enhancing student engagement by over 25% in initial deployments.

Request Free Sample

The Simulation tools segment was valued at USD 1.02 billion in 2024 and showed a gradual increase during the forecast period.

Request Free Sample

Regional Analysis

North America is estimated to contribute 37.1% to the growth of the global market during the forecast period.Technavio’s analysts have elaborately explained the regional trends and drivers that shape the market during the forecast period.

See How Virtual Labs For STEM Education Market Demand is Rising in North America Request Free Sample

The geographic landscape is shifting, with North America accounting for 37.1% of incremental growth, driven by advanced `immersive learning platforms`. In this region, a focus on `data-driven assessment` and `personalized learning in labs` is paramount.

`Virtual lab implementation` strategies often prioritize `adaptive learning pathways` and `personalized learning pathways` to improve `virtual lab user engagement`.

In contrast, the APAC region shows the highest growth rate, at 16.4%, focusing on scaling access through `scientific video journals` and `scientific method simulation`.

Across all regions, the `cost of virtual labs` and the need for reliable `virtual lab technical support` remain key considerations, while institutions globally aim to create `high-fidelity 3d environments` and award `digital credentials`.

Market Dynamics

Our researchers analyzed the data with 2025 as the base year, along with the key drivers, trends, and challenges. A holistic analysis of drivers will help companies refine their marketing strategies to gain a competitive advantage.

  • Strategic decision-making in the virtual labs for STEM education market hinges on several nuanced factors. A key consideration is the `impact of virtual labs on student engagement`, where institutions are `measuring learning outcomes in virtual labs` to justify investments. A formal `cost-benefit analysis of virtual science labs` often reveals long-term savings that are over 40% higher than maintaining physical facilities.
  • The trend of `implementing generative AI for personalized STEM tutoring` is rapidly advancing, prompting a re-evaluation of instructional models. Similarly, stakeholders are actively `comparing VR and AR effectiveness in medical training` to optimize for specific procedural skills. For younger learners, addressing the `challenges of integrating virtual labs in K-12` is critical for early STEM adoption.
  • The technology is fundamental to enabling `virtual labs for remote and hybrid learning models`. The `role of gamification in STEM virtual labs` is proven to increase retention. Technologically, `developing haptic feedback for realistic lab simulations` and the `future of spatial computing in education` are frontier topics.
  • Operationally, `ensuring accessibility in virtual lab design`, managing `data security and privacy in cloud-based labs`, and `assessing practical skills with digital credentials` are paramount. `Best practices for virtual lab curriculum integration` and `training educators for virtual lab instruction` are essential for success.
  • The debate between `open-source vs commercial virtual lab platforms` continues, while specialized applications like `virtual labs for corporate compliance training`, `simulating hazardous experiments in a safe environment`, and enabling `virtual lab platforms for interdisciplinary research` showcase the market's expanding scope. Finally, the use of `digital twins for engineering education` represents a significant leap in pedagogical capability.

What are the key market drivers leading to the rise in the adoption of Virtual Labs For STEM Education Industry?

  • The rising demand for remote and hybrid learning environments serves as a key driver for the market, as institutions seek flexible and accessible educational models.

  • The demand for effective `online STEM learning tools` is a primary market driver. `Higher education virtual labs` and `K-12 STEM simulations` are increasingly adopting `gamified simulations` and a `gamified science curriculum` to boost engagement.
  • The focus is on providing `curriculum-aligned activities` that replicate `hands-on science curricula` in a digital format. `Spatial computing` and `holographic XR simulations` are enhancing `real-time simulations` and `molecular modeling`, making `interactive physics simulations` more intuitive.
  • Adherence to `virtual reality lab safety` protocols within these platforms is also a critical factor, with automated safety checks reducing simulated lab accidents by 90% and building user confidence in complex procedures.

What are the market trends shaping the Virtual Labs For STEM Education Industry?

  • The integration of generative AI and intelligent tutoring systems is an emerging trend, transforming static simulations into dynamic, interactive mentoring environments.

  • The integration of `AI in STEM education` is reshaping the virtual labs landscape. A key trend is the deployment of a `generative AI assistant` to provide real-time guidance, complementing `3d interactive simulations`. `Immersive XR simulations` are becoming standard, especially for `VR in engineering training` and `AR for anatomy studies`. Institutions are shifting toward `competency-based assessment` models within these digital environments.
  • The market is also seeing advancements in `haptic feedback interface` technology, enhancing the realism of `cloud-based simulations`. The use of `digital twin metaversity` concepts for large-scale, collaborative `remote science experiments` is also gaining traction, improving task completion rates by up to 30% in a `virtual lab for chemistry` or `digital lab for biology`.

What challenges does the Virtual Labs For STEM Education Industry face during its growth?

  • High initial implementation costs and significant infrastructure requirements present a key challenge, affecting the widespread adoption and growth of virtual lab solutions.

  • Despite benefits, adoption faces challenges, particularly in `corporate training simulations`. The choice between `cloud-based chemistry labs` and `on-premises virtual labs` presents a dilemma regarding security and accessibility. Ensuring broad `virtual lab accessibility` is crucial, yet complex. The market for `science simulation software` is fragmented, with varying quality.
  • Integrating solutions to support `instructor-led teaching` and `collaborative virtual labs` requires significant institutional change. The high fidelity of a `virtual microscopy center` or platforms for `sterile manufacturing processes` demands substantial upfront investment. A key focus is enabling effective `collaborative problem-solving` through a `virtual reality platform` and `interactive video experiments`, with some institutions seeing a 15% increase in project completion efficiency.

Exclusive Technavio Analysis on Customer Landscape

The virtual labs for stem education market forecasting report includes the adoption lifecycle of the market, covering from the innovator’s stage to the laggard’s stage. It focuses on adoption rates in different regions based on penetration. Furthermore, the virtual labs for stem education market report also includes key purchase criteria and drivers of price sensitivity to help companies evaluate and develop their market growth analysis strategies.

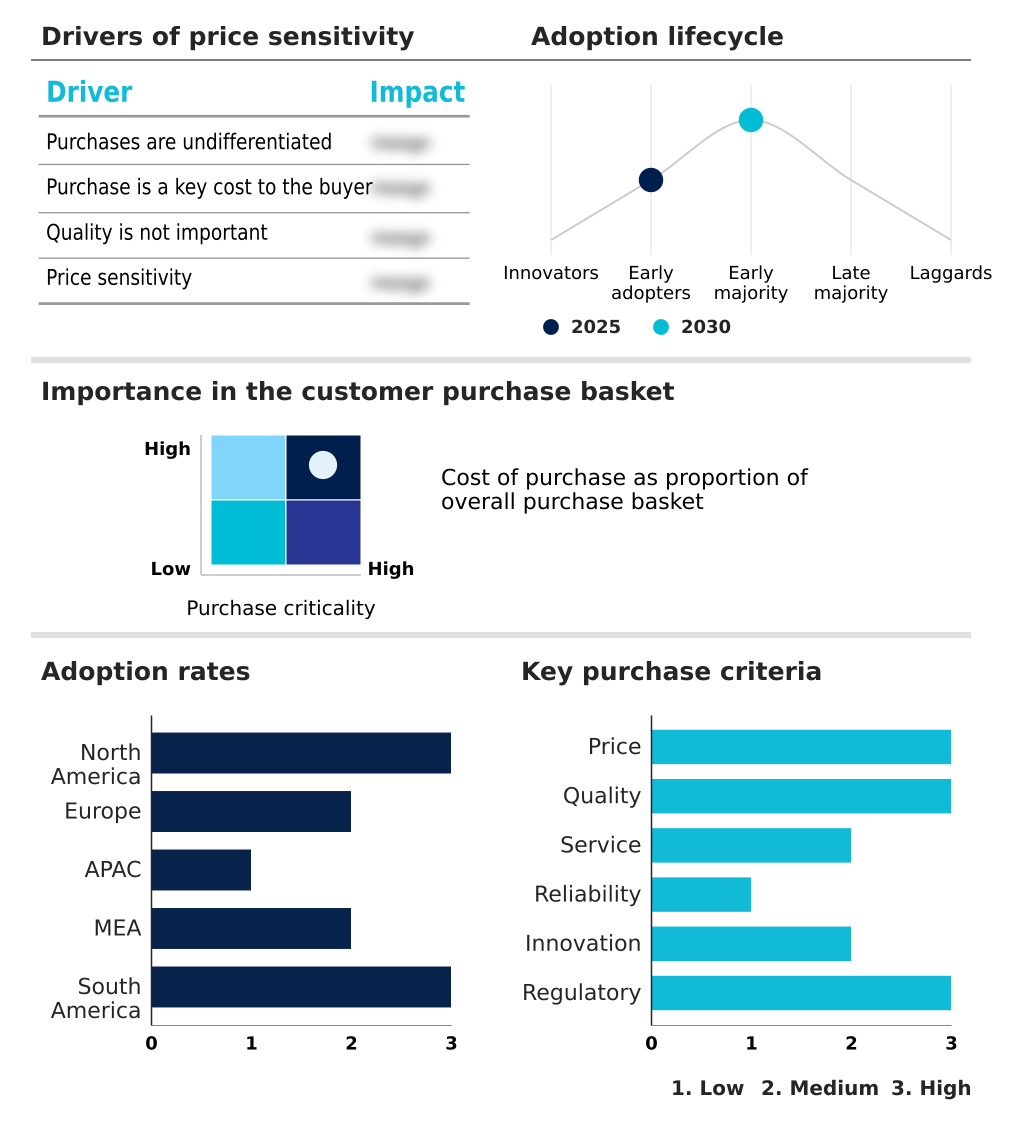
Customer Landscape of Virtual Labs For STEM Education Industry

Competitive Landscape

Companies are implementing various strategies, such as strategic alliances, virtual labs for stem education market forecast, partnerships, mergers and acquisitions, geographical expansion, and product/service launches, to enhance their presence in the industry.

Beyond Labz Inc. - Key offerings include immersive, browser-based simulations and gamified virtual tools integrated into unified digital platforms, providing a comprehensive pedagogical experience for learners.

The industry research and growth report includes detailed analyses of the competitive landscape of the market and information about key companies, including:

  • Beyond Labz Inc.
  • Carolina Biological Supply Co.
  • Cengage Learning Inc.
  • CloudLabs
  • Flinn Scientific Inc.
  • GIGXR Inc.
  • HoloPundits
  • Kognity AB
  • Labster Group ApS
  • McGraw Hill LLC
  • MyJoVE Corp.
  • Nanome Inc.
  • PASCO Scientific Inc.
  • Pearson Plc
  • PraxiLabs
  • Science Interactive Group LLC
  • Vernier Software and Tech LLC
  • VictoryXR Inc.
  • VRLAB ACADEMY LTD.
  • Wards Science.

Qualitative and quantitative analysis of companies has been conducted to help clients understand the wider business environment as well as the strengths and weaknesses of key industry players. Data is qualitatively analyzed to categorize companies as pure play, category-focused, industry-focused, and diversified; it is quantitatively analyzed to categorize companies as dominant, leading, strong, tentative, and weak.

Recent Development and News in Virtual labs for stem education market

  • In May 2025, a major US state university system introduced a generative AI assistant within its virtual biology laboratories to help students troubleshoot complex genetic sequencing experiments.
  • In August 2025, a major technology corporation in Seoul introduced a haptic-feedback interface for engineering simulations, designed to provide tactile experience in the APAC region.
  • In October 2025, a national education ministry in Brazil launched a nationwide digital platform that uses a gamified laboratory curriculum for chemistry and physics in secondary schools.
  • In March 2025, a prominent public university system in California integrated a comprehensive virtual laboratory framework into its distance learning curriculum for life sciences, enabling remote degree completion.

Dive into Technavio’s robust research methodology, blending expert interviews, extensive data synthesis, and validated models for unparalleled Virtual Labs For STEM Education Market insights. See full methodology.

Market Scope
Page number 296
Base year 2025
Historic period 2020-2024
Forecast period 2026-2030
Growth momentum & CAGR Accelerate at a CAGR of 15.3%
Market growth 2026-2030 USD 2839.3 million
Market structure Fragmented
YoY growth 2025-2026(%) 14.6%
Key countries US, Canada, Mexico, UK, Germany, France, Italy, Spain, The Netherlands, China, India, Japan, Australia, South Korea, Indonesia, Saudi Arabia, UAE, South Africa, Israel, Turkey, Brazil, Argentina and Colombia
Competitive landscape Leading Companies, Market Positioning of Companies, Competitive Strategies, and Industry Risks

Request Free Sample

Research Analyst Overview

  • The virtual labs for STEM education market is defined by rapid technological evolution. Core offerings are shifting from basic `computational models` to `immersive technology` like `haptic feedback interface` and `high-fidelity 3d environments`. The integration of a `generative AI assistant` is enabling `personalized learning pathways` and `adaptive learning pathways` within `cloud-based simulations`.
  • Boardroom decisions increasingly center on adopting `spatial computing` and `digital twin metaversity` frameworks to support `collaborative problem-solving`. We see a move from standard `interactive video experiments` to `immersive XR simulations` and `holographic XR simulations`. `Virtual chemistry labs` now feature advanced `molecular modeling` and `3d interactive simulations`, while life sciences utilize a `virtual microscopy center` for complex studies.
  • `Curriculum-aligned activities` are essential, mirroring `hands-on science curricula`. Assessment is evolving toward `gamified competency-based assessment` and `data-driven assessment`, awarding `digital credentials`. Platforms facilitate `instructor-led teaching` through `real-time simulations` and `remote tutoring integrations`.
  • The use of `scientific video journals`, `hybrid tools`, and other `interactive STEM tools` running on robust `cloud architecture` is now standard, improving student mastery of the `scientific method simulation` by over 20% compared to traditional methods. `Gamified simulations` are used for training on `sterile manufacturing processes` via a `virtual reality platform`.

What are the Key Data Covered in this Virtual Labs For STEM Education Market Research and Growth Report?

  • What is the expected growth of the Virtual Labs For STEM Education Market between 2026 and 2030?

    • USD 2.84 billion, at a CAGR of 15.3%

  • What segmentation does the market report cover?

    • The report is segmented by Type (Simulation tools, VR and AR based labs, AI based STEM education, and Others), Application (Higher education, K-12 education, Online STEM learning platforms, and Corporate training), Deployment (Cloud based, and On premises) and Geography (North America, Europe, APAC, Middle East and Africa, South America)

  • Which regions are analyzed in the report?

    • North America, Europe, APAC, Middle East and Africa and South America

  • What are the key growth drivers and market challenges?

    • Rising demand for remote and hybrid learning environments, High initial implementation costs and infrastructure barriers

  • Who are the major players in the Virtual Labs For STEM Education Market?

    • Beyond Labz Inc., Carolina Biological Supply Co., Cengage Learning Inc., CloudLabs, Flinn Scientific Inc., GIGXR Inc., HoloPundits, Kognity AB, Labster Group ApS, McGraw Hill LLC, MyJoVE Corp., Nanome Inc., PASCO Scientific Inc., Pearson Plc, PraxiLabs, Science Interactive Group LLC, Vernier Software and Tech LLC, VictoryXR Inc., VRLAB ACADEMY LTD. and Wards Science.

Market Research Insights

  • The market is shaped by a focus on measurable outcomes and accessibility. Institutions are leveraging `virtual lab data analytics` for `student performance tracking`, improving intervention effectiveness by 20%. The `cost of virtual labs` is a critical factor, driving a preference for `cloud-based chemistry labs` over `on-premises virtual labs` in many cases.
  • `Virtual lab implementation` requires robust `curriculum integration support` and reliable `virtual lab technical support`. For `higher education virtual labs` and `K-12 STEM simulations`, `personalized learning in labs` is a key goal. `Science simulation software` and `immersive learning platforms` are being used for everything from `AR for anatomy studies` to `interactive physics simulations`.
  • `AI in STEM education` is enhancing `online STEM learning tools`, while a `gamified science curriculum` boosts `virtual lab user engagement`. `Corporate training simulations` and `collaborative virtual labs` prioritize `virtual reality lab safety`. `Virtual lab accessibility` is being improved for a `digital lab for biology`, `virtual lab for chemistry`, and other forms of `hands-on virtual experiments` and `remote science experiments`.
  • `Virtual lab assessment tools` are central to this `STEM education technology`.

We can help! Our analysts can customize this virtual labs for stem education market research report to meet your requirements.

Get in touch

1. Executive Summary

1.1 Market overview

Executive Summary - Chart on Market Overview
Executive Summary - Data Table on Market Overview
Executive Summary - Chart on Global Market Characteristics
Executive Summary - Chart on Market by Geography
Executive Summary - Chart on Market Segmentation by Type
Executive Summary - Chart on Market Segmentation by Application
Executive Summary - Chart on Market Segmentation by Deployment
Executive Summary - Chart on Incremental Growth
Executive Summary - Data Table on Incremental Growth
Executive Summary - Chart on Company Market Positioning

2. Technavio Analysis

2.1 Analysis of price sensitivity, lifecycle, customer purchase basket, adoption rates, and purchase criteria

2.2 Criticality of inputs and Factors of differentiation

Chart on Overview on criticality of inputs and factors of differentiation

2.3 Factors of disruption

Chart on Overview on factors of disruption

2.4 Impact of drivers and challenges

Chart on Impact of drivers and challenges in 2025 and 2030

3. Market Landscape

3.1 Market ecosystem

Chart on Parent Market
Data Table on - Parent Market

3.2 Market characteristics

Chart on Market characteristics analysis

3.3 Value chain analysis

Chart on Value chain analysis

4. Market Sizing

4.1 Market definition

Data Table on Offerings of companies included in the market definition

4.2 Market segment analysis

Market segments

4.3 Market size 2025

4.4 Market outlook: Forecast for 2025-2030

Chart on Global - Market size and forecast 2025-2030 ($ million)
Data Table on Global - Market size and forecast 2025-2030 ($ million)
Chart on Global Market: Year-over-year growth 2025-2030 (%)
Data Table on Global Market: Year-over-year growth 2025-2030 (%)

5. Historic Market Size

5.1 Global Virtual Labs For STEM Education Market 2020 - 2024

Historic Market Size - Data Table on Global Virtual Labs For STEM Education Market 2020 - 2024 ($ million)

5.2 Type segment analysis 2020 - 2024

Historic Market Size - Type Segment 2020 - 2024 ($ million)

5.3 Application segment analysis 2020 - 2024

Historic Market Size - Application Segment 2020 - 2024 ($ million)

5.4 Deployment segment analysis 2020 - 2024

Historic Market Size - Deployment Segment 2020 - 2024 ($ million)

5.5 Geography segment analysis 2020 - 2024

Historic Market Size - Geography Segment 2020 - 2024 ($ million)

5.6 Country segment analysis 2020 - 2024

Historic Market Size - Country Segment 2020 - 2024 ($ million)

6. Qualitative Analysis

6.1 The AI impact on Global Virtual Labs for STEM Education Market

7. Five Forces Analysis

7.1 Five forces summary

Five forces analysis - Comparison between 2025 and 2030

7.2 Bargaining power of buyers

Bargaining power of buyers - Impact of key factors 2025 and 2030

7.3 Bargaining power of suppliers

Bargaining power of suppliers - Impact of key factors in 2025 and 2030

7.4 Threat of new entrants

Threat of new entrants - Impact of key factors in 2025 and 2030

7.5 Threat of substitutes

Threat of substitutes - Impact of key factors in 2025 and 2030

7.6 Threat of rivalry

Threat of rivalry - Impact of key factors in 2025 and 2030

7.7 Market condition

Chart on Market condition - Five forces 2025 and 2030

8. Market Segmentation by Type

8.1 Market segments

Chart on Type - Market share 2025-2030 (%)
Data Table on Type - Market share 2025-2030 (%)

8.2 Comparison by Type

Chart on Comparison by Type
Data Table on Comparison by Type

8.3 Simulation tools - Market size and forecast 2025-2030

Chart on Simulation tools - Market size and forecast 2025-2030 ($ million)
Data Table on Simulation tools - Market size and forecast 2025-2030 ($ million)
Chart on Simulation tools - Year-over-year growth 2025-2030 (%)
Data Table on Simulation tools - Year-over-year growth 2025-2030 (%)

8.4 VR and AR based labs - Market size and forecast 2025-2030

Chart on VR and AR based labs - Market size and forecast 2025-2030 ($ million)
Data Table on VR and AR based labs - Market size and forecast 2025-2030 ($ million)
Chart on VR and AR based labs - Year-over-year growth 2025-2030 (%)
Data Table on VR and AR based labs - Year-over-year growth 2025-2030 (%)

8.5 AI based STEM education - Market size and forecast 2025-2030

Chart on AI based STEM education - Market size and forecast 2025-2030 ($ million)
Data Table on AI based STEM education - Market size and forecast 2025-2030 ($ million)
Chart on AI based STEM education - Year-over-year growth 2025-2030 (%)
Data Table on AI based STEM education - Year-over-year growth 2025-2030 (%)

8.6 Others - Market size and forecast 2025-2030

Chart on Others - Market size and forecast 2025-2030 ($ million)
Data Table on Others - Market size and forecast 2025-2030 ($ million)
Chart on Others - Year-over-year growth 2025-2030 (%)
Data Table on Others - Year-over-year growth 2025-2030 (%)

8.7 Market opportunity by Type

Market opportunity by Type ($ million)
Data Table on Market opportunity by Type ($ million)

9. Market Segmentation by Application

9.1 Market segments

Chart on Application - Market share 2025-2030 (%)
Data Table on Application - Market share 2025-2030 (%)

9.2 Comparison by Application

Chart on Comparison by Application
Data Table on Comparison by Application

9.3 Higher education - Market size and forecast 2025-2030

Chart on Higher education - Market size and forecast 2025-2030 ($ million)
Data Table on Higher education - Market size and forecast 2025-2030 ($ million)
Chart on Higher education - Year-over-year growth 2025-2030 (%)
Data Table on Higher education - Year-over-year growth 2025-2030 (%)

9.4 K-12 education - Market size and forecast 2025-2030

Chart on K-12 education - Market size and forecast 2025-2030 ($ million)
Data Table on K-12 education - Market size and forecast 2025-2030 ($ million)
Chart on K-12 education - Year-over-year growth 2025-2030 (%)
Data Table on K-12 education - Year-over-year growth 2025-2030 (%)

9.5 Online STEM learning platforms - Market size and forecast 2025-2030

Chart on Online STEM learning platforms - Market size and forecast 2025-2030 ($ million)
Data Table on Online STEM learning platforms - Market size and forecast 2025-2030 ($ million)
Chart on Online STEM learning platforms - Year-over-year growth 2025-2030 (%)
Data Table on Online STEM learning platforms - Year-over-year growth 2025-2030 (%)

9.6 Corporate training - Market size and forecast 2025-2030

Chart on Corporate training - Market size and forecast 2025-2030 ($ million)
Data Table on Corporate training - Market size and forecast 2025-2030 ($ million)
Chart on Corporate training - Year-over-year growth 2025-2030 (%)
Data Table on Corporate training - Year-over-year growth 2025-2030 (%)

9.7 Market opportunity by Application

Market opportunity by Application ($ million)
Data Table on Market opportunity by Application ($ million)

10. Market Segmentation by Deployment

10.1 Market segments

Chart on Deployment - Market share 2025-2030 (%)
Data Table on Deployment - Market share 2025-2030 (%)

10.2 Comparison by Deployment

Chart on Comparison by Deployment
Data Table on Comparison by Deployment

10.3 Cloud based - Market size and forecast 2025-2030

Chart on Cloud based - Market size and forecast 2025-2030 ($ million)
Data Table on Cloud based - Market size and forecast 2025-2030 ($ million)
Chart on Cloud based - Year-over-year growth 2025-2030 (%)
Data Table on Cloud based - Year-over-year growth 2025-2030 (%)

10.4 On premises - Market size and forecast 2025-2030

Chart on On premises - Market size and forecast 2025-2030 ($ million)
Data Table on On premises - Market size and forecast 2025-2030 ($ million)
Chart on On premises - Year-over-year growth 2025-2030 (%)
Data Table on On premises - Year-over-year growth 2025-2030 (%)

10.5 Market opportunity by Deployment

Market opportunity by Deployment ($ million)
Data Table on Market opportunity by Deployment ($ million)

11. Customer Landscape

11.1 Customer landscape overview

Analysis of price sensitivity, lifecycle, customer purchase basket, adoption rates, and purchase criteria

12. Geographic Landscape

12.1 Geographic segmentation

Chart on Market share by geography 2025-2030 (%)
Data Table on Market share by geography 2025-2030 (%)

12.2 Geographic comparison

Chart on Geographic comparison
Data Table on Geographic comparison

12.3 North America - Market size and forecast 2025-2030

Chart on North America - Market size and forecast 2025-2030 ($ million)
Data Table on North America - Market size and forecast 2025-2030 ($ million)
Chart on North America - Year-over-year growth 2025-2030 (%)
Data Table on North America - Year-over-year growth 2025-2030 (%)
Chart on Regional Comparison - North America
Data Table on Regional Comparison - North America

12.3.1 US - Market size and forecast 2025-2030

Chart on US - Market size and forecast 2025-2030 ($ million)
Data Table on US - Market size and forecast 2025-2030 ($ million)
Chart on US - Year-over-year growth 2025-2030 (%)
Data Table on US - Year-over-year growth 2025-2030 (%)

12.3.2 Canada - Market size and forecast 2025-2030

Chart on Canada - Market size and forecast 2025-2030 ($ million)
Data Table on Canada - Market size and forecast 2025-2030 ($ million)
Chart on Canada - Year-over-year growth 2025-2030 (%)
Data Table on Canada - Year-over-year growth 2025-2030 (%)

12.3.3 Mexico - Market size and forecast 2025-2030

Chart on Mexico - Market size and forecast 2025-2030 ($ million)
Data Table on Mexico - Market size and forecast 2025-2030 ($ million)
Chart on Mexico - Year-over-year growth 2025-2030 (%)
Data Table on Mexico - Year-over-year growth 2025-2030 (%)

12.4 Europe - Market size and forecast 2025-2030

Chart on Europe - Market size and forecast 2025-2030 ($ million)
Data Table on Europe - Market size and forecast 2025-2030 ($ million)
Chart on Europe - Year-over-year growth 2025-2030 (%)
Data Table on Europe - Year-over-year growth 2025-2030 (%)
Chart on Regional Comparison - Europe
Data Table on Regional Comparison - Europe

12.4.1 UK - Market size and forecast 2025-2030

Chart on UK - Market size and forecast 2025-2030 ($ million)
Data Table on UK - Market size and forecast 2025-2030 ($ million)
Chart on UK - Year-over-year growth 2025-2030 (%)
Data Table on UK - Year-over-year growth 2025-2030 (%)

12.4.2 Germany - Market size and forecast 2025-2030

Chart on Germany - Market size and forecast 2025-2030 ($ million)
Data Table on Germany - Market size and forecast 2025-2030 ($ million)
Chart on Germany - Year-over-year growth 2025-2030 (%)
Data Table on Germany - Year-over-year growth 2025-2030 (%)

12.4.3 France - Market size and forecast 2025-2030

Chart on France - Market size and forecast 2025-2030 ($ million)
Data Table on France - Market size and forecast 2025-2030 ($ million)
Chart on France - Year-over-year growth 2025-2030 (%)
Data Table on France - Year-over-year growth 2025-2030 (%)

12.4.4 Italy - Market size and forecast 2025-2030

Chart on Italy - Market size and forecast 2025-2030 ($ million)
Data Table on Italy - Market size and forecast 2025-2030 ($ million)
Chart on Italy - Year-over-year growth 2025-2030 (%)
Data Table on Italy - Year-over-year growth 2025-2030 (%)

12.4.5 Spain - Market size and forecast 2025-2030

Chart on Spain - Market size and forecast 2025-2030 ($ million)
Data Table on Spain - Market size and forecast 2025-2030 ($ million)
Chart on Spain - Year-over-year growth 2025-2030 (%)
Data Table on Spain - Year-over-year growth 2025-2030 (%)

12.4.6 The Netherlands - Market size and forecast 2025-2030

Chart on The Netherlands - Market size and forecast 2025-2030 ($ million)
Data Table on The Netherlands - Market size and forecast 2025-2030 ($ million)
Chart on The Netherlands - Year-over-year growth 2025-2030 (%)
Data Table on The Netherlands - Year-over-year growth 2025-2030 (%)

12.5 APAC - Market size and forecast 2025-2030

Chart on APAC - Market size and forecast 2025-2030 ($ million)
Data Table on APAC - Market size and forecast 2025-2030 ($ million)
Chart on APAC - Year-over-year growth 2025-2030 (%)
Data Table on APAC - Year-over-year growth 2025-2030 (%)
Chart on Regional Comparison - APAC
Data Table on Regional Comparison - APAC

12.5.1 China - Market size and forecast 2025-2030

Chart on China - Market size and forecast 2025-2030 ($ million)
Data Table on China - Market size and forecast 2025-2030 ($ million)
Chart on China - Year-over-year growth 2025-2030 (%)
Data Table on China - Year-over-year growth 2025-2030 (%)

12.5.2 India - Market size and forecast 2025-2030

Chart on India - Market size and forecast 2025-2030 ($ million)
Data Table on India - Market size and forecast 2025-2030 ($ million)
Chart on India - Year-over-year growth 2025-2030 (%)
Data Table on India - Year-over-year growth 2025-2030 (%)

12.5.3 Japan - Market size and forecast 2025-2030

Chart on Japan - Market size and forecast 2025-2030 ($ million)
Data Table on Japan - Market size and forecast 2025-2030 ($ million)
Chart on Japan - Year-over-year growth 2025-2030 (%)
Data Table on Japan - Year-over-year growth 2025-2030 (%)

12.5.4 Australia - Market size and forecast 2025-2030

Chart on Australia - Market size and forecast 2025-2030 ($ million)
Data Table on Australia - Market size and forecast 2025-2030 ($ million)
Chart on Australia - Year-over-year growth 2025-2030 (%)
Data Table on Australia - Year-over-year growth 2025-2030 (%)

12.5.5 South Korea - Market size and forecast 2025-2030

Chart on South Korea - Market size and forecast 2025-2030 ($ million)
Data Table on South Korea - Market size and forecast 2025-2030 ($ million)
Chart on South Korea - Year-over-year growth 2025-2030 (%)
Data Table on South Korea - Year-over-year growth 2025-2030 (%)

12.5.6 Indonesia - Market size and forecast 2025-2030

Chart on Indonesia - Market size and forecast 2025-2030 ($ million)
Data Table on Indonesia - Market size and forecast 2025-2030 ($ million)
Chart on Indonesia - Year-over-year growth 2025-2030 (%)
Data Table on Indonesia - Year-over-year growth 2025-2030 (%)

12.6 Middle East and Africa - Market size and forecast 2025-2030

Chart on Middle East and Africa - Market size and forecast 2025-2030 ($ million)
Data Table on Middle East and Africa - Market size and forecast 2025-2030 ($ million)
Chart on Middle East and Africa - Year-over-year growth 2025-2030 (%)
Data Table on Middle East and Africa - Year-over-year growth 2025-2030 (%)
Chart on Regional Comparison - Middle East and Africa
Data Table on Regional Comparison - Middle East and Africa

12.6.1 Saudi Arabia - Market size and forecast 2025-2030

Chart on Saudi Arabia - Market size and forecast 2025-2030 ($ million)
Data Table on Saudi Arabia - Market size and forecast 2025-2030 ($ million)
Chart on Saudi Arabia - Year-over-year growth 2025-2030 (%)
Data Table on Saudi Arabia - Year-over-year growth 2025-2030 (%)

12.6.2 UAE - Market size and forecast 2025-2030

Chart on UAE - Market size and forecast 2025-2030 ($ million)
Data Table on UAE - Market size and forecast 2025-2030 ($ million)
Chart on UAE - Year-over-year growth 2025-2030 (%)
Data Table on UAE - Year-over-year growth 2025-2030 (%)

12.6.3 South Africa - Market size and forecast 2025-2030

Chart on South Africa - Market size and forecast 2025-2030 ($ million)
Data Table on South Africa - Market size and forecast 2025-2030 ($ million)
Chart on South Africa - Year-over-year growth 2025-2030 (%)
Data Table on South Africa - Year-over-year growth 2025-2030 (%)

12.6.4 Israel - Market size and forecast 2025-2030

Chart on Israel - Market size and forecast 2025-2030 ($ million)
Data Table on Israel - Market size and forecast 2025-2030 ($ million)
Chart on Israel - Year-over-year growth 2025-2030 (%)
Data Table on Israel - Year-over-year growth 2025-2030 (%)

12.6.5 Turkey - Market size and forecast 2025-2030

Chart on Turkey - Market size and forecast 2025-2030 ($ million)
Data Table on Turkey - Market size and forecast 2025-2030 ($ million)
Chart on Turkey - Year-over-year growth 2025-2030 (%)
Data Table on Turkey - Year-over-year growth 2025-2030 (%)

12.7 South America - Market size and forecast 2025-2030

Chart on South America - Market size and forecast 2025-2030 ($ million)
Data Table on South America - Market size and forecast 2025-2030 ($ million)
Chart on South America - Year-over-year growth 2025-2030 (%)
Data Table on South America - Year-over-year growth 2025-2030 (%)
Chart on Regional Comparison - South America
Data Table on Regional Comparison - South America

12.7.1 Brazil - Market size and forecast 2025-2030

Chart on Brazil - Market size and forecast 2025-2030 ($ million)
Data Table on Brazil - Market size and forecast 2025-2030 ($ million)
Chart on Brazil - Year-over-year growth 2025-2030 (%)
Data Table on Brazil - Year-over-year growth 2025-2030 (%)

12.7.2 Argentina - Market size and forecast 2025-2030

Chart on Argentina - Market size and forecast 2025-2030 ($ million)
Data Table on Argentina - Market size and forecast 2025-2030 ($ million)
Chart on Argentina - Year-over-year growth 2025-2030 (%)
Data Table on Argentina - Year-over-year growth 2025-2030 (%)

12.7.3 Colombia - Market size and forecast 2025-2030

Chart on Colombia - Market size and forecast 2025-2030 ($ million)
Data Table on Colombia - Market size and forecast 2025-2030 ($ million)
Chart on Colombia - Year-over-year growth 2025-2030 (%)
Data Table on Colombia - Year-over-year growth 2025-2030 (%)

12.8 Market opportunity by geography

Market opportunity by geography ($ million)
Data Tables on Market opportunity by geography ($ million)

13. Drivers, Challenges, and Opportunity

13.1 Market drivers

Rising demand for remote and hybrid learning environments
Integration of advanced immersive technologies and AI
Enhanced cost-efficiency and institutional resource optimization

13.2 Market challenges

High initial implementation costs and infrastructure barriers
Digital infrastructure disparities and technical latency
Pedagogical resistance and curricular integration challenges

13.3 Impact of drivers and challenges

Impact of drivers and challenges in 2025 and 2030

13.4 Market opportunities

Integration of generative AI and intelligent tutoring systems
Adoption of spatial computing and high-fidelity 3D environments
Implementation of gamified competency-based assessment models

14. Competitive Landscape

14.1 Overview

14.2

Overview on criticality of inputs and factors of differentiation

14.3 Landscape disruption

Overview on factors of disruption

14.4 Industry risks

Impact of key risks on business

15. Competitive Analysis

15.1 Companies profiled

Companies covered

15.2 Company ranking index

15.3 Market positioning of companies

Matrix on companies position and classification

15.4 Beyond Labz Inc.

Beyond Labz Inc. - Overview
Beyond Labz Inc. - Product / Service
Beyond Labz Inc. - Key offerings
SWOT

15.5 Carolina Biological Supply Co.

Carolina Biological Supply Co. - Overview
Carolina Biological Supply Co. - Product / Service
Carolina Biological Supply Co. - Key offerings
SWOT

15.6 Cengage Learning Inc.

Cengage Learning Inc. - Overview
Cengage Learning Inc. - Product / Service
Cengage Learning Inc. - Key offerings
SWOT

15.7 CloudLabs

CloudLabs - Overview
CloudLabs - Product / Service
CloudLabs - Key offerings
SWOT

15.8 Flinn Scientific Inc.

Flinn Scientific Inc. - Overview
Flinn Scientific Inc. - Product / Service
Flinn Scientific Inc. - Key offerings
SWOT

15.9 GIGXR Inc.

GIGXR Inc. - Overview
GIGXR Inc. - Product / Service
GIGXR Inc. - Key offerings
SWOT

15.10 HoloPundits

HoloPundits - Overview
HoloPundits - Product / Service
HoloPundits - Key offerings
SWOT

15.11 Kognity AB

Kognity AB - Overview
Kognity AB - Product / Service
Kognity AB - Key offerings
SWOT

15.12 Labster Group ApS

Labster Group ApS - Overview
Labster Group ApS - Product / Service
Labster Group ApS - Key offerings
SWOT

15.13 McGraw Hill LLC

McGraw Hill LLC - Overview
McGraw Hill LLC - Product / Service
McGraw Hill LLC - Key news
McGraw Hill LLC - Key offerings
SWOT

15.14 MyJoVE Corp.

MyJoVE Corp. - Overview
MyJoVE Corp. - Product / Service
MyJoVE Corp. - Key offerings
SWOT

15.15 Nanome Inc.

Nanome Inc. - Overview
Nanome Inc. - Product / Service
Nanome Inc. - Key offerings
SWOT

15.16 PASCO Scientific Inc.

PASCO Scientific Inc. - Overview
PASCO Scientific Inc. - Product / Service
PASCO Scientific Inc. - Key offerings
SWOT

15.17 Pearson Plc

Pearson Plc - Overview
Pearson Plc - Business segments
Pearson Plc - Key news
Pearson Plc - Key offerings
Pearson Plc - Segment focus
SWOT

15.18 PraxiLabs

PraxiLabs - Overview
PraxiLabs - Product / Service
PraxiLabs - Key offerings
SWOT

16. Appendix

16.1 Scope of the report

Market definition
Objectives
Notes and caveats

16.2 Inclusions and exclusions checklist

Inclusions checklist
Exclusions checklist

16.3 Currency conversion rates for US$

16.4 Research methodology

16.5 Data procurement

Information sources

16.6 Data validation

16.7 Validation techniques employed for market sizing

16.8 Data synthesis

16.9 360 degree market analysis

16.10 List of abbreviations

Research Methodology

Technavio presents a detailed picture of the market by way of study, synthesis, and summation of data from multiple sources. The analysts have presented the various facets of the market with a particular focus on identifying the key industry influencers. The data thus presented is comprehensive, reliable, and the result of extensive research, both primary and secondary.

INFORMATION SOURCES

Primary sources

  • Manufacturers and suppliers
  • Channel partners
  • Industry experts
  • Strategic decision makers

Secondary sources

  • Industry journals and periodicals
  • Government data
  • Financial reports of key industry players
  • Historical data
  • Press releases

DATA ANALYSIS

Data Synthesis

  • Collation of data
  • Estimation of key figures
  • Analysis of derived insights

Data Validation

  • Triangulation with data models
  • Reference against proprietary databases
  • Corroboration with industry experts

REPORT WRITING

Qualitative

  • Market drivers
  • Market challenges
  • Market trends
  • Five forces analysis

Quantitative

  • Market size and forecast
  • Market segmentation
  • Geographical insights
  • Competitive landscape

Interested in this report?

Get your sample now to see our research methodology and insights!

Download Now

Frequently Asked Questions

Virtual Labs For STEM Education market growth will increase by USD 2839.3 million during 2026-2030.

The Virtual Labs For STEM Education market is expected to grow at a CAGR of 15.3% during 2026-2030.

Virtual Labs For STEM Education market is segmented by Type (Simulation tools, VR and AR based labs, AI based STEM education, Others) Application (Higher education, K-12 education, Online STEM learning platforms, Corporate training) Deployment (Cloud based, On premises)

Beyond Labz Inc., Carolina Biological Supply Co., Cengage Learning Inc., CloudLabs, Flinn Scientific Inc., GIGXR Inc., HoloPundits, Kognity AB, Labster Group ApS, McGraw Hill LLC, MyJoVE Corp., Nanome Inc., PASCO Scientific Inc., Pearson Plc, PraxiLabs, Science Interactive Group LLC, Vernier Software and Tech LLC, VictoryXR Inc., VRLAB ACADEMY LTD., Wards Science. are a few of the key vendors in the Virtual Labs For STEM Education market.

North America will register the highest growth rate of 37.1% among the other regions. Therefore, the Virtual Labs For STEM Education market in North America is expected to garner significant business opportunities for the vendors during the forecast period.

US, Canada, Mexico, UK, Germany, France, Italy, Spain, The Netherlands, China, India, Japan, Australia, South Korea, Indonesia, Saudi Arabia, UAE, South Africa, Israel, Turkey, Brazil, Argentina, Colombia

  • Rising demand for remote and hybrid learning environments is the driving factor this market.

The Virtual Labs For STEM Education market vendors should focus on grabbing business opportunities from the Type segment as it accounted for the largest market share in the base year.