
Warehouse Slotting Optimization Software Market Size and Growth Forecast 2026-2030
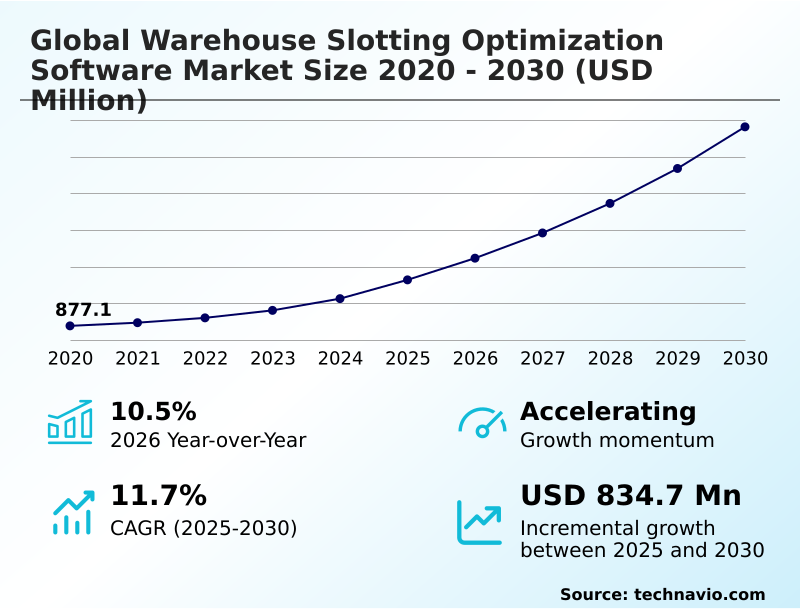
The Warehouse Slotting Optimization Software Market size was valued at USD 1.13 billion in 2025 growing at a CAGR of 11.7% during the forecast period 2026-2030.
North America accounts for 35.9% of incremental growth during the forecast period. The Cloud-based segment by Deployment was valued at USD 528.9 million in 2024, while the Retail and e-commerce segment holds the largest revenue share by End-user.
The market is projected to grow by USD 1.09 billion from 2020 to 2030, with USD 834.7 million of the growth expected during the forecast period of 2025 to 2030.
Get Key Insights on Market Forecast (PDF) Request Free Sample
Warehouse Slotting Optimization Software Market Overview
The warehouse slotting optimization software market is evolving beyond static, rule-based item placement toward dynamic, AI-driven strategies. With overall market growth accelerating at 10.5% year-over-year, decision-makers are compelled to adopt intelligent systems that enhance operational resilience. A key focus is leveraging dynamic slotting algorithms to manage the complexities of modern fulfillment. For instance, a high-volume e-commerce fulfillment center processing thousands of SKUs uses order fulfillment analytics and SKU velocity prediction to continuously adjust its layout. By implementing product affinity slotting, it places frequently co-purchased items closer together, a strategy that refines replenishment pathing and directly leads to labor travel reduction. This proactive approach, informed by pick path simulation, ensures the facility can meet demanding delivery timelines and manage seasonal peaks without expanding its physical footprint. This shift transforms inventory placement logic from a periodic task into a continuous, strategic process essential for competitive advantage.
Drivers, Trends, and Challenges in the Warehouse Slotting Optimization Software Market
Procurement decisions in the warehouse slotting optimization software market are increasingly nuanced, balancing upfront investment against long-term operational gains. For many, the choice between standalone vs integrated slotting software hinges on the existing IT infrastructure and the complexity of ERP integration.
The warehouse slotting software for SMEs often prioritizes cloud-based models to avoid significant capital expenditure, focusing on a clear AI slotting optimization ROI calculation based on labor savings and improved space utilization. A critical consideration involves establishing best practices for dynamic slotting implementation, a process that requires clean master data and a cultural shift away from manual methods.
For instance, a mid-sized third-party logistics provider, adhering to OSHA ergonomic guidelines for manual material handling, can use slotting software to ensure heavy, fast-moving items are placed in the golden zone, reducing picker strain and potential injuries.
This not only aids compliance but also improves pick rates, with facilities often reporting a significant reduction in picker travel time compared to those using static slotting methods, directly impacting operational profitability.
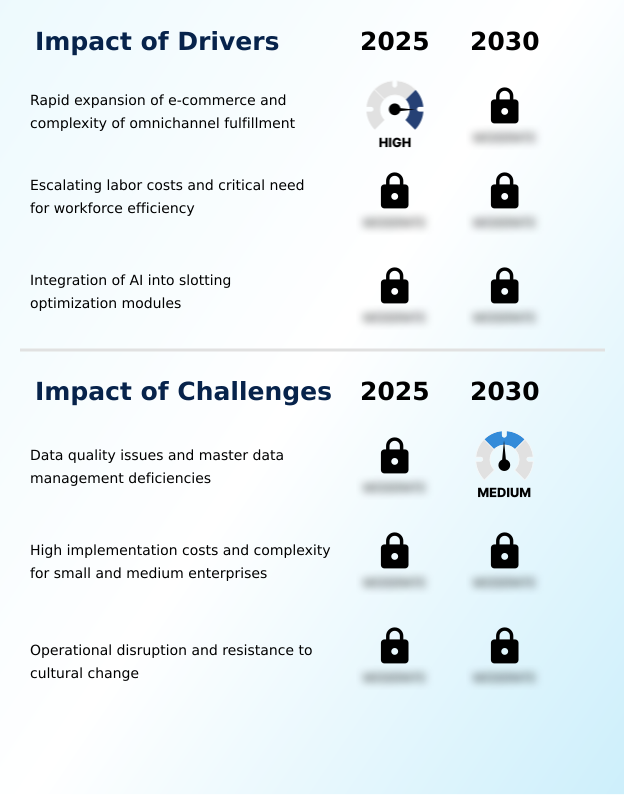
Primary Growth Driver: The rapid expansion of e-commerce and the increasing complexity of omnichannel fulfillment are primary drivers for the market.
The market's primary driver is the dual pressure of escalating e-commerce demand and rising labor costs.
The relentless growth of online retail, which stands as the largest end-user segment, requires sophisticated e-commerce fulfillment software capable of managing high-velocity, single-item picking operations.
To meet consumer expectations for rapid delivery, facilities must implement golden zone optimization and ergonomic slotting rules to maximize picker efficiency.
This directly addresses the challenge of labor travel reduction, which can account for over half of a warehouse's labor expenses.
As companies grapple with workforce shortages and wage inflation, solutions that promise significant gains in productivity and storage density maximization are no longer optional but essential for maintaining competitive service levels and operational profitability in a demanding fulfillment landscape.
Emerging Market Trend: The market is advancing with the integration of predictive analytics and machine learning. These capabilities enable dynamic, data-driven inventory placement strategies.
Key market trends are centered on the convergence of intelligent software and physical automation. The adoption of AI-driven slotting software, integrated with machine learning, enables predictive inventory management that goes beyond historical data analysis. This shift is critical for robotics-aware slotting, where the software must orchestrate movements for both human pickers and automated systems like AGVs and goods-to-person integration.
As a result, the warehouse digital twin is becoming a standard tool for simulating layout changes and optimizing workflows without disrupting operations. Concurrently, the move toward SaaS inventory optimization models continues to accelerate, with the cloud-based deployment segment accounting for the largest share of the market.
This model provides the scalability needed to handle fluctuating demand and facilitates the continuous delivery of new features.
Key Industry Challenge: Persistent data quality issues and deficiencies in master data management present a key challenge to effective software deployment and industry growth.
A significant challenge hindering ROI is poor inventory master data management. The effectiveness of any dynamic slotting algorithm depends on accurate cubing and dimensioning data for every SKU, which many organizations lack. This 'garbage in, garbage out' scenario leads to failed optimization and operational friction.
Furthermore, the perceived disruption of dynamic re-slotting is a major barrier; a survey by the Council of Supply Chain Management Professionals found that 45% of managers delay implementation due to fear of downtime. For SMEs, the high cost of integrating advanced WMS slotting modules with legacy systems presents a substantial financial hurdle.
Overcoming these challenges requires not only technology but also a commitment to data governance and strategic change management to realize the full benefits of optimization.
Explore Full Market Dynamics Analysis Request Free Sample
Warehouse Slotting Optimization Software Market Segmentation
The warehouse slotting optimization software industry research report provides comprehensive data including region-wise segment analysis, with forecasts and analysis for the period 2026-2030, as well as historical data from 2020-2024 for the following segments.
Deployment Segment Analysis
The cloud-based segment is estimated to witness significant growth during the forecast period.
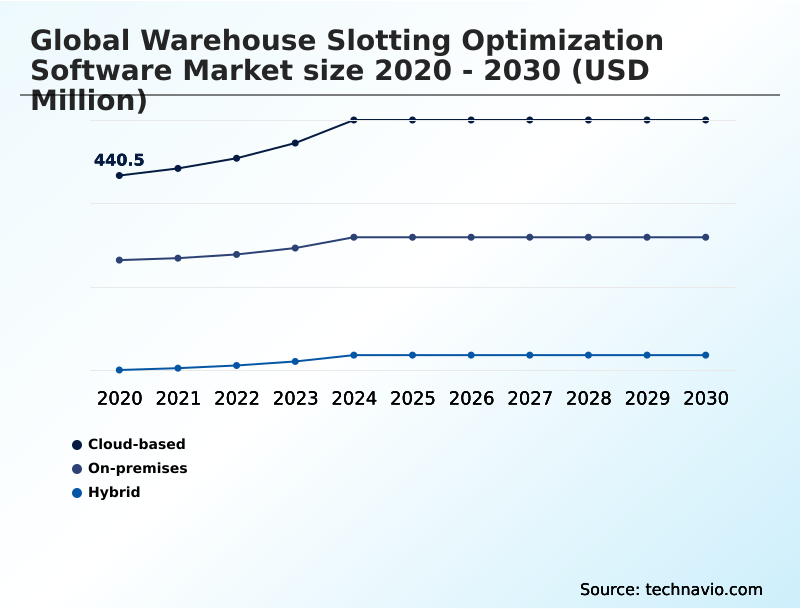
The adoption of cloud-based solutions is defining the warehouse slotting optimization software market, offering agility through a Software as a Service (SaaS) model.
This deployment shifts costs from capital to operational expenditure, which is advantageous for organizations managing fluctuating inventory volumes. Cloud architecture facilitates real-time data synchronization for multi-tenant warehousing, ensuring consistent inventory placement logic across a network.
It enables faster processing for tasks like pick path simulation and supports advanced AI-driven slotting software. Unlike on-premises systems, cloud deployment provides immediate access to the latest security and feature updates, including tools for goods-to-person integration.
The cloud-based segment is substantially larger than the on-premises segment, reflecting its role in enabling scalable and resilient supply chain operations without major upfront hardware investment.
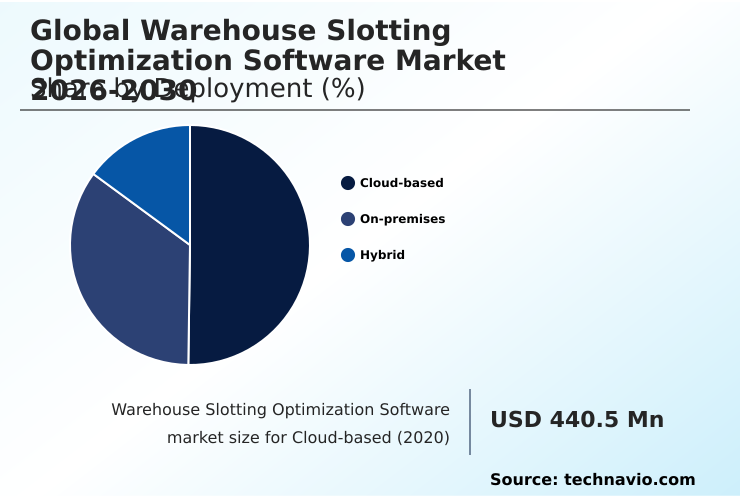
The Cloud-based segment was valued at USD 528.9 million in 2024 and showed a gradual increase during the forecast period.
Warehouse Slotting Optimization Software Market by Region: North America Leads with 35.9% Growth Share
North America is estimated to contribute 35.9% to the growth of the global market during the forecast period.

The geographic landscape of the warehouse slotting optimization software market is led by North America, which accounts for over 35% of the incremental growth, driven by high labor costs and the need for retail distribution center efficiency.
The region's mature logistics sector prioritizes warehouse throughput analysis and advanced AS/RS optimization. Meanwhile, APAC is the fastest-growing region, with a projected CAGR of 12.6%, fueled by the boom in e-commerce fulfillment software adoption in China and India.
In Europe, the focus is on storage density maximization and sustainability, with German automotive parts warehousing operations implementing precise inventory management.
Across regions, specialized needs like pharmaceutical warehouse compliance and cold chain slotting solutions are driving adoption, with solutions increasingly tailored to handle complex serialization lot tracking and FEFO logic.
Customer Landscape Analysis for the Warehouse Slotting Optimization Software Market
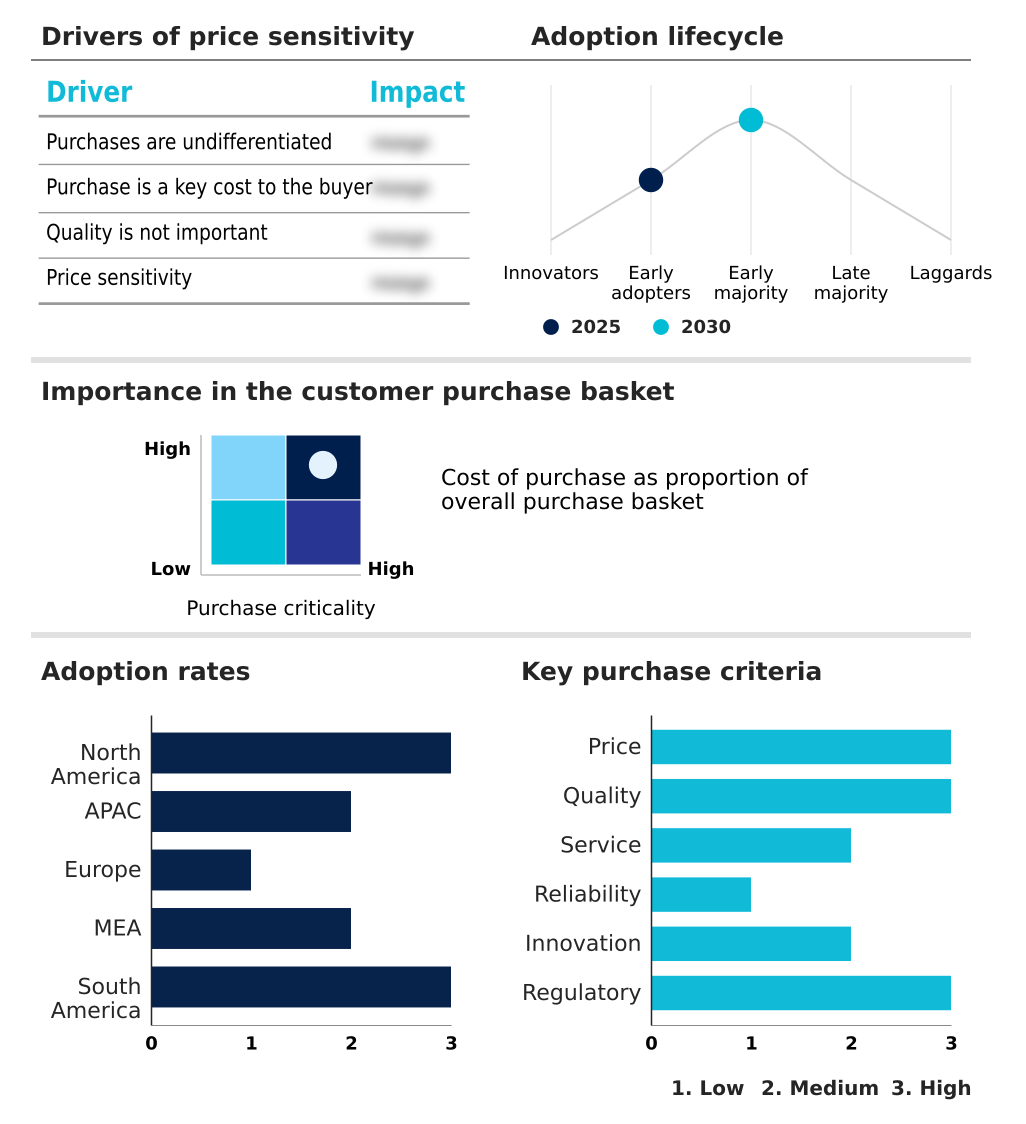
The warehouse slotting optimization software market forecasting report includes the adoption lifecycle of the market, covering from the innovator’s stage to the laggard’s stage. It focuses on adoption rates in different regions based on penetration. Furthermore, the warehouse slotting optimization software market report also includes key purchase criteria and drivers of price sensitivity to help companies evaluate and develop their market growth analysis strategies.
Competitive Landscape of the Warehouse Slotting Optimization Software Market
Companies are implementing various strategies, such as strategic alliances, partnerships, mergers and acquisitions, geographical expansion, and product/service launches, to enhance their presence in the warehouse slotting optimization software market industry.
Blue Yonder Group Inc. - Offerings center on advanced algorithms for strategic inventory placement, leveraging data analytics to enhance warehouse efficiency, reduce labor costs, and maximize space utilization.
The industry research and growth report includes detailed analyses of the competitive landscape of the market and information about key companies, including:
- Blue Yonder Group Inc.
- Dassault Systemes SE
- Descartes Systems Group Inc.
- Ehrhardt + Partner GmbH and Co. KG
- FORTNA Inc.
- Generix Group
- Honeywell International Inc.
- Infor Inc.
- Korber AG.
- Logility SCS Inc.
- Logiwa Inc.
- Lucas Systems
- Made4net
- Manhattan Associates Inc.
- Mecalux Group
- Oracle Corp.
- PSI Software AG
- SAP SE
- Softeon
- Tecsys Inc.
Qualitative and quantitative analysis of companies has been conducted to help clients understand the wider business environment as well as the strengths and weaknesses of key industry players. Data is qualitatively analyzed to categorize companies as pure play, category-focused, industry-focused, and diversified; it is quantitatively analyzed to categorize companies as dominant, leading, strong, tentative, and weak.
Recent Developments in the Warehouse Slotting Optimization Software Market
- In May 2025, Blue Yonder launched a dedicated AI-driven slotting solution that leverages historical shipping data and promotional calendars to proactively suggest optimal stock placements, aiming to reduce aisle congestion and improve ergonomics.
- In April 2025, DHL Supply Chain deployed a new generative AI slotting module across its European e-commerce network, reportedly increasing picking efficiency by 20% during peak promotional periods by optimizing inventory layouts.
- In March 2025, Descartes Systems Group introduced an enhanced slotting capability engineered for seamless integration with automated storage and retrieval systems (AS/RS), enabling real-time inventory reorganization based on incoming order profiles.
- In February 2025, Blue Yonder announced a new cognitive slotting capability for its supply chain suite, utilizing generative AI to automate the simulation and execution of re-slotting tasks during non-peak hours for retail clients.
Research Analyst Overview: Warehouse Slotting Optimization Software Market
The operational calculus for adopting warehouse slotting optimization software has shifted, with boardroom decisions now weighing the total cost of ownership of cloud-native platforms against the control of on-premise systems. A key catalyst is the integration of AI, which transforms inventory placement logic from a reactive task to a predictive strategy.
Advanced systems now utilize SKU velocity prediction and order fulfillment analytics to automate putaway process automation and enable effective chaotic storage management. North America continues to command the largest market share, driven by the pressures of e-commerce and the need for labor travel reduction.
Within these facilities, adherence to occupational health and safety standards like ISO 45001 is influencing the adoption of ergonomic slotting rules. The focus is on creating a warehouse digital twin for continuous pick path simulation, allowing operators to maximize storage density maximization while ensuring compliance and worker safety, a dual benefit that strengthens the business case for investment.
Dive into Technavio’s robust research methodology, blending expert interviews, extensive data synthesis, and validated models for unparalleled Warehouse Slotting Optimization Software Market insights. See full methodology.
| Market Scope | |
|---|---|
| Page number | 307 |
| Base year | 2025 |
| Historic period | 2020-2024 |
| Forecast period | 2026-2030 |
| Growth momentum & CAGR | Accelerate at a CAGR of 11.7% |
| Market growth 2026-2030 | USD 834.7 million |
| Market structure | Fragmented |
| YoY growth 2025-2026(%) | 10.5% |
| Key countries | US, Canada, Mexico, China, India, Japan, South Korea, Australia, Indonesia, Germany, UK, France, Italy, The Netherlands, Spain, UAE, Saudi Arabia, South Africa, Turkey, Israel, Brazil, Argentina and Colombia |
| Competitive landscape | Leading Companies, Market Positioning of Companies, Competitive Strategies, and Industry Risks |
Warehouse Slotting Optimization Software Market: Key Questions Answered in This Report
-
What is the expected growth of the Warehouse Slotting Optimization Software Market between 2026 and 2030?
-
The Warehouse Slotting Optimization Software Market is expected to grow by USD 834.7 million during 2026-2030, registering a CAGR of 11.7%. Year-over-year growth in 2026 is estimated at 10.5%%. This acceleration is shaped by rapid expansion of e-commerce and complexity of omnichannel fulfillment, which is intensifying demand across multiple end-use verticals covered in the report.
-
-
What segmentation does the market report cover?
-
The report is segmented by Deployment (Cloud-based, On-premises, and Hybrid), End-user (Retail and e-commerce, Food and beverage, Industrial, Pharmaceuticals and healthcare, and Automotive), Application (E-commerce fulfillment centers, Third-party logistics warehouses, Retail distribution centers, and Manufacturing warehouses) and Geography (North America, APAC, Europe, Middle East and Africa, South America). Among these, the Cloud-based segment is estimated to witness significant growth during the forecast period, driven by rising adoption across key application areas. Each segment includes detailed qualitative and quantitative analysis, along with historical data from 2020-2024 and forecasts through 2030 with year-over-year growth rates.
-
-
Which regions are analyzed in the report?
-
The report covers North America, APAC, Europe, Middle East and Africa and South America. North America is estimated to contribute 35.9% to market growth during the forecast period. Country-level analysis includes US, Canada, Mexico, China, India, Japan, South Korea, Australia, Indonesia, Germany, UK, France, Italy, The Netherlands, Spain, UAE, Saudi Arabia, South Africa, Turkey, Israel, Brazil, Argentina and Colombia, with dedicated market size tables and year-over-year growth for each.
-
-
What are the key growth drivers and market challenges?
-
The primary driver is rapid expansion of e-commerce and complexity of omnichannel fulfillment, which is accelerating investment and industry demand. The main challenge is data quality issues and master data management deficiencies, creating operational barriers for key market participants. The report quantifies the impact of each driver and challenge across 2026 and 2030 with comparative analysis.
-
-
Who are the major players in the Warehouse Slotting Optimization Software Market?
-
Key vendors include Blue Yonder Group Inc., Dassault Systemes SE, Descartes Systems Group Inc., Ehrhardt + Partner GmbH and Co. KG, FORTNA Inc., Generix Group, Honeywell International Inc., Infor Inc., Korber AG., Logility SCS Inc., Logiwa Inc., Lucas Systems, Made4net, Manhattan Associates Inc., Mecalux Group, Oracle Corp., PSI Software AG, SAP SE, Softeon and Tecsys Inc.. The report provides qualitative and quantitative analysis categorizing companies as dominant, leading, strong, tentative, and weak based on their market positioning. Company profiles include business segment analysis, SWOT assessment, key offerings, and recent strategic developments.
-
Warehouse Slotting Optimization Software Market Research Insights
Market dynamics are shaped by the push for operational efficiency under strict compliance frameworks, such as OSHA standards for material handling ergonomics. The adoption of AI-driven slotting software is critical for optimizing warehouse throughput analysis and implementing effective ergonomic picking solutions.
As companies shift from capital-intensive on-premise systems, the market for SaaS inventory optimization is expanding, with the cloud-based segment now significantly larger than its on-premise counterpart. This transition is supported by the need for scalable warehouse layout simulation and robust labor management system integration.
Decision-makers are prioritizing investments in technologies that provide a clear path to improving inventory cube utilization and supporting cycle counting automation, directly impacting profitability and service levels in an increasingly competitive logistics environment.
We can help! Our analysts can customize this warehouse slotting optimization software market research report to meet your requirements.
 RIA -
RIA - 
