Wash Basin Market Size 2025-2029
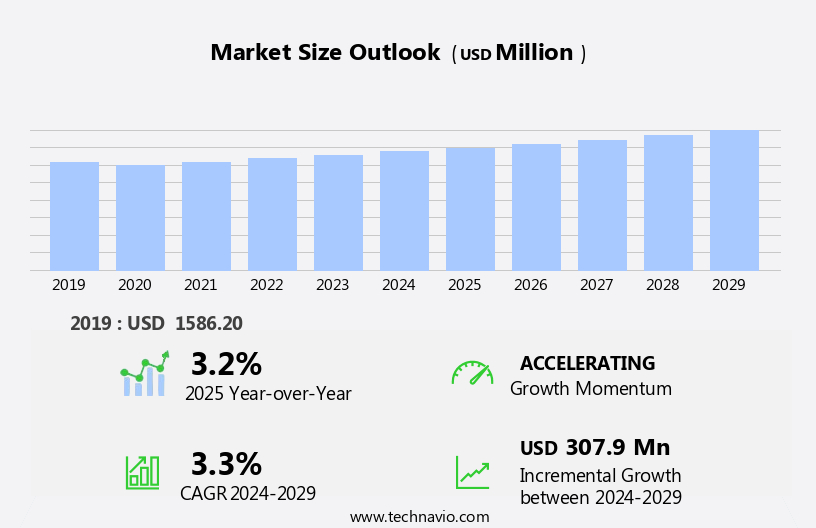
The wash basin market size is forecast to increase by USD 307.9 million, at a CAGR of 3.3% between 2024 and 2029.
- The market is experiencing significant growth, driven by the increasing trend towards building refurbishment activities. This renewed focus on renovating existing structures presents a substantial opportunity for market participants, as wash basins are often among the fixtures that undergo replacement during refurbishment projects. Another key driver is the integration of technology into wash basins, with smart and sensor-enabled models gaining popularity among consumers. Moreover, renovation projects in hotels and resorts aimed at improving the guest experience have increased the demand for modern and visually appealing bathroom sinks. However, the market also faces challenges, most notably the stringent emission standards pertaining to ceramic sanitary ware production.
- These regulations, aimed at reducing environmental impact, necessitate substantial investments in production processes and technology. Companies must navigate these challenges to remain competitive and capitalize on the market's potential for growth. Effective strategic planning and operational efficiency will be crucial for businesses seeking to succeed in this dynamic market. The market dominates due to a strong focus on personal hygiene and health.
What will be the Size of the Wash Basin Market during the forecast period?

Explore in-depth regional segment analysis with market size data - historical 2019-2023 and forecasts 2025-2029 - in the full report.
Request Free Sample
The market continues to evolve, with dynamic market trends shaping its growth across various sectors. Composite sinks, with their durability and resistance to thermal shock and water, are gaining popularity in both residential and commercial applications. Quality control measures ensure the production of sinks with superior water resistance, while water supply lines and installation kits facilitate seamless integration into bathroom and kitchen designs. Cast iron sinks, known for their classic appeal and longevity, are finding new life with the addition of surface protection, such as anti-scratch coatings and anti-bacterial finishes. Fireclay sinks and porcelain sinks, with their timeless elegance, are making a comeback in healthcare facilities and commercial washrooms.
Wall-hung basins and undermount sinks are transforming bathroom design with their sleek, modern look. Water saving technology, such as low-flow faucets and water efficient drain assemblies, is becoming a priority in kitchen and bathroom design. Manufacturing processes continue to evolve, with advancements in water resistance, scratch resistance, and thermal shock resistance. Plumbing fixtures, from smart faucets to pop-up drains, are being engineered for optimal water pressure and water conservation. The market's continuous unfolding is also reflected in the emergence of innovative products, such as sink cleaners and installation kits, designed to enhance the user experience. From cast iron to composite, porcelain to glass, the market offers a diverse range of options to meet the evolving needs of consumers and businesses alike.
How is this Wash Basin Industry segmented?
The wash basin industry research report provides comprehensive data (region-wise segment analysis), with forecasts and estimates in "USD million" for the period 2025-2029, as well as historical data from 2019-2023 for the following segments.
- Distribution Channel
- End-user
- Type
- Undercounter
- Vessel
- Wall-Hung Basins
- Pedestal Basins
- Semi-Recessed Basins
- Integrated Basins
- Material
- Ceramic
- Porcelain
- Stone (Marble, Granite)
- Glass
- Metal
- Solid Surface
- Design
- Modern
- Traditional
- Contemporary
- Artistic
- Geography
- North America
- Europe
- Middle East and Africa
- APAC
- South America
- Rest of World (ROW)
By Distribution Channel Insights
The offline segment is estimated to witness significant growth during the forecast period.
The market trends encompass various aspects, including scratch resistance, mounting hardware, and bathroom design. Scratch-resistant coatings and surface protections ensure the longevity of sinks, while mounting hardware facilitates easy installation. Smart faucets and water saving technology cater to modern bathroom design preferences. The supply chain involves various stakeholders, from raw material suppliers to manufacturers and retailers. Thermal shock resistance is crucial for materials like copper and porcelain, preventing damage from sudden temperature changes. Anti-bacterial finishes and stain resistance are essential features for healthcare facilities and commercial washrooms. Manufacturing processes vary, from casting and molding to composite and acrylic production.
Plumbing fixtures, such as water supply lines and drain assemblies, are integral components of wash basins. Water pressure and water efficiency are essential considerations for both residential and commercial applications. Waste pipes and pop-up drains facilitate proper water disposal. Countertop sinks, vessel sinks, and wall-hung basins cater to diverse kitchen and bathroom design requirements. Fireclay sinks, cast iron sinks, and ceramic sinks offer unique aesthetics and durability. Porcelain sinks and glass sinks provide sleek, modern alternatives. Quality control measures ensure water resistance and leak-proof installations. Plumber's putty and silicone sealant are essential for secure installation.
Integrated sinks and water conservation technologies are gaining popularity in modern design trends. In the offline distribution landscape, retail formats, such as specialty stores, hypermarkets, department stores, and warehouse clubs, dominate sales. The Internet's influence on marketing strategies has led to the term 'offline' being used for any media channel not connected to the World Wide Web. Marketers employ offline media strategies to create product awareness, utilizing channels like print, radio, and television.

Request Free Sample
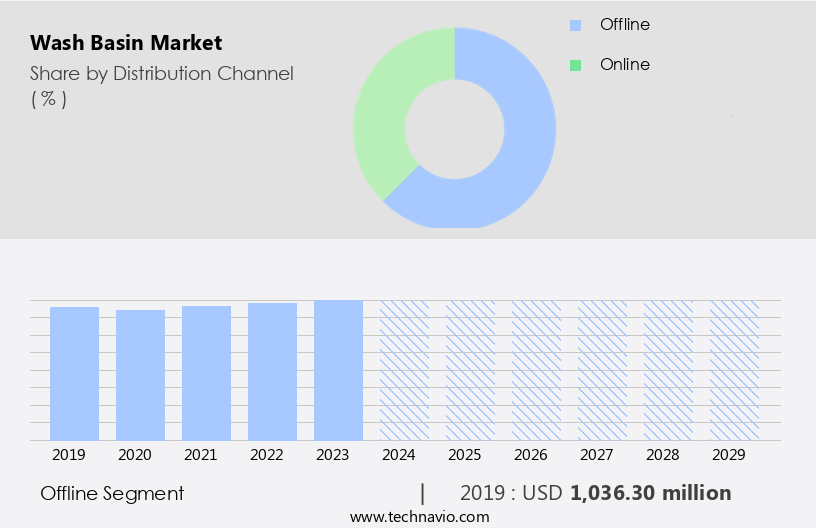
The Offline segment was valued at USD 1036.30 million in 2019 and showed a gradual increase during the forecast period.
Regional Analysis
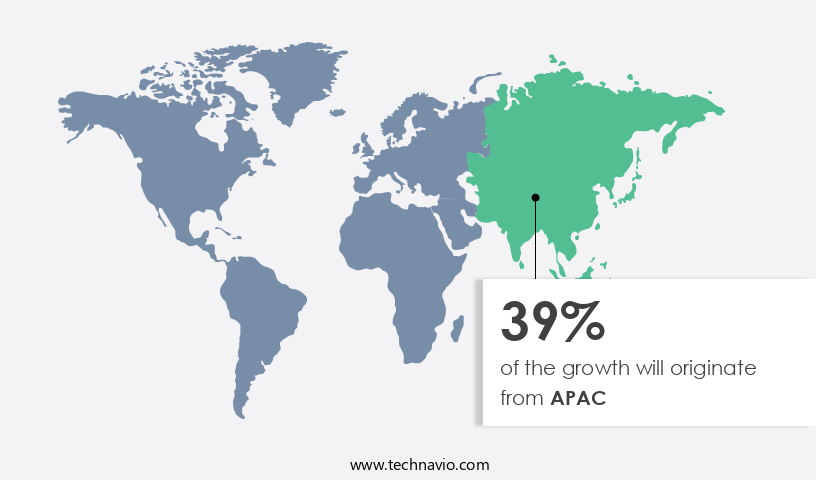
APAC is estimated to contribute 39% to the growth of the global market during the forecast period.Technavio’s analysts have elaborately explained the regional trends and drivers that shape the market during the forecast period.

Request Free Sample
The market in APAC is witnessing significant growth, driven primarily by the expanding construction sector in emerging economies. With a growing population and increasing investments in infrastructure, there is a surging demand for new residential and commercial spaces. Smart cities, a key objective of many countries in the region, prioritize sustainable and eco-friendly infrastructure. In Indonesia, for instance, the thriving residential sector, coupled with continuous policy reforms to attract private investments, is fueling the sales of wash basins. Smart faucets, with their water-saving technology and anti-bacterial finish, are gaining popularity in both residential and commercial washrooms.
Copper sinks, known for their thermal shock resistance and scratch resistance, are another trending choice for bathroom designs. The manufacturing process for wash basins is increasingly focusing on quality control and water resistance to cater to the evolving consumer preferences. Mounting hardware, such as plumber's putty and silicone sealant, play a crucial role in the installation process. Porcelain and fireclay sinks, along with their counterparts like acrylic, composite, and stone sinks, are common choices for bathrooms and kitchen designs. Wall-hung basins and undermount sinks are popular choices for modern bathrooms. The supply chain for wash basins involves various components like water supply lines, water pressure, and drain assemblies.
Waste pipes and pop-up drains are essential parts of the system, ensuring proper water flow and disposal. The integration of water efficiency and water conservation technologies is a growing trend in the market. In healthcare facilities, ceramic sinks with anti-bacterial properties and overflow drains are preferred for their durability and ease of maintenance. Commercial washrooms often opt for integrated sinks and vessel sinks to provide a more spacious and aesthetically pleasing design. The market for wash basins is diverse, encompassing various materials, designs, and technologies. The focus on sustainability, functionality, and aesthetics is driving the innovation and growth in this sector.
Market Dynamics
The Global Wash Basin Market is experiencing significant expansion, driven by increasing focus on hygiene and sanitation and modern design aesthetics. Wash basin options range from classic ceramic wash basins to contemporary wall-mounted wash basins and popular countertop wash basins. The integration of smart wash basins featuring water-saving technology and touchless technology is a key trend. Demand is robust across both residential bathrooms and commercial bathrooms, particularly within home renovation and new new construction projects. The Asia Pacific Wash Basin Market leads in growth, with numerous wash basin manufacturers in the sanitary ware industry innovating to meet diverse needs, including luxury wash basins and eco-friendly wash basins. The online distribution channel is also driving sales, all contributing to evolving global wash basin market trends.
Our researchers analyzed the data with 2024 as the base year, along with the key drivers, trends, and challenges. A holistic analysis of drivers will help companies refine their marketing strategies to gain a competitive advantage.
What are the key market drivers leading to the rise in the adoption of Wash Basin Industry?
- The significant rise in building refurbishment activities serves as the primary market driver.
- The market is experiencing growth due to the rising trend of building refurbishment projects. With urbanization and population growth, there is a heightened need to renovate existing structures, both residential and commercial. These renovation projects often include upgrading bathrooms and washroom facilities, leading to an increased demand for contemporary and visually appealing wash basins. In the hospitality industry, renovations focused on enhancing the guest experience have boosted the demand for modern wash basins. Similarly, commercial office spaces are being transformed to create more modern and employee-friendly environments, with a strong focus on upgrading lavatory facilities, frequently incorporating stylish wash basins.
- The manufacturing process of wash basins involves various materials such as acrylic sinks and vessel sinks, as well as water-saving technology and plumbing fixtures like pop-up drains and water pressure systems. Installation requires the use of plumber's putty or silicone sealant to ensure a watertight seal. Overall, the market is driven by the desire for modernization and the need to meet the increasing demand for aesthetically pleasing and functional washroom facilities.
What are the market trends shaping the Wash Basin Industry?
- The integration of technology into wash basins is a current market trend, with advanced features such as touchless faucets, temperature control, and water conservation systems becoming increasingly popular. These innovations enhance the user experience and contribute to water savings and improved hygiene.
- The market is witnessing significant advancements as technology integration becomes a prominent trend. Enhancing user experience, efficiency, and functionality, modern wash basin designs incorporate touchless or sensor-activated faucets. These innovations promote hygiene and reduce the risk of germ spread. Companies are incorporating motion sensors to enable hands-free operation, adding convenience in both residential and commercial settings. Kohler Co., a leading plumbing products manufacturer, is one example, introducing touchless faucets that respond to hand movements, ensuring a smooth and sanitary handwashing experience.
- Quality control is crucial in the production of composite sinks, cast iron sinks, fireclay sinks, sink cleaners, installation kits, porcelain sinks, wall-hung basins, waste pipes, undermount sinks, and water supply lines. Water resistance is another essential factor, ensuring the durability and longevity of these products. Companies prioritize these factors to meet the evolving preferences of consumers and maintain a competitive edge in the market.
What challenges does the Wash Basin Industry face during its growth?
- The stringent emission standards imposed on the production of ceramic sanitary ware pose a significant challenge to the industry's growth. Adhering to these regulations adds complexity and cost to the manufacturing process, potentially hindering the industry's ability to expand and compete in the global market.
- Ceramic sinks, such as those used in healthcare facilities, are a common choice for commercial washrooms due to their durability and resistance to wear and tear. These sinks are primarily made of clay and other inorganic materials, including kaolinite, quartz, and feldspar. The production process involves the use of large amounts of energy and water, leading to significant environmental impact. Stainless steel and stone sinks are also popular options in commercial settings. Stainless steel sinks offer ease of maintenance and resistance to corrosion, making them suitable for high-traffic areas. Stone sinks, on the other hand, provide a natural and elegant look, often preferred in upscale facilities.
- Drain assemblies are an essential component of all sink types. They ensure proper water flow and prevent backups. Water efficiency is a crucial consideration in commercial washrooms, and drain assemblies with low flow rates and water conservation features are increasingly popular. Integrated sinks, which combine the sink basin and countertop into one unit, offer a sleek and modern design. Glass sinks, while not as common in commercial washrooms, provide a unique and visually appealing alternative. Regardless of the sink material, it's essential to prioritize water efficiency and conservation in the design and operation of commercial washrooms.
- This not only helps reduce water usage and save costs but also contributes to environmental sustainability.
Exclusive Customer Landscape
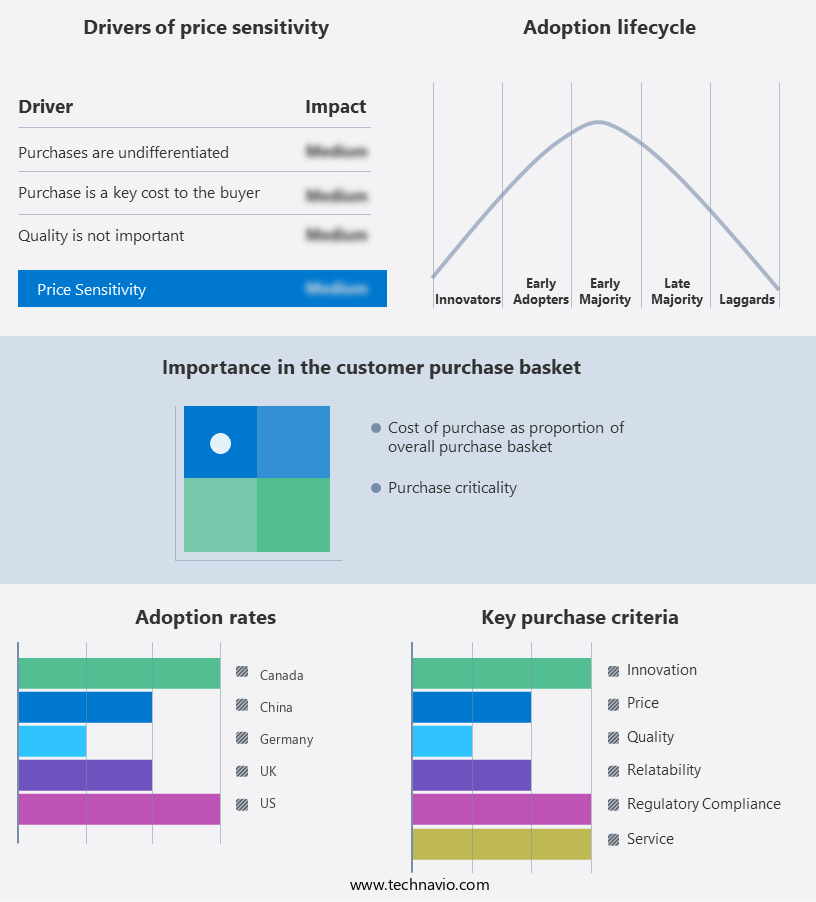
The wash basin market forecasting report includes the adoption lifecycle of the market, covering from the innovator’s stage to the laggard’s stage. It focuses on adoption rates in different regions based on penetration. Furthermore, the wash basin market report also includes key purchase criteria and drivers of price sensitivity to help companies evaluate and develop their market growth analysis strategies.

Customer Landscape
Key Companies & Market Insights
Companies are implementing various strategies, such as strategic alliances, wash basin market forecast, partnerships, mergers and acquisitions, geographical expansion, and product/service launches, to enhance their presence in the industry.
Aquatica Plumbing Group Inc. - This research highlights the diverse wash basin offerings from the company, including the Aquatica Millennium, Aquatica Spoon, Aquatica Lotus, Aquatica Coletta, and Aquaica Luna models. Each design showcases innovative features and sleek aesthetics, catering to various bathroom decor preferences.
The industry research and growth report includes detailed analyses of the competitive landscape of the market and information about key companies, including:
- Aquatica Plumbing Group Inc.
- BETTE GmbH and Co. KG
- Burgbad AG
- Drummonds Bathrooms Ltd.
- Duravit AG
- Hansgrohe SE
- Herbeau Creations of America
- Hindware Ltd.
- Huida Sanitary Ware Co. Ltd.
- Jaquar India
- Kohler Co.
- LIXIL Corp.
- MAAX Bath Inc.
- Marmorin Design
- Meridiana SL
- Omvivo Pty Ltd.
- Roca Sanitario SA
- Toto Ltd.
- VALDAMA SRL
- Villeroy and Boch AG
Qualitative and quantitative analysis of companies has been conducted to help clients understand the wider business environment as well as the strengths and weaknesses of key industry players. Data is qualitatively analyzed to categorize companies as pure play, category-focused, industry-focused, and diversified; it is quantitatively analyzed to categorize companies as dominant, leading, strong, tentative, and weak.
Recent Development and News in Wash Basin Market
- In January 2024, American Standard Brands, a leading bathroom and kitchen fixtures manufacturer, introduced its new line of smart washbasins, integrating voice control and touchless technology (American Standard Brands Press Release, 2024).
- In March 2024, Kohler Co., another major player in the market, announced a strategic partnership with Microsoft to develop IoT-enabled bathroom solutions, including smart washbasins (Kohler Co. Press Release, 2024).
- In April 2024, Geberit AG, a European market leader in sanitary technology, completed the acquisition of SFA Sanitaires, a French manufacturer of bathroom solutions, expanding its presence in the European market (Geberit AG Press Release, 2024).
- In May 2025, the European Union passed the Water Efficiency Directive, mandating a 25% reduction in water consumption for new washbasins by 2027 (European Parliament and Council of the European Union, 2025). These developments highlight significant advancements in technology, strategic partnerships, and regulatory initiatives shaping the market.
Research Analyst Overview
- The market encompasses a range of products and trends, with wall-mounted sink faucets and eco-friendly materials gaining popularity among consumers. Manufacturers are focusing on energy efficiency and quality assurance, integrating sensor and touchless faucets into their offerings. Custom fabrication and pre-fabricated sinks cater to various target markets, with solid surface countertops, granite, quartz, and marble being common choices. Sustainability initiatives are driving innovation, as companies explore the use of laminate countertops and ceramic tile. Price point is a key consideration, with bathroom accessories such as towel bars, toilet paper holders, and soap dispensers often included in complete wash basin solutions.
- The industry relies on advanced manufacturing equipment to produce these diverse offerings, with finish options and texture choices adding to the consumer experience. Import/export plays a significant role in the market, with raw materials sourced globally to meet demand. Overall, consumer preferences shape the market, with a focus on functionality, design, and sustainability.
Dive into Technavio’s robust research methodology, blending expert interviews, extensive data synthesis, and validated models for unparalleled Wash Basin Market insights. See full methodology.
Market Scope
|
Report Coverage
|
Details
|
Page number
|
196
|
Base year
|
2024
|
Historic period
|
2019-2023 |
Forecast period
|
2025-2029
|
Growth momentum & CAGR
|
Accelerate at a CAGR of 3.3%
|
Market growth 2025-2029
|
USD 307.9 million
|
Market structure
|
Fragmented
|
YoY growth 2024-2025(%)
|
3.2
|
Key countries
|
US, Canada, Germany, UK, Italy, France, China, India, Japan, Brazil, Egypt, UAE, Oman, Argentina, KSA, UAE, Brazil, and Rest of World (ROW)
|
Competitive landscape
|
Leading Companies, Market Positioning of Companies, Competitive Strategies, and Industry Risks
|
Request Free Sample
What are the Key Data Covered in this Wash Basin Market Research and Growth Report?
- CAGR of the Wash Basin industry during the forecast period
- Detailed information on factors that will drive the growth and forecasting between 2025 and 2029
- Precise estimation of the size of the market and its contribution of the industry in focus to the parent market
- Accurate predictions about upcoming growth and trends and changes in consumer behaviour
- Growth of the market across APAC, North America, Europe, South America, and Middle East and Africa
- Thorough analysis of the market’s competitive landscape and detailed information about companies
- Comprehensive analysis of factors that will challenge the wash basin market growth of industry companies
We can help! Our analysts can customize this wash basin market research report to meet your requirements.
Get in touch
1 Executive Summary
- 1.1 Market overview
- Executive Summary - Chart on Market Overview
- Executive Summary - Data Table on Market Overview
- Executive Summary - Chart on Global Market Characteristics
- Executive Summary - Chart on Market by Geography
- Executive Summary - Chart on Market Segmentation by Distribution Channel
- Executive Summary - Chart on Market Segmentation by End-user
- Executive Summary - Chart on Market Segmentation by Type
- Executive Summary - Chart on Incremental Growth
- Executive Summary - Data Table on Incremental Growth
- Executive Summary - Chart on Company Market Positioning
2 Technavio Analysis
- 2.1 Analysis of price sensitivity, lifecycle, customer purchase basket, adoption rates, and purchase criteria
- Analysis of price sensitivity, lifecycle, customer purchase basket, adoption rates, and purchase criteria
- 2.2 Criticality of inputs and Factors of differentiation
- Overview on criticality of inputs and factors of differentiation
- 2.3 Factors of disruption
- Overview on factors of disruption
- 2.4 Impact of drivers and challenges
- Impact of drivers and challenges in 2024 and 2029
3 Market Landscape
- 3.1 Market ecosystem
- Parent Market
- Data Table on - Parent Market
- 3.2 Market characteristics
- Market characteristics analysis
4 Market Sizing
- 4.1 Market definition
- Offerings of companies included in the market definition
- 4.2 Market segment analysis
- 4.4 Market outlook: Forecast for 2024-2029
- Chart on Global - Market size and forecast 2024-2029 ($ million)
- Data Table on Global - Market size and forecast 2024-2029 ($ million)
- Chart on Global Market: Year-over-year growth 2024-2029 (%)
- Data Table on Global Market: Year-over-year growth 2024-2029 (%)
5 Historic Market Size
- 5.1 Global Wash Basin Market 2019 - 2023
- Historic Market Size - Data Table on Global Wash Basin Market 2019 - 2023 ($ million)
- 5.2 Distribution Channel segment analysis 2019 - 2023
- Historic Market Size - Distribution Channel Segment 2019 - 2023 ($ million)
- 5.3 End-user segment analysis 2019 - 2023
- Historic Market Size - End-user Segment 2019 - 2023 ($ million)
- 5.4 Type segment analysis 2019 - 2023
- Historic Market Size - Type Segment 2019 - 2023 ($ million)
- 5.5 Geography segment analysis 2019 - 2023
- Historic Market Size - Geography Segment 2019 - 2023 ($ million)
- 5.6 Country segment analysis 2019 - 2023
- Historic Market Size - Country Segment 2019 - 2023 ($ million)
6 Qualitative Analysis
- 6.1 The AI impact on Global Wash Basin Market
7 Five Forces Analysis
- 7.1 Five forces summary
- Five forces analysis - Comparison between 2024 and 2029
- 7.2 Bargaining power of buyers
- Bargaining power of buyers - Impact of key factors 2024 and 2029
- 7.3 Bargaining power of suppliers
- Bargaining power of suppliers - Impact of key factors in 2024 and 2029
- 7.4 Threat of new entrants
- Threat of new entrants - Impact of key factors in 2024 and 2029
- 7.5 Threat of substitutes
- Threat of substitutes - Impact of key factors in 2024 and 2029
- 7.6 Threat of rivalry
- Threat of rivalry - Impact of key factors in 2024 and 2029
- 7.7 Market condition
- Chart on Market condition - Five forces 2024 and 2029
8 Market Segmentation by Distribution Channel
- 8.1 Market segments
- Chart on Distribution Channel - Market share (2024-2029) (%)
- Data Table on Distribution Channel - Market share (2024-2029) (%)
- 8.2 Comparison by Distribution Channel
- Chart on Comparison by Distribution Channel
- Data Table on Comparison by Distribution Channel
- 8.3 Offline - Market size and forecast (2024-2029)
- Chart on Offline - Market size and forecast (2024-2029) ($ million)
- Data Table on Offline - Market size and forecast (2024-2029) ($ million)
- Chart on Offline - Year-over-year growth (2024-2029) (%)
- Data Table on Offline - Year-over-year growth (2024-2029) (%)
- 8.4 Online - Market size and forecast (2024-2029)
- Chart on Online - Market size and forecast (2024-2029) ($ million)
- Data Table on Online - Market size and forecast (2024-2029) ($ million)
- Chart on Online - Year-over-year growth (2024-2029) (%)
- Data Table on Online - Year-over-year growth (2024-2029) (%)
- 8.5 Market opportunity by Distribution Channel
- Market opportunity by Distribution Channel ($ million)
- Data Table on Market opportunity by Distribution Channel ($ million)
9 Market Segmentation by End-user
- 9.1 Market segments
- Chart on End-user - Market share (2024-2029) (%)
- Data Table on End-user - Market share (2024-2029) (%)
- 9.2 Comparison by End-user
- Chart on Comparison by End-user
- Data Table on Comparison by End-user
- 9.3 Residential - Market size and forecast (2024-2029)
- Chart on Residential - Market size and forecast (2024-2029) ($ million)
- Data Table on Residential - Market size and forecast (2024-2029) ($ million)
- Chart on Residential - Year-over-year growth (2024-2029) (%)
- Data Table on Residential - Year-over-year growth (2024-2029) (%)
- 9.4 Commercial - Market size and forecast (2024-2029)
- Chart on Commercial - Market size and forecast (2024-2029) ($ million)
- Data Table on Commercial - Market size and forecast (2024-2029) ($ million)
- Chart on Commercial - Year-over-year growth (2024-2029) (%)
- Data Table on Commercial - Year-over-year growth (2024-2029) (%)
- 9.5 Market opportunity by End-user
- Market opportunity by End-user ($ million)
- Data Table on Market opportunity by End-user ($ million)
10 Market Segmentation by Type
- 10.1 Market segments
- Chart on Type - Market share (2024-2029) (%)
- Data Table on Type - Market share (2024-2029) (%)
- 10.2 Comparison by Type
- Chart on Comparison by Type
- Data Table on Comparison by Type
- 10.3 Undercounter - Market size and forecast (2024-2029)
- Chart on Undercounter - Market size and forecast (2024-2029) ($ million)
- Data Table on Undercounter - Market size and forecast (2024-2029) ($ million)
- Chart on Undercounter - Year-over-year growth (2024-2029) (%)
- Data Table on Undercounter - Year-over-year growth (2024-2029) (%)
- 10.4 Vessel - Market size and forecast (2024-2029)
- Chart on Vessel - Market size and forecast (2024-2029) ($ million)
- Data Table on Vessel - Market size and forecast (2024-2029) ($ million)
- Chart on Vessel - Year-over-year growth (2024-2029) (%)
- Data Table on Vessel - Year-over-year growth (2024-2029) (%)
- 10.5 Wall-Hung Basins - Market size and forecast (2024-2029)
- Chart on Wall-Hung Basins - Market size and forecast (2024-2029) ($ million)
- Data Table on Wall-Hung Basins - Market size and forecast (2024-2029) ($ million)
- Chart on Wall-Hung Basins - Year-over-year growth (2024-2029) (%)
- Data Table on Wall-Hung Basins - Year-over-year growth (2024-2029) (%)
- 10.6 Pedestal Basins - Market size and forecast (2024-2029)
- Chart on Pedestal Basins - Market size and forecast (2024-2029) ($ million)
- Data Table on Pedestal Basins - Market size and forecast (2024-2029) ($ million)
- Chart on Pedestal Basins - Year-over-year growth (2024-2029) (%)
- Data Table on Pedestal Basins - Year-over-year growth (2024-2029) (%)
- 10.7 Semi-Recessed Basins - Market size and forecast (2024-2029)
- Chart on Semi-Recessed Basins - Market size and forecast (2024-2029) ($ million)
- Data Table on Semi-Recessed Basins - Market size and forecast (2024-2029) ($ million)
- Chart on Semi-Recessed Basins - Year-over-year growth (2024-2029) (%)
- Data Table on Semi-Recessed Basins - Year-over-year growth (2024-2029) (%)
- 10.8 Integrated Basins - Market size and forecast (2024-2029)
- Chart on Integrated Basins - Market size and forecast (2024-2029) ($ million)
- Data Table on Integrated Basins - Market size and forecast (2024-2029) ($ million)
- Chart on Integrated Basins - Year-over-year growth (2024-2029) (%)
- Data Table on Integrated Basins - Year-over-year growth (2024-2029) (%)
- 10.9 Market opportunity by Type
- Market opportunity by Type ($ million)
- Data Table on Market opportunity by Type ($ million)
11 Market Segmentation by Material
- 11.1 Market segments
- Chart on Material - Market share (2024-2029) (%)
- Data Table on Material - Market share (2024-2029) (%)
- 11.2 Comparison by Material
- Chart on Comparison by Material
- Data Table on Comparison by Material
- 11.3 Ceramic - Market size and forecast (2024-2029)
- Chart on Ceramic - Market size and forecast (2024-2029) ($ million)
- Data Table on Ceramic - Market size and forecast (2024-2029) ($ million)
- Chart on Ceramic - Year-over-year growth (2024-2029) (%)
- Data Table on Ceramic - Year-over-year growth (2024-2029) (%)
- 11.4 Porcelain - Market size and forecast (2024-2029)
- Chart on Porcelain - Market size and forecast (2024-2029) ($ million)
- Data Table on Porcelain - Market size and forecast (2024-2029) ($ million)
- Chart on Porcelain - Year-over-year growth (2024-2029) (%)
- Data Table on Porcelain - Year-over-year growth (2024-2029) (%)
- 11.5 Stone (Marble, Granite) - Market size and forecast (2024-2029)
- Chart on Stone (Marble, Granite) - Market size and forecast (2024-2029) ($ million)
- Data Table on Stone (Marble, Granite) - Market size and forecast (2024-2029) ($ million)
- Chart on Stone (Marble, Granite) - Year-over-year growth (2024-2029) (%)
- Data Table on Stone (Marble, Granite) - Year-over-year growth (2024-2029) (%)
- 11.6 Glass - Market size and forecast (2024-2029)
- Chart on Glass - Market size and forecast (2024-2029) ($ million)
- Data Table on Glass - Market size and forecast (2024-2029) ($ million)
- Chart on Glass - Year-over-year growth (2024-2029) (%)
- Data Table on Glass - Year-over-year growth (2024-2029) (%)
- 11.7 Metal - Market size and forecast (2024-2029)
- Chart on Metal - Market size and forecast (2024-2029) ($ million)
- Data Table on Metal - Market size and forecast (2024-2029) ($ million)
- Chart on Metal - Year-over-year growth (2024-2029) (%)
- Data Table on Metal - Year-over-year growth (2024-2029) (%)
- 11.8 Solid Surface - Market size and forecast (2024-2029)
- Chart on Solid Surface - Market size and forecast (2024-2029) ($ million)
- Data Table on Solid Surface - Market size and forecast (2024-2029) ($ million)
- Chart on Solid Surface - Year-over-year growth (2024-2029) (%)
- Data Table on Solid Surface - Year-over-year growth (2024-2029) (%)
- 11.9 Market opportunity by Material
- Market opportunity by Material ($ million)
- Data Table on Market opportunity by Material ($ million)
12 Market Segmentation by Design
- 12.1 Market segments
- Chart on Design - Market share (2024-2029) (%)
- Data Table on Design - Market share (2024-2029) (%)
- 12.2 Comparison by Design
- Chart on Comparison by Design
- Data Table on Comparison by Design
- 12.3 Modern - Market size and forecast (2024-2029)
- Chart on Modern - Market size and forecast (2024-2029) ($ million)
- Data Table on Modern - Market size and forecast (2024-2029) ($ million)
- Chart on Modern - Year-over-year growth (2024-2029) (%)
- Data Table on Modern - Year-over-year growth (2024-2029) (%)
- 12.4 Traditional - Market size and forecast (2024-2029)
- Chart on Traditional - Market size and forecast (2024-2029) ($ million)
- Data Table on Traditional - Market size and forecast (2024-2029) ($ million)
- Chart on Traditional - Year-over-year growth (2024-2029) (%)
- Data Table on Traditional - Year-over-year growth (2024-2029) (%)
- 12.5 Contemporary - Market size and forecast (2024-2029)
- Chart on Contemporary - Market size and forecast (2024-2029) ($ million)
- Data Table on Contemporary - Market size and forecast (2024-2029) ($ million)
- Chart on Contemporary - Year-over-year growth (2024-2029) (%)
- Data Table on Contemporary - Year-over-year growth (2024-2029) (%)
- 12.6 Artistic - Market size and forecast (2024-2029)
- Chart on Artistic - Market size and forecast (2024-2029) ($ million)
- Data Table on Artistic - Market size and forecast (2024-2029) ($ million)
- Chart on Artistic - Year-over-year growth (2024-2029) (%)
- Data Table on Artistic - Year-over-year growth (2024-2029) (%)
- 12.7 Market opportunity by Design
- Market opportunity by Design ($ million)
- Data Table on Market opportunity by Design ($ million)
13 Customer Landscape
- 13.1 Customer landscape overview
- Analysis of price sensitivity, lifecycle, customer purchase basket, adoption rates, and purchase criteria
14 Geographic Landscape
- 14.1 Geographic segmentation
- Chart on Market share by geography 2024-2029 (%)
- Data Table on Market share by geography 2024-2029 (%)
- 14.2 Geographic comparison
- Chart on Geographic comparison
- Data Table on Geographic comparison
- 14.3 APAC - Market size and forecast 2024-2029
- Chart on APAC - Market size and forecast 2024-2029 ($ million)
- Data Table on APAC - Market size and forecast 2024-2029 ($ million)
- Chart on APAC - Year-over-year growth 2024-2029 (%)
- Data Table on APAC - Year-over-year growth 2024-2029 (%)
- 14.4 North America - Market size and forecast 2024-2029
- Chart on North America - Market size and forecast 2024-2029 ($ million)
- Data Table on North America - Market size and forecast 2024-2029 ($ million)
- Chart on North America - Year-over-year growth 2024-2029 (%)
- Data Table on North America - Year-over-year growth 2024-2029 (%)
- 14.5 Europe - Market size and forecast 2024-2029
- Chart on Europe - Market size and forecast 2024-2029 ($ million)
- Data Table on Europe - Market size and forecast 2024-2029 ($ million)
- Chart on Europe - Year-over-year growth 2024-2029 (%)
- Data Table on Europe - Year-over-year growth 2024-2029 (%)
- 14.6 South America - Market size and forecast 2024-2029
- Chart on South America - Market size and forecast 2024-2029 ($ million)
- Data Table on South America - Market size and forecast 2024-2029 ($ million)
- Chart on South America - Year-over-year growth 2024-2029 (%)
- Data Table on South America - Year-over-year growth 2024-2029 (%)
- 14.7 Middle East and Africa - Market size and forecast 2024-2029
- Chart on Middle East and Africa - Market size and forecast 2024-2029 ($ million)
- Data Table on Middle East and Africa - Market size and forecast 2024-2029 ($ million)
- Chart on Middle East and Africa - Year-over-year growth 2024-2029 (%)
- Data Table on Middle East and Africa - Year-over-year growth 2024-2029 (%)
- 14.8 US - Market size and forecast 2024-2029
- Chart on US - Market size and forecast 2024-2029 ($ million)
- Data Table on US - Market size and forecast 2024-2029 ($ million)
- Chart on US - Year-over-year growth 2024-2029 (%)
- Data Table on US - Year-over-year growth 2024-2029 (%)
- 14.9 China - Market size and forecast 2024-2029
- Chart on China - Market size and forecast 2024-2029 ($ million)
- Data Table on China - Market size and forecast 2024-2029 ($ million)
- Chart on China - Year-over-year growth 2024-2029 (%)
- Data Table on China - Year-over-year growth 2024-2029 (%)
- 14.10 UK - Market size and forecast 2024-2029
- Chart on UK - Market size and forecast 2024-2029 ($ million)
- Data Table on UK - Market size and forecast 2024-2029 ($ million)
- Chart on UK - Year-over-year growth 2024-2029 (%)
- Data Table on UK - Year-over-year growth 2024-2029 (%)
- 14.11 Germany - Market size and forecast 2024-2029
- Chart on Germany - Market size and forecast 2024-2029 ($ million)
- Data Table on Germany - Market size and forecast 2024-2029 ($ million)
- Chart on Germany - Year-over-year growth 2024-2029 (%)
- Data Table on Germany - Year-over-year growth 2024-2029 (%)
- 14.12 Japan - Market size and forecast 2024-2029
- Chart on Japan - Market size and forecast 2024-2029 ($ million)
- Data Table on Japan - Market size and forecast 2024-2029 ($ million)
- Chart on Japan - Year-over-year growth 2024-2029 (%)
- Data Table on Japan - Year-over-year growth 2024-2029 (%)
- 14.13 Canada - Market size and forecast 2024-2029
- Chart on Canada - Market size and forecast 2024-2029 ($ million)
- Data Table on Canada - Market size and forecast 2024-2029 ($ million)
- Chart on Canada - Year-over-year growth 2024-2029 (%)
- Data Table on Canada - Year-over-year growth 2024-2029 (%)
- 14.14 India - Market size and forecast 2024-2029
- Chart on India - Market size and forecast 2024-2029 ($ million)
- Data Table on India - Market size and forecast 2024-2029 ($ million)
- Chart on India - Year-over-year growth 2024-2029 (%)
- Data Table on India - Year-over-year growth 2024-2029 (%)
- 14.15 Australia - Market size and forecast 2024-2029
- Chart on Australia - Market size and forecast 2024-2029 ($ million)
- Data Table on Australia - Market size and forecast 2024-2029 ($ million)
- Chart on Australia - Year-over-year growth 2024-2029 (%)
- Data Table on Australia - Year-over-year growth 2024-2029 (%)
- 14.16 Brazil - Market size and forecast 2024-2029
- Chart on Brazil - Market size and forecast 2024-2029 ($ million)
- Data Table on Brazil - Market size and forecast 2024-2029 ($ million)
- Chart on Brazil - Year-over-year growth 2024-2029 (%)
- Data Table on Brazil - Year-over-year growth 2024-2029 (%)
- 14.17 France - Market size and forecast 2024-2029
- Chart on France - Market size and forecast 2024-2029 ($ million)
- Data Table on France - Market size and forecast 2024-2029 ($ million)
- Chart on France - Year-over-year growth 2024-2029 (%)
- Data Table on France - Year-over-year growth 2024-2029 (%)
- 14.18 Market opportunity by geography
- Market opportunity by geography ($ million)
- Data Tables on Market opportunity by geography ($ million)
- 14.19 Italy - Market size and forecast (2024-2029)
- Chart on Italy - Market size and forecast (2024-2029) ($ million)
- Data Table on Italy - Market size and forecast (2024-2029) ($ million)
- Chart on Italy - Year-over-year growth (2024-2029) (%)
- Data Table on Italy - Year-over-year growth (2024-2029) (%)
- 14.20 Egypt - Market size and forecast (2024-2029)
- Chart on Egypt - Market size and forecast (2024-2029) ($ million)
- Data Table on Egypt - Market size and forecast (2024-2029) ($ million)
- Chart on Egypt - Year-over-year growth (2024-2029) (%)
- Data Table on Egypt - Year-over-year growth (2024-2029) (%)
- 14.21 UAE - Market size and forecast (2024-2029)
- Chart on UAE - Market size and forecast (2024-2029) ($ million)
- Data Table on UAE - Market size and forecast (2024-2029) ($ million)
- Chart on UAE - Year-over-year growth (2024-2029) (%)
- Data Table on UAE - Year-over-year growth (2024-2029) (%)
- 14.22 Oman - Market size and forecast (2024-2029)
- Chart on Oman - Market size and forecast (2024-2029) ($ million)
- Data Table on Oman - Market size and forecast (2024-2029) ($ million)
- Chart on Oman - Year-over-year growth (2024-2029) (%)
- Data Table on Oman - Year-over-year growth (2024-2029) (%)
- 14.23 Argentina - Market size and forecast (2024-2029)
- Chart on Argentina - Market size and forecast (2024-2029) ($ million)
- Data Table on Argentina - Market size and forecast (2024-2029) ($ million)
- Chart on Argentina - Year-over-year growth (2024-2029) (%)
- Data Table on Argentina - Year-over-year growth (2024-2029) (%)
- 14.24 KSA - Market size and forecast (2024-2029)
- Chart on KSA - Market size and forecast (2024-2029) ($ million)
- Data Table on KSA - Market size and forecast (2024-2029) ($ million)
- Chart on KSA - Year-over-year growth (2024-2029) (%)
- Data Table on KSA - Year-over-year growth (2024-2029) (%)
- 14.25 Rest of World (ROW) - Market size and forecast (2024-2029)
- Chart on Rest of World (ROW) - Market size and forecast (2024-2029) ($ million)
- Data Table on Rest of World (ROW) - Market size and forecast (2024-2029) ($ million)
- Chart on Rest of World (ROW) - Year-over-year growth (2024-2029) (%)
- Data Table on Rest of World (ROW) - Year-over-year growth (2024-2029) (%)
15 Drivers, Challenges, and Opportunity/Restraints
- 15.3 Impact of drivers and challenges
- Impact of drivers and challenges in 2024 and 2029
- 15.4 Market opportunities/restraints
16 Competitive Landscape
- 16.2 Competitive Landscape
- Overview on criticality of inputs and factors of differentiation
- 16.3 Landscape disruption
- Overview on factors of disruption
- 16.4 Industry risks
- Impact of key risks on business
17 Competitive Analysis
- 17.2 Company ranking index
- 17.3 Market positioning of companies
- Matrix on companies position and classification
- 17.4 Aquatica Plumbing Group Inc.
- Aquatica Plumbing Group Inc. - Overview
- Aquatica Plumbing Group Inc. - Product / Service
- Aquatica Plumbing Group Inc. - Key offerings
- SWOT
- 17.5 Burgbad AG
- Burgbad AG - Overview
- Burgbad AG - Product / Service
- Burgbad AG - Key offerings
- SWOT
- 17.6 Drummonds Bathrooms Ltd.
- Drummonds Bathrooms Ltd. - Overview
- Drummonds Bathrooms Ltd. - Product / Service
- Drummonds Bathrooms Ltd. - Key offerings
- SWOT
- 17.7 Duravit AG
- Duravit AG - Overview
- Duravit AG - Product / Service
- Duravit AG - Key offerings
- SWOT
- 17.8 Hansgrohe SE
- Hansgrohe SE - Overview
- Hansgrohe SE - Product / Service
- Hansgrohe SE - Key offerings
- SWOT
- 17.9 Herbeau Creations of America
- Herbeau Creations of America - Overview
- Herbeau Creations of America - Product / Service
- Herbeau Creations of America - Key offerings
- SWOT
- 17.10 Hindware Ltd.
- Hindware Ltd. - Overview
- Hindware Ltd. - Product / Service
- Hindware Ltd. - Key offerings
- SWOT
- 17.11 Jaquar India
- Jaquar India - Overview
- Jaquar India - Product / Service
- Jaquar India - Key offerings
- SWOT
- 17.12 Kohler Co.
- Kohler Co. - Overview
- Kohler Co. - Product / Service
- Kohler Co. - Key news
- Kohler Co. - Key offerings
- SWOT
- 17.13 LIXIL Corp.
- LIXIL Corp. - Overview
- LIXIL Corp. - Business segments
- LIXIL Corp. - Key news
- LIXIL Corp. - Key offerings
- LIXIL Corp. - Segment focus
- SWOT
- 17.14 MAAX Bath Inc.
- MAAX Bath Inc. - Overview
- MAAX Bath Inc. - Product / Service
- MAAX Bath Inc. - Key offerings
- SWOT
- 17.15 Omvivo Pty Ltd.
- Omvivo Pty Ltd. - Overview
- Omvivo Pty Ltd. - Product / Service
- Omvivo Pty Ltd. - Key offerings
- SWOT
- 17.16 Roca Sanitario SA
- Roca Sanitario SA - Overview
- Roca Sanitario SA - Product / Service
- Roca Sanitario SA - Key news
- Roca Sanitario SA - Key offerings
- SWOT
- 17.17 Toto Ltd.
- Toto Ltd. - Overview
- Toto Ltd. - Business segments
- Toto Ltd. - Key offerings
- Toto Ltd. - Segment focus
- SWOT
- 17.18 Villeroy and Boch AG
- Villeroy and Boch AG - Overview
- Villeroy and Boch AG - Business segments
- Villeroy and Boch AG - Key offerings
- Villeroy and Boch AG - Segment focus
- SWOT
18 Appendix
- 18.2 Inclusions and exclusions checklist
- Inclusions checklist
- Exclusions checklist
- 18.3 Currency conversion rates for US$
- Currency conversion rates for US$
- 18.4 Research methodology
- 18.7 Validation techniques employed for market sizing
- Validation techniques employed for market sizing
- 18.9 360 degree market analysis
- 360 degree market analysis
- 18.10 List of abbreviations