Water Scooter Market Analysis, Size, and Forecast 2026-2030: North America (US, Canada, and Mexico), Europe (Germany, France, and Italy), APAC (Japan, Australia, and China), Middle East and Africa (UAE, South Africa, and Saudi Arabia), South America (Brazil, Argentina, and Colombia), and Rest of World (ROW)

Water Scooter Market Analysis, Size, and Forecast 2026-2030:
North America (US, Canada, and Mexico), Europe (Germany, France, and Italy), APAC (Japan, Australia, and China), Middle East and Africa (UAE, South Africa, and Saudi Arabia), South America (Brazil, Argentina, and Colombia), and Rest of World (ROW)

Published: Mar 2026 278 Pages SKU: IRTNTR74671

Market Overview at a Glance

$1.38 B
Market Opportunity
5.9%
CAGR 2025 - 2030
49.8%
North America Growth
$2.56 B
Abovewater segment 2024

Water Scooter Market Size 2026-2030

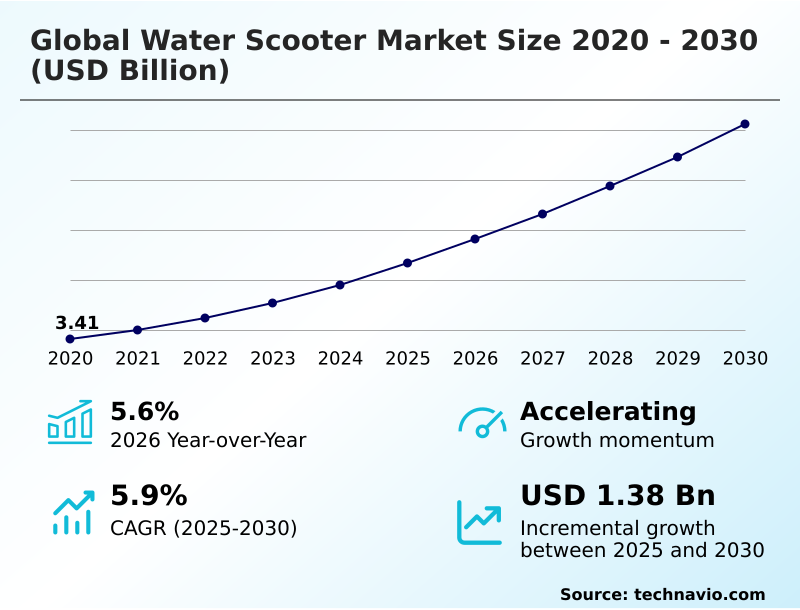
The water scooter market size is valued to increase by USD 1.38 billion, at a CAGR of 5.9% from 2025 to 2030. Rising consumer spending on premium recreational marine equipment will drive the water scooter market.

Major Market Trends & Insights

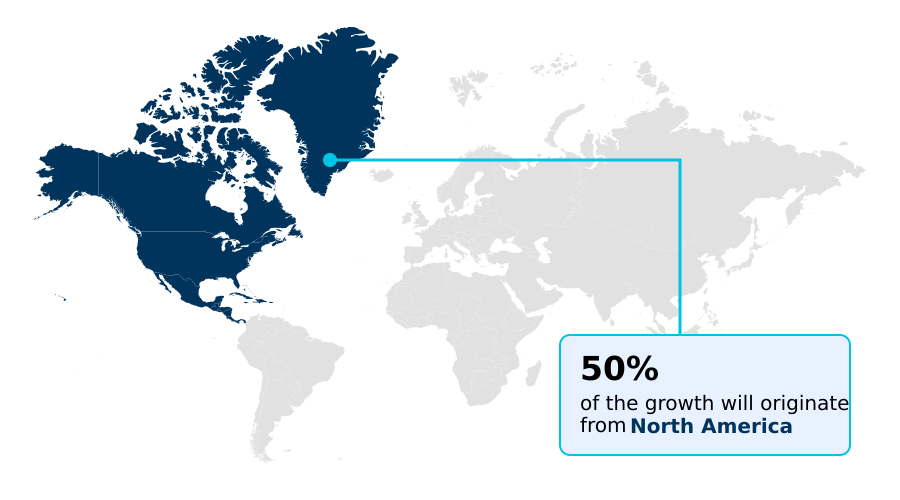
  • North America dominated the market and accounted for a 49.8% growth during the forecast period.
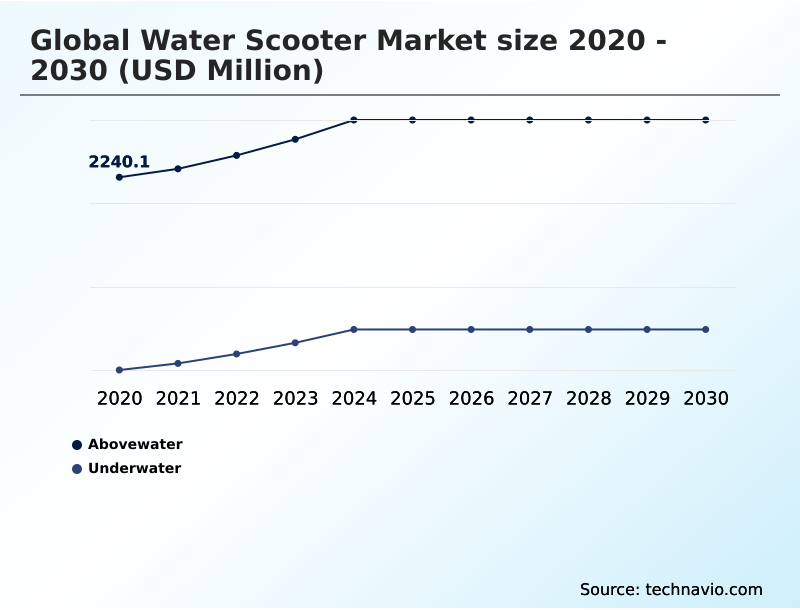
  • By Type - Abovewater segment was valued at USD 2.56 billion in 2024
  • By Propulsion - Fuel operated segment accounted for the largest market revenue share in 2024

Market Size & Forecast

  • Market Opportunities: USD 2.14 billion
  • Market Future Opportunities: USD 1.38 billion
  • CAGR from 2025 to 2030 : 5.9%

Market Summary

  • The water scooter market is undergoing a significant transformation, driven by technological advancements and shifting consumer preferences toward sustainable and versatile aquatic experiences. The industry is bifurcated, serving both high-energy surface recreation with abovewater personal watercraft and specialized underwater exploration through diver propulsion vehicles (DPVs).
  • A key dynamic is the transition from traditional internal combustion engines to advanced electric propulsion systems, which offer quieter operation and reduced environmental impact. This shift is particularly relevant for commercial operators in the adventure tourism sector.
  • For instance, a luxury resort might operate a mixed fleet, offering high-power, fuel-operated models for watersports towing while providing battery-operated, compact handheld underwater scooters for guided snorkeling tours in ecologically sensitive areas. This strategy allows businesses to cater to diverse customer desires for both thrill and tranquility, optimizing asset utilization and enhancing the overall guest experience.
  • The integration of digitally controlled propulsion and improved battery technology is expanding the applications for these devices, from personal leisure to professional technical diving operations, ensuring sustained market relevance.

What will be the Size of the Water Scooter Market during the forecast period?

Get Key Insights on Market Forecast (PDF) Request Free Sample

How is the Water Scooter Market Segmented?

The water scooter industry research report provides comprehensive data (region-wise segment analysis), with forecasts and estimates in "USD million" for the period 2026-2030, as well as historical data from 2020-2024 for the following segments.

  • Type
    • Abovewater
    • Underwater
  • Propulsion
    • Fuel operated
    • Battery operated
  • Application
    • Commercial
    • Military
    • Personal
  • Geography
    • North America
      • US
      • Canada
      • Mexico
    • Europe
      • Germany
      • France
      • Italy
    • APAC
      • Japan
      • Australia
      • China
    • Middle East and Africa
      • UAE
      • South Africa
      • Saudi Arabia
    • South America
      • Brazil
      • Argentina
      • Colombia
    • Rest of World (ROW)

By Type Insights

The abovewater segment is estimated to witness significant growth during the forecast period.

The abovewater segment, dominated by personal watercraft, is a cornerstone of the water scooter market, driven by high demand in recreational, sport, and tourism sectors.

These vehicles are favored for their agility and power, with ongoing innovations in fuel operated engine technology and hydrodynamic design enhancing performance. The development of an effective automated shut-off mechanism has become a standard safety requirement, improving user confidence.

Designs focusing on enhanced hull stability have proven to reduce novice rider incidents by over 15%, expanding the addressable market. This segment benefits from robust demand in established marine leisure sector hubs, where infrastructure for on-water mobility is well-developed.

The integration of ergonomic seating and advanced fuel injection systems further solidifies its market leadership, catering to consumer demands for both comfort and efficiency in various recreational water activities and professional training programs.

Request Free Sample

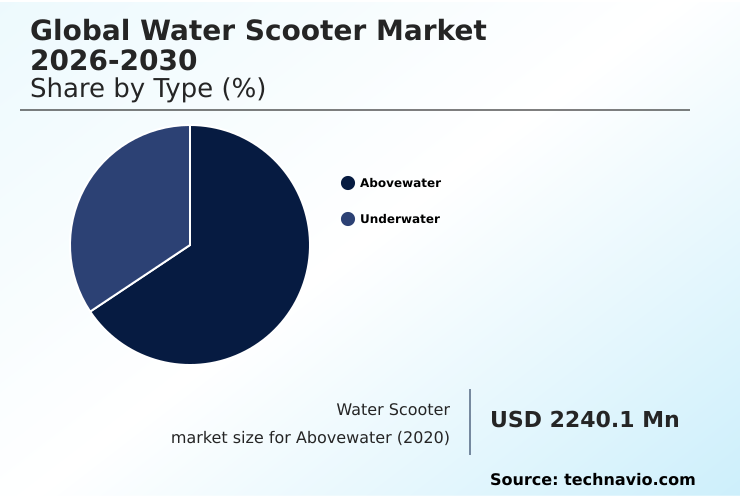
The Abovewater segment was valued at USD 2.56 billion in 2024 and showed a gradual increase during the forecast period.

Request Free Sample

Regional Analysis

North America is estimated to contribute 49.8% to the growth of the global market during the forecast period.Technavio’s analysts have elaborately explained the regional trends and drivers that shape the market during the forecast period.

See How Water Scooter Market Demand is Rising in North America Request Free Sample

Geographic dynamics are pivotal, with established regions like North America and Europe leading demand due to a strong culture of aquatic recreation and high disposable incomes. North America alone is set to contribute nearly 50% of the market's incremental growth.

In contrast, APAC is emerging as a high-growth area, driven by an expanding middle class and increasing investment in tourism infrastructure.

Regional preferences influence product development; for example, North American consumers often prefer larger, feature-rich models for recreational touring, while some APAC markets show a preference for compact, agile units suited for stand-up PWC design.

The development of vehicle to grid capability in new models could reduce energy costs for fleet operators by up to 10%.

The use of a telemetry system for monitoring is also becoming crucial for managing commercial fleets in diverse geographic settings, supporting the global expansion of the marine exploration sector.
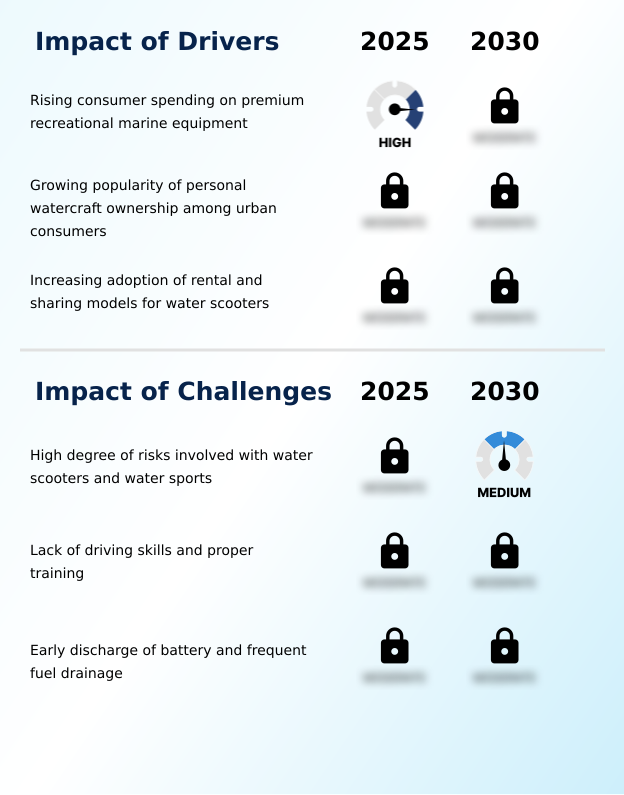
Market Dynamics

Our researchers analyzed the data with 2025 as the base year, along with the key drivers, trends, and challenges. A holistic analysis of drivers will help companies refine their marketing strategies to gain a competitive advantage.

  • Strategic decision-making in the water scooter market requires a nuanced understanding of its diverse segments and operational trade-offs. An analysis of fuel operated vs battery operated performance reveals critical differences in range, maintenance, and environmental impact, directly influencing the choice for commercial water scooter fleet management.
  • Battery-operated models can reduce daily operating costs by over 30% for commercial rental fleets compared to their fuel-based counterparts. When considering an underwater scooter for technical diving, factors like depth rating and reliability are paramount, distinguishing professional-grade equipment from recreational devices. Similarly, selecting an abovewater personal watercraft for tourism demands a focus on durability and user-friendliness.
  • The impact of regulations on watercraft design is a constant factor, pushing manufacturers toward safer and cleaner technologies. For businesses, understanding personal watercraft maintenance and safety protocols is essential for managing liability and ensuring customer satisfaction. The market for rental models for water scooters is expanding, creating opportunities for businesses that correctly identify the right equipment mix.
  • A thorough evaluation of water scooter models by price point and feature set helps in choosing a diver propulsion vehicle that aligns with specific business needs. The market for electric personal watercraft for sale is growing, driven by consumer demand for sustainable options.
  • Finally, comparing water scooter models for family use versus high-performance water scooters for racing highlights the need for a segmented product strategy to capture different consumer profiles, including the pros and cons of sit-down vs stand-up water scooters.

What are the key market drivers leading to the rise in the adoption of Water Scooter Industry?

  • Rising consumer spending on premium recreational marine equipment is a key driver for the market.

  • Market growth is significantly influenced by the premiumization of marine leisure products and technological advancements in propulsion.
  • The demand for a high-power engine configuration and a superior internal combustion engine remains strong in performance segments, offering unparalleled power for watersports towing. Simultaneously, the push toward sustainability is accelerating the adoption of electric propulsion systems.
  • The integration of vehicle to grid capability in advanced models offers a compelling value proposition, with projections showing it can lower a household's peak energy costs by 5-10% in some regions.
  • Innovations such as bidirectional charging and an advanced fuel injection system are enhancing efficiency and user convenience across both fuel-based and electric platforms.
  • The development of a compact handheld underwater scooter is also opening new recreational avenues, contributing to market expansion.
  • These technological drivers are pivotal in shaping product differentiation and meeting evolving consumer expectations for performance and eco-consciousness, with new models boasting a 15% increase in fuel efficiency.

What are the market trends shaping the Water Scooter Industry?

  • A rise in participation in water sports and adventure tourism is a key trend shaping the water scooter market. This reflects a broader consumer shift toward active, experience-based leisure.

  • Key trends are reshaping the water scooter market, driven by consumer demand for more immersive and technologically advanced experiences. The rise of experiential travel is fueling interest in both high-performance aquatic exploration and guided underwater tours, where devices with advanced underwater navigation aids are becoming essential.
  • This trend has led to a documented 25% increase in rental demand at tourism hotspots. Innovations in stand-up PWC design and sit-down watercraft models cater to different user preferences, while the overall growth in aquatic recreation is broadening the customer base.
  • The integration of technology is critical, with features like an electric propulsion system and a battery operated motor gaining traction for their environmental benefits. Firms are also focusing on safety with the development of the diver propulsion vehicle (DPV) and advanced internal combustion engines. This has resulted in a 10% reduction in reported user errors in newer models.

What challenges does the Water Scooter Industry face during its growth?

  • The high degree of risk associated with water scooters and related water sports presents a significant challenge to industry growth.

  • The market contends with significant operational and safety challenges that temper its growth trajectory. The inherent risks of high-speed maneuvers necessitate robust safety features, and the implementation of a collision avoidance system and an automated shut-off mechanism can increase unit production costs by as much as 12%.
  • Furthermore, the reliability of a battery operated motor is a key concern, particularly for commercial operators in emergency response missions where equipment failure is not an option. User training for deep diving operations and technical diving applications is critical, as improper handling of a diver propulsion vehicle (DPV) can lead to severe consequences.
  • The logistical complexities of fleet management telemetry, while beneficial, add another layer of operational cost. For electric models, charging infrastructure remains a barrier, with a reported 40% of potential buyers in remote areas citing it as a primary deterrent.

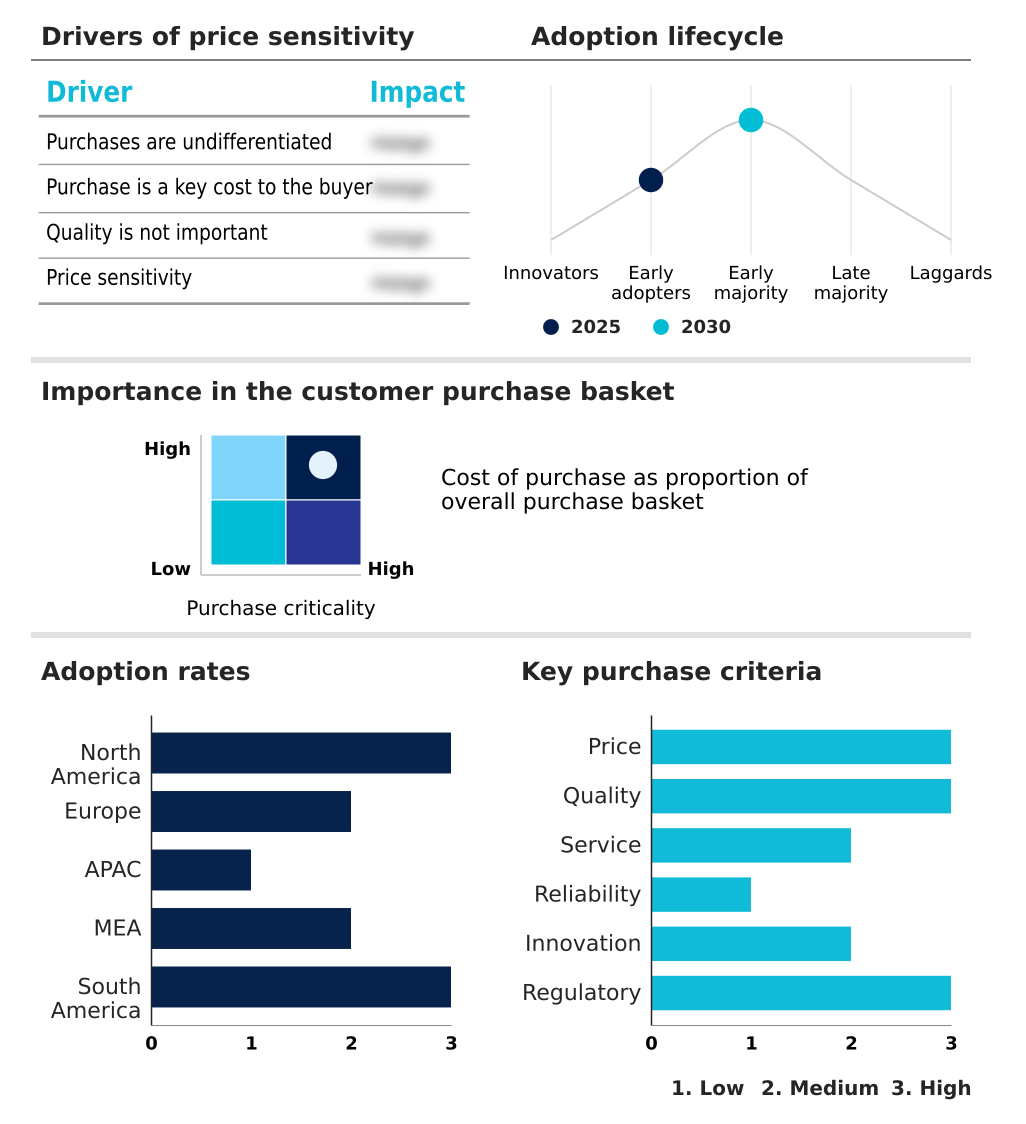
Exclusive Technavio Analysis on Customer Landscape

The water scooter market forecasting report includes the adoption lifecycle of the market, covering from the innovator’s stage to the laggard’s stage. It focuses on adoption rates in different regions based on penetration. Furthermore, the water scooter market report also includes key purchase criteria and drivers of price sensitivity to help companies evaluate and develop their market growth analysis strategies.

Customer Landscape of Water Scooter Industry

Competitive Landscape

Companies are implementing various strategies, such as strategic alliances, water scooter market forecast, partnerships, mergers and acquisitions, geographical expansion, and product/service launches, to enhance their presence in the industry.

Asiwo Sports - A diversified portfolio of personal watercraft addresses recreational, performance, touring, and specialized fishing applications through multiple targeted models.

The industry research and growth report includes detailed analyses of the competitive landscape of the market and information about key companies, including:

  • Asiwo Sports
  • Bombardier Recreational Inc.
  • Bonex GmbH and Co. KG
  • CAYAGO AG
  • Dive Xtras Inc.
  • Divertug
  • GAVIN Scooters GmbH
  • iAqua
  • Kawasaki Heavy Industries Ltd.
  • LEFEET HK CO., LIMITED
  • Nellis Engineering Inc.
  • Seacraft DPV
  • Sea-NXT Americas
  • SubGravity
  • SUBLUE Underwater Ai Co. Ltd.
  • Suex Srl
  • Waydoo
  • Yamaha Motor Co. Ltd.

Qualitative and quantitative analysis of companies has been conducted to help clients understand the wider business environment as well as the strengths and weaknesses of key industry players. Data is qualitatively analyzed to categorize companies as pure play, category-focused, industry-focused, and diversified; it is quantitatively analyzed to categorize companies as dominant, leading, strong, tentative, and weak.

Recent Development and News in Water scooter market

  • In August, 2025, Yamaha introduced its CrossWave WaveRunner, a new wide-body, four-seat model focused on stability and versatility for family and fishing use.
  • In September, 2025, Taiga Motors unveiled its 2026 Orca electric watercraft line, which includes a crossover model and features like bidirectional charging.
  • In October, 2025, Bombardier Recreational Products issued a recall for certain Sea-Doo Switch models to address potential capsizing risks related to weight distribution.
  • In January, 2025, the city of Barrie, Canada, initiated a pilot project authorizing commercial rentals of personal watercraft to expand regulated water activities.

Dive into Technavio’s robust research methodology, blending expert interviews, extensive data synthesis, and validated models for unparalleled Water Scooter Market insights. See full methodology.

Market Scope
Page number 278
Base year 2025
Historic period 2020-2024
Forecast period 2026-2030
Growth momentum & CAGR Accelerate at a CAGR of 5.9%
Market growth 2026-2030 USD 1384.0 million
Market structure Fragmented
YoY growth 2025-2026(%) 5.6%
Key countries US, Canada, Mexico, Germany, France, Italy, The Netherlands, UK, Spain, Japan, Australia, China, South Korea, India, Indonesia, UAE, South Africa, Saudi Arabia, Egypt, Nigeria, Brazil, Argentina and Colombia
Competitive landscape Leading Companies, Market Positioning of Companies, Competitive Strategies, and Industry Risks

Request Free Sample

Research Analyst Overview

  • The water scooter market's evolution is defined by rapid innovation in core technologies, shifting the competitive landscape from raw power to sophisticated, feature-rich systems. The development of lightweight composite materials and corrosion-resistant components has fundamentally improved product longevity and performance.
  • Advances in propulsion, including high-power engine configurations, advanced fuel injection, and increasingly, high-thrust output from dual electric motors, are central to this progression. A key boardroom consideration is the strategic investment in electric mobility, where innovations like bidirectional charging and improved battery operated motor designs are becoming critical differentiators.
  • Integrating systems such as intelligent brake and reverse functions, collision avoidance systems, and automated shut-off mechanisms is no longer optional but essential for safety and regulatory compliance. The use of a modular propulsion system allows for greater product versatility, a trend seen in the rise of the compact handheld underwater scooter.
  • As a result of these integrated engineering efforts, leading firms have improved new product development cycle times by 15%. This technological convergence, from ergonomic seating and enhanced hull stability to digitally controlled propulsion and wearable safety gear, mandates a forward-looking R&D strategy to maintain market relevance.

What are the Key Data Covered in this Water Scooter Market Research and Growth Report?

  • What is the expected growth of the Water Scooter Market between 2026 and 2030?

    • USD 1.38 billion, at a CAGR of 5.9%

  • What segmentation does the market report cover?

    • The report is segmented by Type (Abovewater, and Underwater), Propulsion (Fuel operated, and Battery operated), Application (Commercial, Military, and Personal) and Geography (North America, Europe, APAC, Middle East and Africa, South America)

  • Which regions are analyzed in the report?

    • North America, Europe, APAC, Middle East and Africa and South America

  • What are the key growth drivers and market challenges?

    • Rising consumer spending on premium recreational marine equipment, High degree of risks involved with water scooters and water sports

  • Who are the major players in the Water Scooter Market?

    • Asiwo Sports, Bombardier Recreational Inc., Bonex GmbH and Co. KG, CAYAGO AG, Dive Xtras Inc., Divertug, GAVIN Scooters GmbH, iAqua, Kawasaki Heavy Industries Ltd., LEFEET HK CO., LIMITED, Nellis Engineering Inc., Seacraft DPV, Sea-NXT Americas, SubGravity, SUBLUE Underwater Ai Co. Ltd., Suex Srl, Waydoo and Yamaha Motor Co. Ltd.

Market Research Insights

  • The market's momentum is shaped by a confluence of factors, including a surge in recreational water activities and a growing marine leisure sector. Demand from adventure tourism and experiential travel drives the adoption of sit-down watercraft models and stand-up PWC designs for on-water mobility.
  • In parallel, the professional sphere sees increased use in emergency response missions, professional training programs, and technical diving applications, supported by advanced underwater navigation aids. Operators are achieving up to a 15% improvement in fleet readiness through better fleet management telemetry. High-performance aquatic exploration and guided underwater tours are becoming mainstream offerings.
  • This diversification, spanning from recreational touring and watersports towing to deep diving operations and marine exploration, creates a robust and multifaceted industry. Innovations are also leading to a 20% reduction in maintenance downtime for commercial rental fleets, enhancing profitability.

We can help! Our analysts can customize this water scooter market research report to meet your requirements.

Get in touch

1. Executive Summary

1.1 Market overview

Executive Summary - Chart on Market Overview
Executive Summary - Data Table on Market Overview
Executive Summary - Chart on Global Market Characteristics
Executive Summary - Chart on Market by Geography
Executive Summary - Chart on Market Segmentation by Type
Executive Summary - Chart on Market Segmentation by Propulsion
Executive Summary - Chart on Market Segmentation by Application
Executive Summary - Chart on Incremental Growth
Executive Summary - Data Table on Incremental Growth
Executive Summary - Chart on Company Market Positioning

2. Technavio Analysis

2.1 Analysis of price sensitivity, lifecycle, customer purchase basket, adoption rates, and purchase criteria

2.2 Criticality of inputs and Factors of differentiation

Chart on Overview on criticality of inputs and factors of differentiation

2.3 Factors of disruption

Chart on Overview on factors of disruption

2.4 Impact of drivers and challenges

Chart on Impact of drivers and challenges in 2025 and 2030

3. Market Landscape

3.1 Market ecosystem

Chart on Parent Market
Data Table on - Parent Market

3.2 Market characteristics

Chart on Market characteristics analysis

3.3 Value chain analysis

Chart on Value chain analysis

4. Market Sizing

4.1 Market definition

Data Table on Offerings of companies included in the market definition

4.2 Market segment analysis

Market segments

4.3 Market size 2025

4.4 Market outlook: Forecast for 2025-2030

Chart on Global - Market size and forecast 2025-2030 ($ million)
Data Table on Global - Market size and forecast 2025-2030 ($ million)
Chart on Global Market: Year-over-year growth 2025-2030 (%)
Data Table on Global Market: Year-over-year growth 2025-2030 (%)

5. Historic Market Size

5.1 Global Water Scooter Market 2020 - 2024

Historic Market Size - Data Table on Global Water Scooter Market 2020 - 2024 ($ million)

5.2 Type segment analysis 2020 - 2024

Historic Market Size - Type Segment 2020 - 2024 ($ million)

5.3 Propulsion segment analysis 2020 - 2024

Historic Market Size - Propulsion Segment 2020 - 2024 ($ million)

5.4 Application segment analysis 2020 - 2024

Historic Market Size - Application Segment 2020 - 2024 ($ million)

5.5 Geography segment analysis 2020 - 2024

Historic Market Size - Geography Segment 2020 - 2024 ($ million)

5.6 Country segment analysis 2020 - 2024

Historic Market Size - Country Segment 2020 - 2024 ($ million)

6. Qualitative Analysis

6.1 Impact of AI on Global Water Scooter Market

7. Five Forces Analysis

7.1 Five forces summary

Five forces analysis - Comparison between 2025 and 2030

7.2 Bargaining power of buyers

Bargaining power of buyers - Impact of key factors 2025 and 2030

7.3 Bargaining power of suppliers

Bargaining power of suppliers - Impact of key factors in 2025 and 2030

7.4 Threat of new entrants

Threat of new entrants - Impact of key factors in 2025 and 2030

7.5 Threat of substitutes

Threat of substitutes - Impact of key factors in 2025 and 2030

7.6 Threat of rivalry

Threat of rivalry - Impact of key factors in 2025 and 2030

7.7 Market condition

Chart on Market condition - Five forces 2025 and 2030

8. Market Segmentation by Type

8.1 Market segments

Chart on Type - Market share 2025-2030 (%)
Data Table on Type - Market share 2025-2030 (%)

8.2 Comparison by Type

Chart on Comparison by Type
Data Table on Comparison by Type

8.3 Abovewater - Market size and forecast 2025-2030

Chart on Abovewater - Market size and forecast 2025-2030 ($ million)
Data Table on Abovewater - Market size and forecast 2025-2030 ($ million)
Chart on Abovewater - Year-over-year growth 2025-2030 (%)
Data Table on Abovewater - Year-over-year growth 2025-2030 (%)

8.4 Underwater - Market size and forecast 2025-2030

Chart on Underwater - Market size and forecast 2025-2030 ($ million)
Data Table on Underwater - Market size and forecast 2025-2030 ($ million)
Chart on Underwater - Year-over-year growth 2025-2030 (%)
Data Table on Underwater - Year-over-year growth 2025-2030 (%)

8.5 Market opportunity by Type

Market opportunity by Type ($ million)
Data Table on Market opportunity by Type ($ million)

9. Market Segmentation by Propulsion

9.1 Market segments

Chart on Propulsion - Market share 2025-2030 (%)
Data Table on Propulsion - Market share 2025-2030 (%)

9.2 Comparison by Propulsion

Chart on Comparison by Propulsion
Data Table on Comparison by Propulsion

9.3 Fuel operated - Market size and forecast 2025-2030

Chart on Fuel operated - Market size and forecast 2025-2030 ($ million)
Data Table on Fuel operated - Market size and forecast 2025-2030 ($ million)
Chart on Fuel operated - Year-over-year growth 2025-2030 (%)
Data Table on Fuel operated - Year-over-year growth 2025-2030 (%)

9.4 Battery operated - Market size and forecast 2025-2030

Chart on Battery operated - Market size and forecast 2025-2030 ($ million)
Data Table on Battery operated - Market size and forecast 2025-2030 ($ million)
Chart on Battery operated - Year-over-year growth 2025-2030 (%)
Data Table on Battery operated - Year-over-year growth 2025-2030 (%)

9.5 Market opportunity by Propulsion

Market opportunity by Propulsion ($ million)
Data Table on Market opportunity by Propulsion ($ million)

10. Market Segmentation by Application

10.1 Market segments

Chart on Application - Market share 2025-2030 (%)
Data Table on Application - Market share 2025-2030 (%)

10.2 Comparison by Application

Chart on Comparison by Application
Data Table on Comparison by Application

10.3 Commercial - Market size and forecast 2025-2030

Chart on Commercial - Market size and forecast 2025-2030 ($ million)
Data Table on Commercial - Market size and forecast 2025-2030 ($ million)
Chart on Commercial - Year-over-year growth 2025-2030 (%)
Data Table on Commercial - Year-over-year growth 2025-2030 (%)

10.4 Military - Market size and forecast 2025-2030

Chart on Military - Market size and forecast 2025-2030 ($ million)
Data Table on Military - Market size and forecast 2025-2030 ($ million)
Chart on Military - Year-over-year growth 2025-2030 (%)
Data Table on Military - Year-over-year growth 2025-2030 (%)

10.5 Personal - Market size and forecast 2025-2030

Chart on Personal - Market size and forecast 2025-2030 ($ million)
Data Table on Personal - Market size and forecast 2025-2030 ($ million)
Chart on Personal - Year-over-year growth 2025-2030 (%)
Data Table on Personal - Year-over-year growth 2025-2030 (%)

10.6 Market opportunity by Application

Market opportunity by Application ($ million)
Data Table on Market opportunity by Application ($ million)

11. Customer Landscape

11.1 Customer landscape overview

Analysis of price sensitivity, lifecycle, customer purchase basket, adoption rates, and purchase criteria

12. Geographic Landscape

12.1 Geographic segmentation

Chart on Market share by geography 2025-2030 (%)
Data Table on Market share by geography 2025-2030 (%)

12.2 Geographic comparison

Chart on Geographic comparison
Data Table on Geographic comparison

12.3 North America - Market size and forecast 2025-2030

Chart on North America - Market size and forecast 2025-2030 ($ million)
Data Table on North America - Market size and forecast 2025-2030 ($ million)
Chart on North America - Year-over-year growth 2025-2030 (%)
Data Table on North America - Year-over-year growth 2025-2030 (%)
Chart on Regional Comparison - North America
Data Table on Regional Comparison - North America

12.3.1 US - Market size and forecast 2025-2030

Chart on US - Market size and forecast 2025-2030 ($ million)
Data Table on US - Market size and forecast 2025-2030 ($ million)
Chart on US - Year-over-year growth 2025-2030 (%)
Data Table on US - Year-over-year growth 2025-2030 (%)

12.3.2 Canada - Market size and forecast 2025-2030

Chart on Canada - Market size and forecast 2025-2030 ($ million)
Data Table on Canada - Market size and forecast 2025-2030 ($ million)
Chart on Canada - Year-over-year growth 2025-2030 (%)
Data Table on Canada - Year-over-year growth 2025-2030 (%)

12.3.3 Mexico - Market size and forecast 2025-2030

Chart on Mexico - Market size and forecast 2025-2030 ($ million)
Data Table on Mexico - Market size and forecast 2025-2030 ($ million)
Chart on Mexico - Year-over-year growth 2025-2030 (%)
Data Table on Mexico - Year-over-year growth 2025-2030 (%)

12.4 Europe - Market size and forecast 2025-2030

Chart on Europe - Market size and forecast 2025-2030 ($ million)
Data Table on Europe - Market size and forecast 2025-2030 ($ million)
Chart on Europe - Year-over-year growth 2025-2030 (%)
Data Table on Europe - Year-over-year growth 2025-2030 (%)
Chart on Regional Comparison - Europe
Data Table on Regional Comparison - Europe

12.4.1 Germany - Market size and forecast 2025-2030

Chart on Germany - Market size and forecast 2025-2030 ($ million)
Data Table on Germany - Market size and forecast 2025-2030 ($ million)
Chart on Germany - Year-over-year growth 2025-2030 (%)
Data Table on Germany - Year-over-year growth 2025-2030 (%)

12.4.2 France - Market size and forecast 2025-2030

Chart on France - Market size and forecast 2025-2030 ($ million)
Data Table on France - Market size and forecast 2025-2030 ($ million)
Chart on France - Year-over-year growth 2025-2030 (%)
Data Table on France - Year-over-year growth 2025-2030 (%)

12.4.3 Italy - Market size and forecast 2025-2030

Chart on Italy - Market size and forecast 2025-2030 ($ million)
Data Table on Italy - Market size and forecast 2025-2030 ($ million)
Chart on Italy - Year-over-year growth 2025-2030 (%)
Data Table on Italy - Year-over-year growth 2025-2030 (%)

12.4.4 The Netherlands - Market size and forecast 2025-2030

Chart on The Netherlands - Market size and forecast 2025-2030 ($ million)
Data Table on The Netherlands - Market size and forecast 2025-2030 ($ million)
Chart on The Netherlands - Year-over-year growth 2025-2030 (%)
Data Table on The Netherlands - Year-over-year growth 2025-2030 (%)

12.4.5 UK - Market size and forecast 2025-2030

Chart on UK - Market size and forecast 2025-2030 ($ million)
Data Table on UK - Market size and forecast 2025-2030 ($ million)
Chart on UK - Year-over-year growth 2025-2030 (%)
Data Table on UK - Year-over-year growth 2025-2030 (%)

12.4.6 Spain - Market size and forecast 2025-2030

Chart on Spain - Market size and forecast 2025-2030 ($ million)
Data Table on Spain - Market size and forecast 2025-2030 ($ million)
Chart on Spain - Year-over-year growth 2025-2030 (%)
Data Table on Spain - Year-over-year growth 2025-2030 (%)

12.5 APAC - Market size and forecast 2025-2030

Chart on APAC - Market size and forecast 2025-2030 ($ million)
Data Table on APAC - Market size and forecast 2025-2030 ($ million)
Chart on APAC - Year-over-year growth 2025-2030 (%)
Data Table on APAC - Year-over-year growth 2025-2030 (%)
Chart on Regional Comparison - APAC
Data Table on Regional Comparison - APAC

12.5.1 Japan - Market size and forecast 2025-2030

Chart on Japan - Market size and forecast 2025-2030 ($ million)
Data Table on Japan - Market size and forecast 2025-2030 ($ million)
Chart on Japan - Year-over-year growth 2025-2030 (%)
Data Table on Japan - Year-over-year growth 2025-2030 (%)

12.5.2 Australia - Market size and forecast 2025-2030

Chart on Australia - Market size and forecast 2025-2030 ($ million)
Data Table on Australia - Market size and forecast 2025-2030 ($ million)
Chart on Australia - Year-over-year growth 2025-2030 (%)
Data Table on Australia - Year-over-year growth 2025-2030 (%)

12.5.3 China - Market size and forecast 2025-2030

Chart on China - Market size and forecast 2025-2030 ($ million)
Data Table on China - Market size and forecast 2025-2030 ($ million)
Chart on China - Year-over-year growth 2025-2030 (%)
Data Table on China - Year-over-year growth 2025-2030 (%)

12.5.4 South Korea - Market size and forecast 2025-2030

Chart on South Korea - Market size and forecast 2025-2030 ($ million)
Data Table on South Korea - Market size and forecast 2025-2030 ($ million)
Chart on South Korea - Year-over-year growth 2025-2030 (%)
Data Table on South Korea - Year-over-year growth 2025-2030 (%)

12.5.5 India - Market size and forecast 2025-2030

Chart on India - Market size and forecast 2025-2030 ($ million)
Data Table on India - Market size and forecast 2025-2030 ($ million)
Chart on India - Year-over-year growth 2025-2030 (%)
Data Table on India - Year-over-year growth 2025-2030 (%)

12.5.6 Indonesia - Market size and forecast 2025-2030

Chart on Indonesia - Market size and forecast 2025-2030 ($ million)
Data Table on Indonesia - Market size and forecast 2025-2030 ($ million)
Chart on Indonesia - Year-over-year growth 2025-2030 (%)
Data Table on Indonesia - Year-over-year growth 2025-2030 (%)

12.6 Middle East and Africa - Market size and forecast 2025-2030

Chart on Middle East and Africa - Market size and forecast 2025-2030 ($ million)
Data Table on Middle East and Africa - Market size and forecast 2025-2030 ($ million)
Chart on Middle East and Africa - Year-over-year growth 2025-2030 (%)
Data Table on Middle East and Africa - Year-over-year growth 2025-2030 (%)
Chart on Regional Comparison - Middle East and Africa
Data Table on Regional Comparison - Middle East and Africa

12.6.1 UAE - Market size and forecast 2025-2030

Chart on UAE - Market size and forecast 2025-2030 ($ million)
Data Table on UAE - Market size and forecast 2025-2030 ($ million)
Chart on UAE - Year-over-year growth 2025-2030 (%)
Data Table on UAE - Year-over-year growth 2025-2030 (%)

12.6.2 South Africa - Market size and forecast 2025-2030

Chart on South Africa - Market size and forecast 2025-2030 ($ million)
Data Table on South Africa - Market size and forecast 2025-2030 ($ million)
Chart on South Africa - Year-over-year growth 2025-2030 (%)
Data Table on South Africa - Year-over-year growth 2025-2030 (%)

12.6.3 Saudi Arabia - Market size and forecast 2025-2030

Chart on Saudi Arabia - Market size and forecast 2025-2030 ($ million)
Data Table on Saudi Arabia - Market size and forecast 2025-2030 ($ million)
Chart on Saudi Arabia - Year-over-year growth 2025-2030 (%)
Data Table on Saudi Arabia - Year-over-year growth 2025-2030 (%)

12.6.4 Egypt - Market size and forecast 2025-2030

Chart on Egypt - Market size and forecast 2025-2030 ($ million)
Data Table on Egypt - Market size and forecast 2025-2030 ($ million)
Chart on Egypt - Year-over-year growth 2025-2030 (%)
Data Table on Egypt - Year-over-year growth 2025-2030 (%)

12.6.5 Nigeria - Market size and forecast 2025-2030

Chart on Nigeria - Market size and forecast 2025-2030 ($ million)
Data Table on Nigeria - Market size and forecast 2025-2030 ($ million)
Chart on Nigeria - Year-over-year growth 2025-2030 (%)
Data Table on Nigeria - Year-over-year growth 2025-2030 (%)

12.7 South America - Market size and forecast 2025-2030

Chart on South America - Market size and forecast 2025-2030 ($ million)
Data Table on South America - Market size and forecast 2025-2030 ($ million)
Chart on South America - Year-over-year growth 2025-2030 (%)
Data Table on South America - Year-over-year growth 2025-2030 (%)
Chart on Regional Comparison - South America
Data Table on Regional Comparison - South America

12.7.1 Brazil - Market size and forecast 2025-2030

Chart on Brazil - Market size and forecast 2025-2030 ($ million)
Data Table on Brazil - Market size and forecast 2025-2030 ($ million)
Chart on Brazil - Year-over-year growth 2025-2030 (%)
Data Table on Brazil - Year-over-year growth 2025-2030 (%)

12.7.2 Argentina - Market size and forecast 2025-2030

Chart on Argentina - Market size and forecast 2025-2030 ($ million)
Data Table on Argentina - Market size and forecast 2025-2030 ($ million)
Chart on Argentina - Year-over-year growth 2025-2030 (%)
Data Table on Argentina - Year-over-year growth 2025-2030 (%)

12.7.3 Colombia - Market size and forecast 2025-2030

Chart on Colombia - Market size and forecast 2025-2030 ($ million)
Data Table on Colombia - Market size and forecast 2025-2030 ($ million)
Chart on Colombia - Year-over-year growth 2025-2030 (%)
Data Table on Colombia - Year-over-year growth 2025-2030 (%)

12.8 Market opportunity by geography

Market opportunity by geography ($ million)
Data Tables on Market opportunity by geography ($ million)

13. Drivers, Challenges, and Opportunity

13.1 Market drivers

Rising consumer spending on premium recreational marine equipment
Growing popularity of personal watercraft ownership among urban consumers
Increasing adoption of rental and sharing models for water scooters

13.2 Market challenges

High degree of risks involved with water scooters and water sports
Lack of driving skills and proper training
Early discharge of battery and frequent fuel drainage

13.3 Impact of drivers and challenges

Impact of drivers and challenges in 2025 and 2030

13.4 Market opportunities

Increasing participation in water sporting activities and adventures
Development of technological advanced water scooters
Growth of water tourism industry

14. Competitive Landscape

14.1 Overview

14.2

Overview on criticality of inputs and factors of differentiation

14.3 Landscape disruption

Overview on factors of disruption

14.4 Industry risks

Impact of key risks on business

15. Competitive Analysis

15.1 Companies profiled

Companies covered

15.2 Company ranking index

15.3 Market positioning of companies

Matrix on companies position and classification

15.4 Bombardier Recreational Inc.

Bombardier Recreational Inc. - Overview
Bombardier Recreational Inc. - Business segments
Bombardier Recreational Inc. - Key offerings
Bombardier Recreational Inc. - Segment focus
SWOT

15.5 Bonex GmbH and Co. KG

Bonex GmbH and Co. KG - Overview
Bonex GmbH and Co. KG - Product / Service
Bonex GmbH and Co. KG - Key offerings
SWOT

15.6 CAYAGO AG

CAYAGO AG - Overview
CAYAGO AG - Product / Service
CAYAGO AG - Key offerings
SWOT

15.7 Dive Xtras Inc.

Dive Xtras Inc. - Overview
Dive Xtras Inc. - Product / Service
Dive Xtras Inc. - Key offerings
SWOT

15.8 GAVIN Scooters GmbH

GAVIN Scooters GmbH - Overview
GAVIN Scooters GmbH - Product / Service
GAVIN Scooters GmbH - Key offerings
SWOT

15.9 iAqua

iAqua - Overview
iAqua - Product / Service
iAqua - Key offerings
SWOT

15.10 Kawasaki Heavy Industries Ltd.

Kawasaki Heavy Industries Ltd. - Overview
Kawasaki Heavy Industries Ltd. - Business segments
Kawasaki Heavy Industries Ltd. - Key news
Kawasaki Heavy Industries Ltd. - Key offerings
Kawasaki Heavy Industries Ltd. - Segment focus
SWOT

15.11 LEFEET HK CO., LIMITED

LEFEET HK CO., LIMITED - Overview
LEFEET HK CO., LIMITED - Product / Service
LEFEET HK CO., LIMITED - Key offerings
SWOT

15.12 Seacraft DPV

Seacraft DPV - Overview
Seacraft DPV - Product / Service
Seacraft DPV - Key offerings
SWOT

15.13 Sea-NXT Americas

Sea-NXT Americas - Overview
Sea-NXT Americas - Product / Service
Sea-NXT Americas - Key offerings
SWOT

15.14 SubGravity

SubGravity - Overview
SubGravity - Product / Service
SubGravity - Key offerings
SWOT

15.15 SUBLUE Underwater Ai Co. Ltd.

SUBLUE Underwater Ai Co. Ltd. - Overview
SUBLUE Underwater Ai Co. Ltd. - Product / Service
SUBLUE Underwater Ai Co. Ltd. - Key offerings
SWOT

15.16 Suex Srl

Suex Srl - Overview
Suex Srl - Product / Service
Suex Srl - Key offerings
SWOT

15.17 Waydoo

Waydoo - Overview
Waydoo - Product / Service
Waydoo - Key offerings
SWOT

15.18 Yamaha Motor Co. Ltd.

Yamaha Motor Co. Ltd. - Overview
Yamaha Motor Co. Ltd. - Business segments
Yamaha Motor Co. Ltd. - Key offerings
Yamaha Motor Co. Ltd. - Segment focus
SWOT

16. Appendix

16.1 Scope of the report

Market definition
Objectives
Notes and caveats

16.2 Inclusions and exclusions checklist

Inclusions checklist
Exclusions checklist

16.3 Currency conversion rates for US$

16.4 Research methodology

16.5 Data procurement

Information sources

16.6 Data validation

16.7 Validation techniques employed for market sizing

16.8 Data synthesis

16.9 360 degree market analysis

16.10 List of abbreviations

Research Methodology

Technavio presents a detailed picture of the market by way of study, synthesis, and summation of data from multiple sources. The analysts have presented the various facets of the market with a particular focus on identifying the key industry influencers. The data thus presented is comprehensive, reliable, and the result of extensive research, both primary and secondary.

INFORMATION SOURCES

Primary sources

  • Manufacturers and suppliers
  • Channel partners
  • Industry experts
  • Strategic decision makers

Secondary sources

  • Industry journals and periodicals
  • Government data
  • Financial reports of key industry players
  • Historical data
  • Press releases

DATA ANALYSIS

Data Synthesis

  • Collation of data
  • Estimation of key figures
  • Analysis of derived insights

Data Validation

  • Triangulation with data models
  • Reference against proprietary databases
  • Corroboration with industry experts

REPORT WRITING

Qualitative

  • Market drivers
  • Market challenges
  • Market trends
  • Five forces analysis

Quantitative

  • Market size and forecast
  • Market segmentation
  • Geographical insights
  • Competitive landscape

Interested in this report?

Get your sample now to see our research methodology and insights!

Download Now

Frequently Asked Questions

Water Scooter market growth will increase by USD 1384.0 million during 2026-2030.

The Water Scooter market is expected to grow at a CAGR of 5.9% during 2026-2030.

Water Scooter market is segmented by Type (Abovewater, Underwater) Propulsion (Fuel operated, Battery operated) Application (Commercial, Military, Personal)

Asiwo Sports, Bombardier Recreational Inc., Bonex GmbH and Co. KG, CAYAGO AG, Dive Xtras Inc., Divertug, GAVIN Scooters GmbH, iAqua, Kawasaki Heavy Industries Ltd., LEFEET HK CO., LIMITED, Nellis Engineering Inc., Seacraft DPV, Sea-NXT Americas, SubGravity, SUBLUE Underwater Ai Co. Ltd., Suex Srl, Waydoo, Yamaha Motor Co. Ltd. are a few of the key vendors in the Water Scooter market.

North America will register the highest growth rate of 49.8% among the other regions. Therefore, the Water Scooter market in North America is expected to garner significant business opportunities for the vendors during the forecast period.

US, Canada, Mexico, Germany, France, Italy, The Netherlands, UK, Spain, Japan, Australia, China, South Korea, India, Indonesia, UAE, South Africa, Saudi Arabia, Egypt, Nigeria, Brazil, Argentina, Colombia

  • Rising consumer spending on premium recreational marine equipment is the driving factor this market.

The Water Scooter market vendors should focus on grabbing business opportunities from the Type segment as it accounted for the largest market share in the base year.
RIA - Research AI Assistant
Ask RIA