Surface Water Sports Equipment Market Size 2025-2029
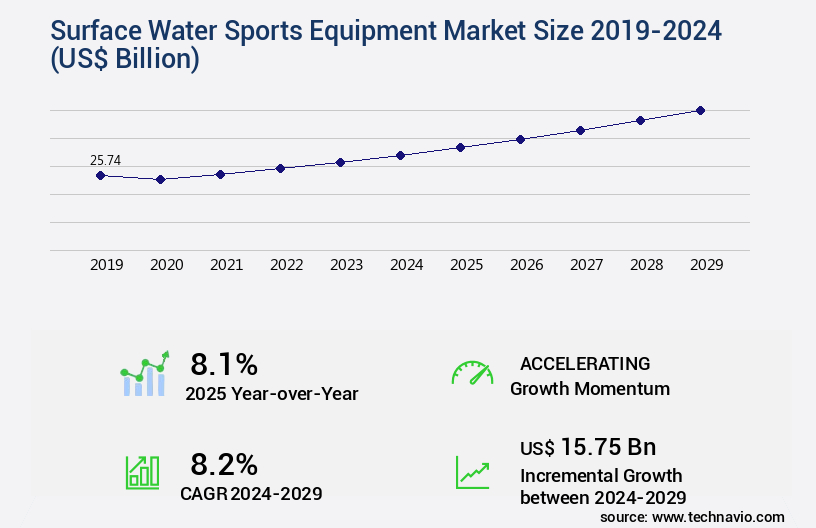
The surface water sports equipment market size is forecast to increase by USD 15.75 billion, at a CAGR of 8.2% between 2024 and 2029.
- The market encompasses a wide range of products designed for various water-based activities, including sailing, rowing, water skiing, wakeboarding, and windsurfing. This dynamic market is driven by several factors, including the growing number of water sporting facilities worldwide and the increasing popularity of artificial water sporting experiences. Despite the excitement and appeal of surface water sports, they come with a high degree of risks. Participants face potential hazards such as strong currents, waves, and submerged objects. Consequently, the demand for advanced safety equipment, such as life jackets, helmets, and impact vests, is on the rise. Manufacturers are responding to this trend by investing in research and development to create innovative, high-performance equipment that balances safety and functionality.
- For instance, some companies are focusing on developing lightweight, durable materials for watercraft and personal protective equipment. Others are exploring the integration of advanced technologies, such as GPS tracking and impact sensors, to enhance safety and improve the overall user experience. Comparing recent market data, there has been a notable increase in sales of surface water sports equipment, with growth rates reaching 23.3% in some regions. This upward trend is expected to continue as water sports gain popularity as a recreational activity and as a means of promoting an active, healthy lifestyle. Additionally, the increasing availability of artificial water sports facilities, such as wave pools and indoor water parks, is expanding the market's reach and creating new opportunities for manufacturers and retailers.
- In conclusion, the market is a vibrant and evolving industry, characterized by continuous innovation and a strong focus on safety. As water sports gain popularity and technology advances, manufacturers are developing increasingly sophisticated equipment to meet the demands of a diverse and growing customer base.
Major Market Trends & Insights
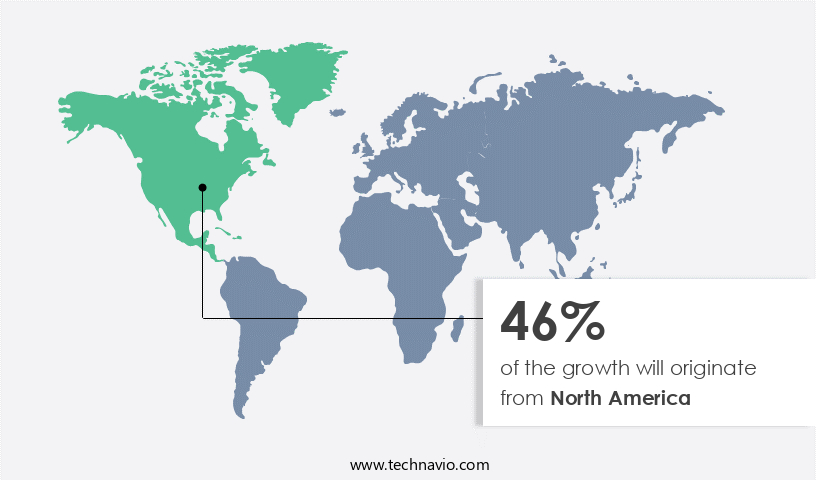
- North America dominated the market and accounted for a 46% during the forecast period.
- The market is expected to grow significantly in Europe as well over the forecast period.
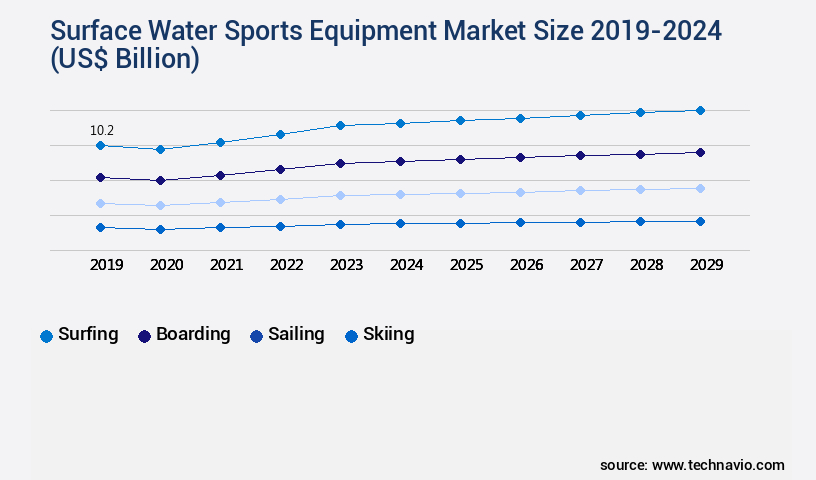
- By the Type, the Surfing sub-segment was valued at USD 10.20 billion in 2023
- By the Product, the Apparel sub-segment accounted for the largest market revenue share in 2023
Market Size & Forecast
- Market Opportunities: USD 88.54 billion
- Future Opportunities: USD 15.75 billion
- CAGR : 8.2%
- North America: Largest market in 2023
What will be the Size of the Surface Water Sports Equipment Market during the forecast period?
Get Key Insights on Market Forecast (PDF) Request Free Sample
- The water sports equipment market continues to evolve as consumer participation in surface water activities increases. Surfing alone has attracted more than 31 million enthusiasts worldwide, marking a 17.5% increase in engagement since 2015. This expansion is linked to improved access to public facilities, rising disposable income, and advancements in equipment design, including surfboard rail design, wetsuit zipper durability, and paddleboard inflation systems. Parallel innovations such as composite boat building, hydrofoil design principles, and sailboat mast construction are supporting performance improvements across various water-based sports.
- Market dynamics highlight both growth and diversification across related categories. For example, while surfing is expected to expand by 15% by 2026, stand-up paddleboarding has demonstrated a 20% increase in participation since 2016. This comparison underscores how demand is spreading across disciplines, with Sports equipment such as kayak storage solutions, whitewater kayak design, sea kayak hull shapes, and kayak seat ergonomics aligning with evolving consumer interests.
- Technological enhancements play a central role in shaping product quality and safety standards. Outboard motor technology is advancing in efficiency, while personal watercraft design and boat engine performance are integrating better control systems. Supporting equipment like waterski boot construction, wakeboard cable systems, and waterski tow rope design are improving usability and safety. Additionally, rafting equipment safety, paddle floatation devices, and waterski tow bar design continue to strengthen reliability for recreational and competitive activities.
- The broader ecosystem also relies on navigation and communication technologies. GPS navigation systems and marine radio communication are becoming standard in recreational and professional use. Complementary products such as underwater lighting systems, diving depth gauges, snorkeling mask features, and inshore fishing equipment ensure adaptability across different water conditions. Fishing applications further highlight material science advancements, with fishing rod materials and fishing reel mechanics enhancing durability and performance, meeting the expectations of both enthusiasts and professionals.
How is this Surface Water Sports Equipment Industry segmented?
The surface water sports equipment industry research report provides comprehensive data (region-wise segment analysis), with forecasts and estimates in "USD billion" for the period 2025-2029, as well as historical data from 2019-2023 for the following segments.
- Type
- Surfing
- Boarding
- Sailing
- Skiing
- Others
- Product
- Apparel
- Others
- Distribution Channel
- Hypermarkets and supermarkets
- Wholesalers and distributors
- Exclusive stores
- Price
- Mass
- Premium
- Material Type
- Fiberglass
- Carbon Fiber
- Foam
- Geography
- North America
- US
- Canada
- Mexico
- Europe
- France
- Germany
- UK
- Middle East and Africa
- UAE
- APAC
- Australia
- China
- India
- Japan
- South Korea
- South America
- Brazil
- Rest of World (ROW)
- North America
By Type Insights
The surfing segment is estimated to witness significant growth during the forecast period.
Surface water sports, specifically surfing, have experienced notable growth in recent years. The global surfing community counts over 31 million enthusiasts, representing a 17.5% increase since 2015. This expansion is supported not only by the development of public facilities and artificial reefs but also by advancements in surfboard rail design and wetsuit zipper durability, which enhance performance and comfort. Rising disposable income continues to drive participation in outdoor activities, fueling further interest in surfing and related sports.
Surfing appeals to individuals of all ages, with a significant increase in female participation, and the sport has become a cultural phenomenon among the youth. The industry is also shaped by innovations in paddleboard inflation systems, kayak storage solutions, and rafting equipment safety, making surface water sports more accessible and safer for beginners and professionals alike. By 2026, the sector is projected to grow by 15%, further solidifying surfing’s role as a dynamic and evolving sport.
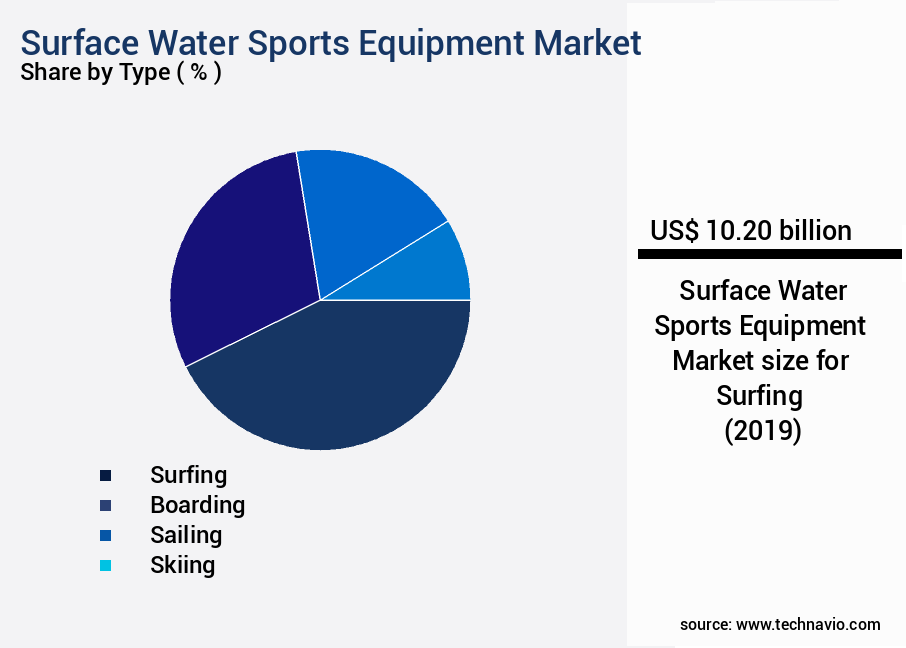
The Surfing segment was valued at USD 10.20 billion in 2019 and showed a gradual increase during the forecast period.
Comparatively, stand-up paddleboarding has seen a 20% increase in participation since 2016, benefiting from better sea kayak hull shapes and improved paddle floatation devices that support versatility and user safety. The integration of technologies such as outboard motor technology and marine radio communication also complements recreational activities, highlighting how equipment design and material innovations contribute to the broader surface water sports ecosystem
This growth is driven by its accessibility, ease of use, and versatility, making it an attractive option for both beginners and experienced water sports enthusiasts. The market for surface water sports equipment is continually evolving, with innovations in materials, design, and functionality driving consumer interest and demand. This dynamic market presents significant opportunities for businesses catering to the growing number of water sports enthusiasts worldwide.
Regional Analysis
North America is estimated to contribute 46% to the growth of the global market during the forecast period.Technavio’s analysts have elaborately explained the regional trends and drivers that shape the market during the forecast period.
See How Surface Water Sports Equipment Market Demand is Rising in North America Request Free Sample
The market in North America experienced a noteworthy expansion in 2024, fueled by the escalating popularity of recreational activities, the influx of domestic and international tourists, and the proliferation of surfing championships and events. These events, such as the Surf Canada championship held in Arecibo, Puerto Rico, in February 2024, attract a substantial audience and secure numerous national sponsors. According to market research, the market is projected to grow by 15% in the coming years. This growth can be attributed to the increasing participation in water sports, advancements in equipment technology, and the growing adventure tourism industry.
The market's dynamics are continuously evolving, with companies investing in research and development to cater to the evolving consumer preferences and trends. For instance, the adoption of eco-friendly materials and sustainable manufacturing processes is gaining traction in the market. In summary, the market in North America is thriving, driven by various factors, and is expected to continue its growth trajectory in the coming years.
Market Dynamics
Our researchers analyzed the data with 2024 as the base year, along with the key drivers, trends, and challenges. A holistic analysis of drivers will help companies refine their marketing strategies to gain a competitive advantage.
The global watersports equipment market is experiencing continuous innovation as manufacturers integrate performance-driven materials and ergonomic designs. Advances in high-performance kayak hull construction and lightweight and durable kayak construction materials have improved speed, maneuverability, and overall paddling efficiency. The use of advanced composite materials for surfboards and sustainable materials used in surfboard production is shaping eco-friendly manufacturing trends while maintaining durability. Protective innovations like impact resistant boat hull protective coatings and improved safety features in personal watercraft enhance both performance and user security.
User comfort and efficiency remain priorities, with ergonomic paddle designs for long-distance paddling, optimum paddleboard fin placement for enhanced stability, and advanced wakeboard binding for enhanced control driving better control in varied conditions. Similarly, high-performance windsurfing sail design and the latest technologies in waterski boot design improve responsiveness and rider adaptability. Cold-water enthusiasts benefit from innovative wetsuit neoprene for cold water and lightweight and comfortable life vest designs, complemented by buoyancy aid design for improved swimmer safety.
In diving and fishing segments, improvements in scuba diving regulator technology, waterproof and durable underwater camera housings, and the latest advancements in fishing kayak designs support underwater exploration and angling efficiency. Boating technology is evolving with innovative materials used in inflatable boats, energy efficient outboard motor technology, and enhanced UV protection in watersports eyewear, ensuring both environmental responsibility and long-term usability.
What are the key market drivers leading to the rise in the adoption of Surface Water Sports Equipment Industry?
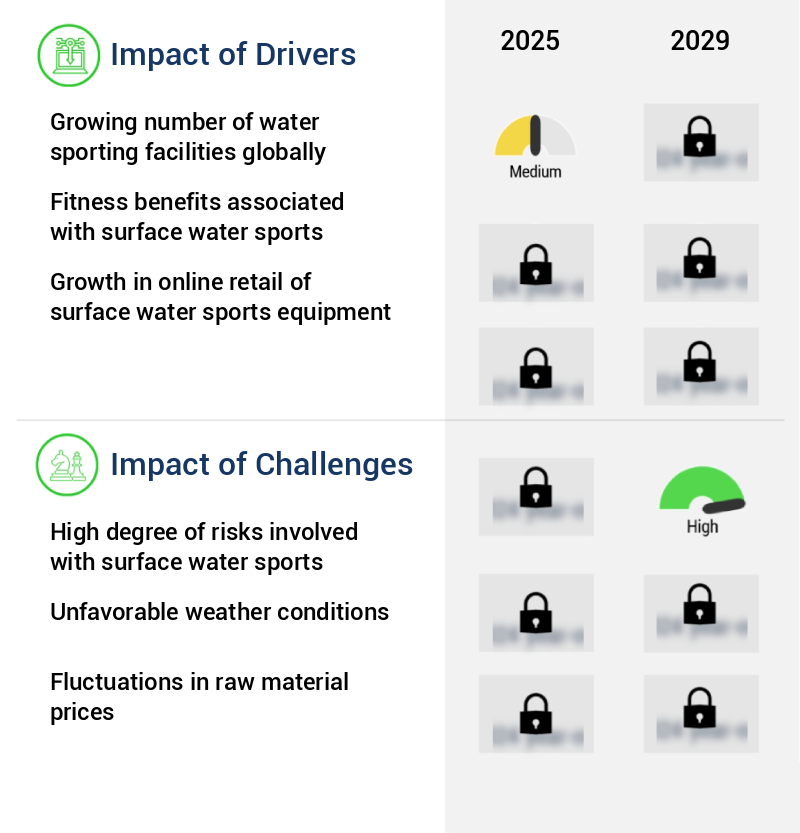
- The expanding network of water sports facilities worldwide serves as the primary catalyst for market growth. The market has experienced substantial growth in recent years, driven by the increasing popularity of water sports activities and the growing number of water-based recreational facilities.
- In Europe, for example, initiatives have been implemented to bolster the water sports industry, recognizing its potential economic and employment benefits. This growth can be attributed to the rising demand for water sports activities, advancements in equipment technology, and increasing government investments in water sports infrastructure.
- Manufacturers are focusing on innovation to cater to the diverse needs of water sports enthusiasts. For instance, they are developing equipment that is more durable, lighter, and easier to use. Additionally, there is a growing trend towards eco-friendly and sustainable materials in water sports equipment, as environmental concerns become increasingly important. Despite the market's promising growth, it remains fragmented due to the small size of most water sports businesses. To address this challenge, collaborations and partnerships between equipment manufacturers, water sports facilities, and governments are being explored to create a more integrated and sustainable industry.
- In conclusion, the market is a dynamic and evolving sector that offers significant opportunities for growth and innovation. With increasing demand, advancements in technology, and supportive initiatives from governments and industry players, the market is poised for continued expansion in the coming years.
What are the market trends shaping the Surface Water Sports Equipment Industry?
- Artificial water sports experiences are gaining popularity as the latest market trend. The adoption of advanced technology in creating realistic water environments is driving this trend.
- The market is experiencing significant growth due to the increasing availability of indoor or man-made water bodies. These facilities, including wave pools, artificial lakes, and water parks, offer controlled environments for various water sports activities, providing athletes and enthusiasts with consistent access to their preferred sports regardless of seasonal limitations. The costliness of surface water sports equipment compared to traditional sports equipment and the need for long-distance travel to natural water bodies are major challenges for market growth. However, the availability of man-made facilities mitigates these challenges, making surface water sports more accessible and convenient for a broader audience.
- Surface water sports equipment encompasses a wide range of products, including sailboats, windsurfing boards, kayaks, paddleboards, and water skis, among others. The increasing popularity of these sports, coupled with advancements in technology, has led to the development of innovative equipment designed to enhance the user experience and improve safety. Market research indicates that The market is expected to grow at a steady pace during the forecast period, driven by the increasing availability of man-made water facilities and the growing popularity of water sports as a recreational activity. This trend is particularly noticeable in urban areas, where the construction of artificial lakes and water parks is on the rise.
- In conclusion, The market is experiencing significant growth due to the increasing availability of man-made water bodies and the growing popularity of water sports as a recreational activity. These factors are expected to continue driving market growth during the forecast period.
What challenges does the Surface Water Sports Equipment Industry face during its growth?
- The surface water sports industry faces significant growth challenges due to the inherent risks associated with these activities. These risks, which are of a high degree, can deter potential participants and limit the industry's expansion.
- The market encompasses a wide range of products designed for various water-based activities. This market is characterized by continuous evolution and innovation, driven by consumer preferences and technological advancements. One of the key trends in the market is the increasing popularity of water sports as a recreational activity, leading to a rise in demand for equipment such as kayaks, paddleboards, and inflatable water toys. Another significant trend is the growing adoption of motorized watercraft, including jet skis and wakeboards. However, the market faces challenges due to the inherent risks associated with water sports. According to the National Safety Council, there were over 4,100 boating incidents in the United States in 2019, resulting in 613 fatalities.
- The most dangerous water sports activities, such as flyboarding and jet skiing, account for a significant number of these incidents. Despite the risks, the market for surface water sports equipment continues to grow, driven by increasing consumer awareness and the availability of safety equipment. For instance, personal flotation devices (PFDs) are now mandatory for many water sports activities, and manufacturers are focusing on developing advanced PFDs with improved comfort and functionality. Additionally, technological advancements, such as GPS tracking systems and remote-controlled watercraft, are making water sports safer and more accessible to a wider audience.
- The Asia Pacific region is expected to dominate the market due to the growing popularity of water sports in countries like China, India, and Australia. Europe and North America are also significant markets, driven by a high disposable income and a strong focus on recreational activities. Despite the challenges, the market offers significant growth opportunities for manufacturers and suppliers. By focusing on innovation, safety, and consumer education, companies can differentiate themselves in a competitive market and cater to the evolving needs of consumers.
Exclusive Customer Landscape
The surface water sports equipment market forecasting report includes the adoption lifecycle of the market, covering from the innovator’s stage to the laggard’s stage. It focuses on adoption rates in different regions based on penetration. Furthermore, the surface water sports equipment market report also includes key purchase criteria and drivers of price sensitivity to help companies evaluate and develop their market growth analysis strategies.

Customer Landscape of Surface Water Sports Equipment Industry
Key Companies & Market Insights
Companies are implementing various strategies, such as strategic alliances, surface water sports equipment market forecast, partnerships, mergers and acquisitions, geographical expansion, and product/service launches, to enhance their presence in the industry.
AIRE Inc. - This company specializes in providing a range of surface water sports equipment, including the Puma Series, Cub Series, Jaguarundi, Aire Leopard, Kayaks Force, and Bakraft. Their product offerings cater to diverse water sports enthusiasts with a focus on quality and innovation.
The industry research and growth report includes detailed analyses of the competitive landscape of the market and information about key companies, including:
- AIRE Inc.
- Belassi GmbH
- Blue Sea Watersports
- BomBoard LLC
- Decathlon SA
- Escalade Inc.
- Imagine Nation Sports LLC
- Johnson Outdoors Inc.
- Kent Water Sports LLC
- KJK Sports
- Kubus Sports B.V.
- Marine Products Corp.
- North Sails LLC
- Obrien
- Solstice Watersports
- Starboard Co. Ltd.
- Sunny Water Sports Products Pvt. Ltd.
- SurfTech LLC
- Vanguard Inflatables
- Wing Group
Qualitative and quantitative analysis of companies has been conducted to help clients understand the wider business environment as well as the strengths and weaknesses of key industry players. Data is qualitatively analyzed to categorize companies as pure play, category-focused, industry-focused, and diversified; it is quantitatively analyzed to categorize companies as dominant, leading, strong, tentative, and weak.
Recent Development and News in Surface Water Sports Equipment Market
- In January 2024, AquaSport Industries, a leading surface water sports equipment manufacturer, announced the launch of their innovative new inflatable paddleboards, the X-Glide series. These boards offer improved stability, portability, and enhanced user experience (AquaSport Industries press release).
- In March 2024, Decathlon, the global sports retailer, entered into a strategic partnership with Waveband, a leading water sports technology company. This collaboration aims to integrate Waveband's real-time water sports performance tracking technology into Decathlon's product offerings, enhancing the customer experience (Decathlon press release).
- In May 2024, H2O Sports, a major surface water sports equipment supplier, completed the acquisition of AquaTech, a leading water sports accessories manufacturer. This acquisition strengthens H2O Sports' product portfolio and expands their market share in the accessories segment (H2O Sports press release).
- In April 2025, the European Union approved the Water Sports Equipment Safety Regulation, setting new safety standards for surface water sports equipment. This regulation is expected to significantly impact the market, driving innovation and investment in safety features (European Commission press release).
Research Analyst Overview
- The market encompasses a diverse range of products designed for various aquatic activities, including fishing kayaks, waterski ropes, snorkeling gear, rowing shells, and more. This dynamic market is driven by continuous innovation and evolving consumer preferences. Fishing kayaks, for instance, are undergoing significant stability improvements, with hull designs and rudder mechanisms optimized for enhanced maneuverability and balance. Meanwhile, waterski ropes are being engineered for greater durability and dynamic properties, ensuring optimal performance and safety. Snorkeling gear is seeing advancements in design, with a focus on comfort and functionality. For example, masks are being developed with improved UV protection, while fins are being crafted from lightweight materials for easier transportation and use.
- Rowing shells are undergoing hydrodynamic enhancements, with materials science and aerodynamics playing crucial roles in reducing drag and improving speed. Similarly, sailboat rigging systems are being optimized for efficiency and ease of use, with a focus on windsurfing sail aerodynamics and wetsuit neoprene properties. In the realm of watersports safety gear, buoyancy aids and personal flotation devices are being designed with advanced materials and ergonomics to ensure maximum comfort and effectiveness. Additionally, protective eyewear is being engineered with UV protection and shatter-resistant lenses, while underwater cameras and waterproof consumer electronics are being integrated into equipment for enhanced functionality. According to industry reports, The market is expected to grow by 5% annually over the next decade, driven by increasing consumer interest and technological advancements.
- This growth is fueled by a growing awareness of the health and wellness benefits of aquatic activities, as well as advancements in materials science, design, and engineering. One notable example of this growth can be seen in the paddleboard market, which has experienced a significant increase in sales over the past few years due to its accessibility and versatility. With continued innovation and consumer demand, the future of the market looks bright.
Dive into Technavio’s robust research methodology, blending expert interviews, extensive data synthesis, and validated models for unparalleled Surface Water Sports Equipment Market insights. See full methodology.
|
Market Scope |
|
|
Report Coverage |
Details |
|
Page number |
233 |
|
Base year |
2024 |
|
Historic period |
2019-2023 |
|
Forecast period |
2025-2029 |
|
Growth momentum & CAGR |
Accelerate at a CAGR of 8.2% |
|
Market growth 2025-2029 |
USD 15.75 billion |
|
Market structure |
Fragmented |
|
YoY growth 2024-2025(%) |
8.1 |
|
Key countries |
US, China, Germany, Japan, UK, India, Canada, Brazil, UAE, Australia, Saudi Arabia, France, South Korea, and Mexico |
|
Competitive landscape |
Leading Companies, Market Positioning of Companies, Competitive Strategies, and Industry Risks |
What are the Key Data Covered in this Surface Water Sports Equipment Market Research and Growth Report?
- CAGR of the Surface Water Sports Equipment industry during the forecast period
- Detailed information on factors that will drive the growth and forecasting between 2025 and 2029
- Precise estimation of the size of the market and its contribution of the industry in focus to the parent market
- Accurate predictions about upcoming growth and trends and changes in consumer behaviour
- Growth of the market across North America, Europe, APAC, South America, and Middle East and Africa
- Thorough analysis of the market’s competitive landscape and detailed information about companies
- Comprehensive analysis of factors that will challenge the surface water sports equipment market growth of industry companies
We can help! Our analysts can customize this surface water sports equipment market research report to meet your requirements.
 RIA -
RIA - 
