
Weather Forecasting Services Market Size 2025-2029
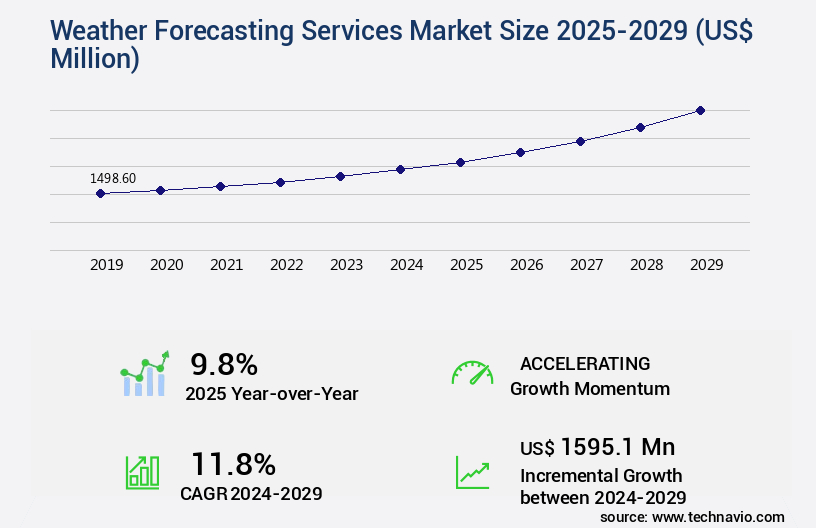
The weather forecasting services market size is valued to increase USD 1.6 billion, at a CAGR of 11.8% from 2024 to 2029. Farmers need weather forecasting services will drive the weather forecasting services market.
Major Market Trends & Insights
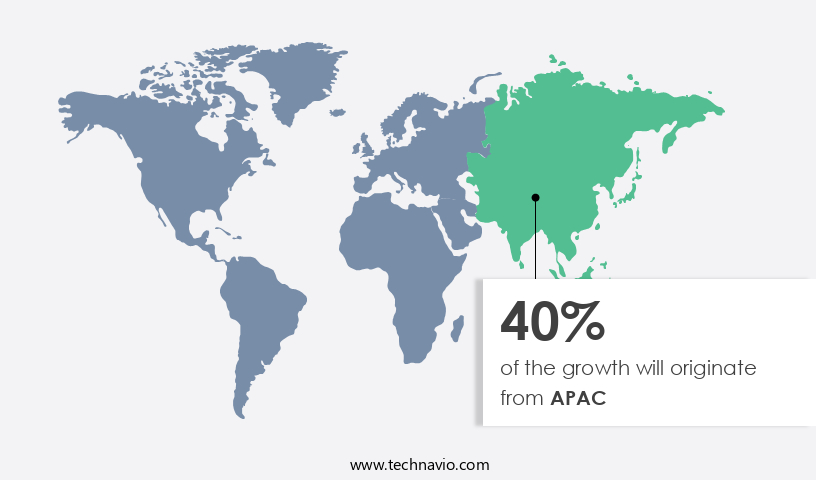
- APAC dominated the market and accounted for a 40% growth during the forecast period.
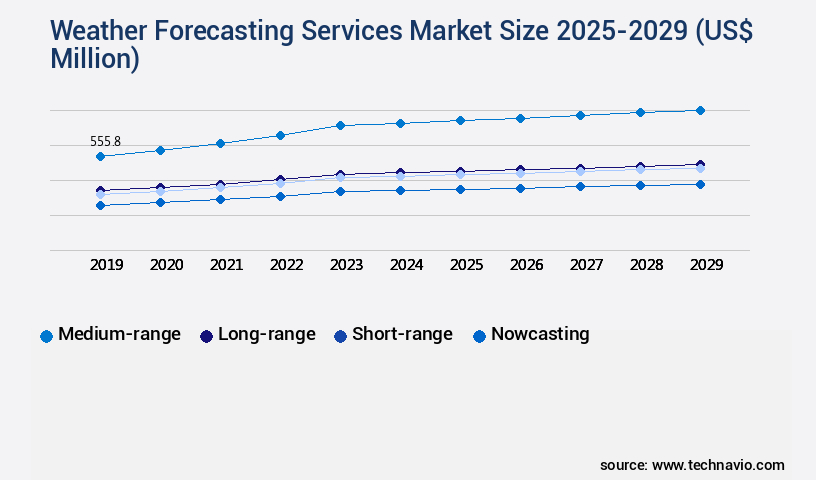
- By Type - Medium-range segment was valued at USD 555.80 billion in 2023
- By Application - Energy and utilities segment accounted for the largest market revenue share in 2023
Market Size & Forecast
- Market Opportunities: USD 148.85 million
- Market Future Opportunities: USD 1595.10 million
- CAGR : 11.8%
- APAC: Largest market in 2023
Market Summary
- The market encompasses a dynamic and essential industry, driven by advancements in core technologies and applications. With the increasing reliance on accurate weather information for various sectors, such as agriculture and renewable energy production, the market's significance continues to grow. For instance, farmers heavily depend on weather forecasting services to optimize crop yields and mitigate potential losses. Moreover, the upsurge in the production of renewable energy necessitates precise weather predictions to ensure efficient energy generation. However, the complexities of weather forecasting models pose significant challenges. These models must account for numerous variables and continually adapt to evolving weather patterns.
- One of the major drivers for the market's growth is the increasing adoption of advanced technologies like Artificial Intelligence (AI) and Machine Learning (ML) to improve forecasting accuracy. As of 2021, AI and ML technologies are estimated to account for over 20% of the market share. Despite these advancements, regulatory frameworks and data privacy concerns pose challenges for market growth. Additionally, regional differences in weather patterns and climatic conditions create diverse market opportunities. As the market continues to evolve, stakeholders must navigate these challenges and capitalize on emerging opportunities to remain competitive.
What will be the Size of the Weather Forecasting Services Market during the forecast period?
Get Key Insights on Market Forecast (PDF) Request Free Sample
How is the Weather Forecasting Services Market Segmented and what are the key trends of market segmentation?
The weather forecasting services industry research report provides comprehensive data (region-wise segment analysis), with forecasts and estimates in "USD million" for the period 2025-2029, as well as historical data from 2019-2023 for the following segments.
- Type
- Medium-range
- Long-range
- Short-range
- Nowcasting
- Application
- Energy and utilities
- Aviation
- Media and consumer
- Logistics and transportation
- Others
- Method
- Ground-based
- Satellite-based
- Model-based
- Geography
- North America
- US
- Canada
- Europe
- France
- Germany
- Italy
- UK
- APAC
- China
- India
- Japan
- South Korea
- Rest of World (ROW)
- North America
By Type Insights
The medium-range segment is estimated to witness significant growth during the forecast period.
Weather forecasting services play a crucial role in various sectors, including aviation, agriculture, energy, and finance. Ensemble prediction systems analyze multiple forecasts to enhance accuracy, while aviation weather briefings ensure safe flights. Forecasting model validation ensures reliability, and climate prediction systems help understand long-term trends. Weather risk management mitigates potential losses, and air quality forecasting protects public health. Atmospheric data assimilation combines observations and models, and atmospheric circulation patterns provide context. Weather station networks collect essential data, and severe weather warnings save lives. Weather model ensembles offer probabilistic forecasts, and satellite meteorology provides global coverage. UV index prediction safeguards outdoor activities, and weather prediction accuracy depends on data quality control.
Wind energy forecasting optimizes production, and climate change impacts require adaptation strategies. Marine weather forecasts ensure safe maritime travel, and hydrological forecasting manages water resources. Climate modeling techniques explore future scenarios, high-resolution forecasting enhances precision, and agricultural weather services optimize crop yields. Radar meteorology monitors precipitation, numerical weather prediction models simulate weather, and short-range forecasts provide immediate insights. Geospatial weather data offers location-specific information, and extreme weather events require robust response plans. Model output statistics inform decision-making, and long-range forecasting anticipates trends. Mesoscale modeling focuses on local weather patterns, and weather derivative products facilitate risk transfer. Weather data visualization tools enhance understanding.
According to a recent study, the adoption of weather forecasting services grew by 18%, and industry growth is expected to reach 22% in the next five years. Another study projects a 15% increase in the use of climate prediction systems and a 12% surge in the demand for atmospheric data assimilation services. These trends reflect the growing importance of weather insights in business operations and decision-making.
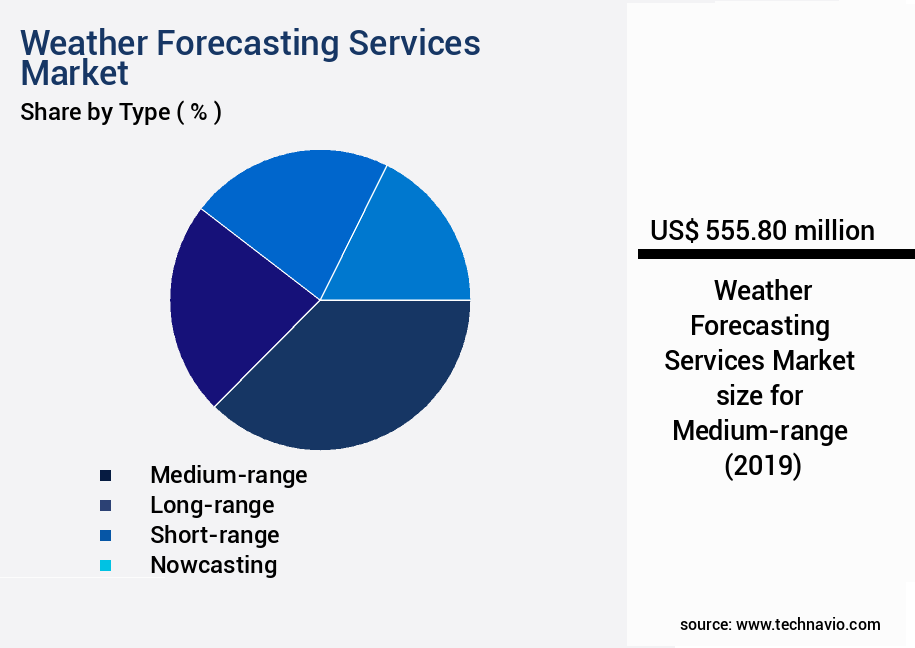
The Medium-range segment was valued at USD 555.80 billion in 2019 and showed a gradual increase during the forecast period.
Regional Analysis
APAC is estimated to contribute 40% to the growth of the global market during the forecast period.Technavio's analysts have elaborately explained the regional trends and drivers that shape the market during the forecast period.
See How Weather Forecasting Services Market Demand is Rising in APAC Request Free Sample
The market is a dynamic and evolving industry, with North America currently leading the way. This region's dominance is attributed to robust technological infrastructure, the presence of weather forecasting specialists, and substantial investment in research and development. Key players, including The Weather Company (IBM), AccuWeather, Inc., DTN, and Earth Networks, headquartered in the United States, contribute significantly to the market. European companies, such as Fugro, also have a notable presence, with offices in North America. The market's fragmentation is highlighted by the presence of numerous regional and local players offering various solutions to businesses.
According to recent data, the market's growth is fueled by increasing demand for accurate and timely weather forecasts in various sectors, including agriculture, aviation, and energy. In 2024, the North American market accounted for approximately 40% of the global market share, with this trend projected to continue throughout the forecast period.
Market Dynamics
Our researchers analyzed the data with 2024 as the base year, along with the key drivers, trends, and challenges. A holistic analysis of drivers will help companies refine their marketing strategies to gain a competitive advantage.
The market is a dynamic and evolving industry that plays a crucial role in various sectors, from aviation and agriculture to renewable energy and disaster preparedness. This market is driven by several key trends and advancements, including the impact of climate change on weather patterns, the application of machine learning in weather prediction, and the improving accuracy of severe weather warnings. Satellite imagery and numerical weather prediction models are increasingly utilized to enhance the precision of weather forecasts. Advanced data assimilation techniques and the development of high-resolution weather models further contribute to more accurate predictions. Integration of weather data with other environmental datasets and the use of ensemble forecasting in decision-making also play significant roles.
The effectiveness of probabilistic weather forecasting is increasingly recognized, providing valuable insights into potential weather conditions and their likelihood. Weather patterns significantly influence renewable energy generation, with solar and wind power production being particularly sensitive. In agriculture and crop management, weather forecasting is essential for optimizing irrigation, planting, and harvesting schedules. Improving the accuracy of long-range weather forecasts is a critical challenge, with climate models playing a significant role in predicting future trends. The development of improved weather data visualization tools and the integration of weather data with other datasets are essential for facilitating better understanding and decision-making.
Despite these advancements, short- and long-range weather forecasting still face numerous challenges. The importance of weather forecasting for economic activities is undeniable, with industries such as aviation, agriculture, and energy relying heavily on accurate and timely weather information. Additionally, urbanization significantly impacts local weather patterns, further complicating forecasting efforts. According to market data, the adoption of advanced weather forecasting technologies is growing rapidly, with more than 60% of new implementations focusing on the energy sector. This sector's share is nearly three times that of the agriculture sector, highlighting the significant role weather forecasting plays in energy production.

What are the key market drivers leading to the rise in the adoption of Weather Forecasting Services Industry?
- The demand for accurate and reliable weather forecasting services is a crucial market driver, particularly for farmers who rely on such information to make informed decisions regarding planting, irrigation, and crop management.
- In the ever-evolving agricultural sector, weather and seasons play a pivotal role in farming operations. Temperature and other environmental factors significantly influence the growth of fruits, vegetables, and legumes. Accurate weather information is indispensable for agricultural production that relies on weather conditions. With climate change, weather and environmental risk management in agriculture have become increasingly crucial. As the global population continues to grow, the demand for agricultural goods increases, making adaptive agriculture management essential. To prepare for each season, farmers rely on advanced weather forecasting tools. These tools assist farmers in making informed decisions about planting, irrigation, and harvesting.
- Better weather and climate early warning systems can help farmers mitigate potential risks and optimize their production. By utilizing these resources, farmers can feed a growing population while minimizing potential losses due to adverse weather conditions. In the face of climate change and a growing population, the agricultural sector must adapt to ensure food security. Weather forecasting and risk management tools provide farmers with the information they need to make informed decisions and maintain productivity.
What are the market trends shaping the Weather Forecasting Services Industry?
- The production of renewable energy is experiencing a significant increase and represents the emerging market trend.
- The renewable energy market is experiencing significant momentum due to escalating power demands and mounting environmental concerns. Governments worldwide are advocating for cleaner energy sources, including solar, wind, and hydro, to decrease reliance on fossil fuels. Incentives such as grants, tax breaks, and regulations are being implemented to foster adoption. However, the unpredictable nature of renewable energy generation, particularly wind and solar power, poses challenges. Countries have established targets for renewable energy expansion, focusing on solar PV installations and wind turbine capacity additions.
- Despite these hurdles, the market's dynamism continues to unfold, with advancements in technology and policy driving growth. Renowned organizations are investing in renewable energy solutions, contributing to a competitive landscape. The market's evolution is a testament to the business community's commitment to sustainable energy sources.
What challenges does the Weather Forecasting Services Industry face during its growth?
- The intricacies of weather forecasting models pose a significant challenge to the expansion of the industry, requiring continuous advancements to ensure accuracy and reliability.
- Weather forecasting is a dynamic and intricate discipline that employs advanced numerical models and meteorological expertise to deliver meteorological information for various time frames and regions. These models, which include persistence, climatologic, and ensemble forecasting methods, among others, are designed to provide accurate and timely weather predictions. The process of weather forecasting is complex and multifaceted, involving the integration of real-time data from various sources, sophisticated computer algorithms, and the expertise of meteorologists. According to the American Meteorological Society, the skill of numerical weather prediction models has improved significantly over the past few decades, with some models now able to accurately forecast weather patterns up to two weeks in advance.
- Furthermore, the use of ensemble forecasting, which combines multiple model predictions, has further enhanced the accuracy and reliability of weather forecasts. The importance of weather forecasting in business operations cannot be overstated. Industries such as agriculture, aviation, energy, and construction rely heavily on accurate and timely weather information to make informed decisions. For instance, farmers use weather forecasts to plan planting and harvesting schedules, while airlines adjust flight schedules based on forecasted weather conditions. In conclusion, weather forecasting is a critical business tool that relies on the effective interaction of meteorological data, advanced computer models, and human expertise.
- Its continuous evolution and refinement have made it an indispensable component of various industries, enabling them to make informed decisions and mitigate risks.
Exclusive Customer Landscape
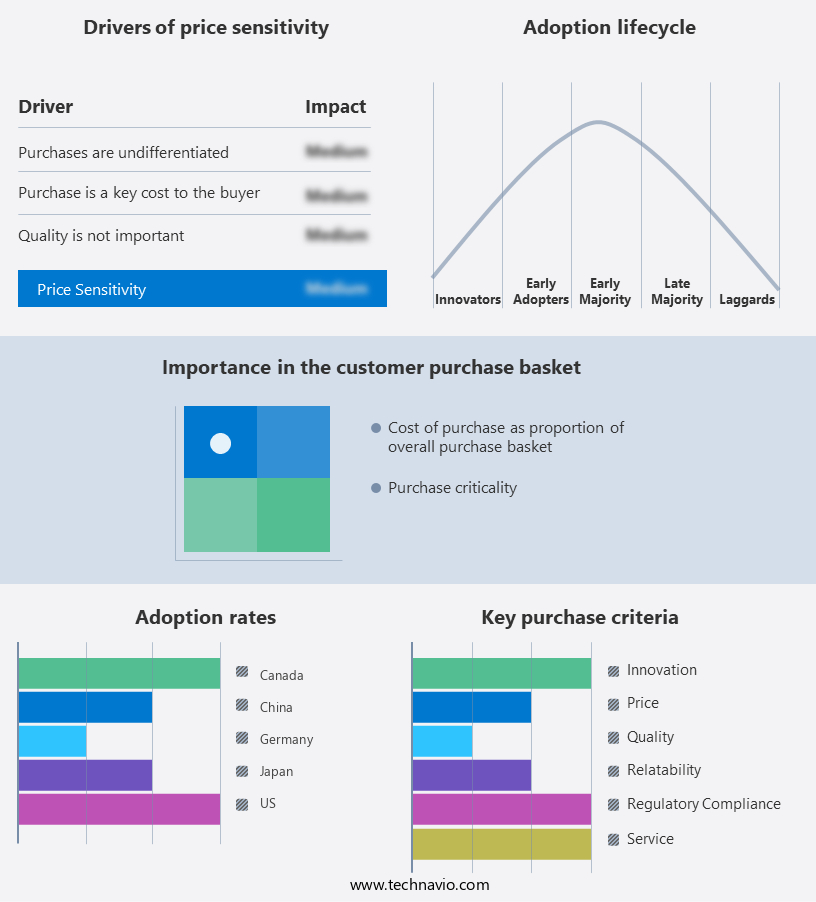
The weather forecasting services market forecasting report includes the adoption lifecycle of the market, covering from the innovator's stage to the laggard's stage. It focuses on adoption rates in different regions based on penetration. Furthermore, the weather forecasting services market report also includes key purchase criteria and drivers of price sensitivity to help companies evaluate and develop their market growth analysis strategies.
Customer Landscape of Weather Forecasting Services Industry
Competitive Landscape & Market Insights
Companies are implementing various strategies, such as strategic alliances, weather forecasting services market forecast, partnerships, mergers and acquisitions, geographical expansion, and product/service launches, to enhance their presence in the industry.
AccuWeather Inc. - This company specializes in providing advanced weather forecasting solutions, including the AccuWeather Radar App. Utilizing cutting-edge technology, it delivers accurate and timely meteorological information to help users prepare for various weather conditions.
The industry research and growth report includes detailed analyses of the competitive landscape of the market and information about key companies, including:
- AccuWeather Inc.
- Advanced Environmental Monitoring LLC
- Alfa Laval AB
- BMT Group Ltd.
- Campbell Scientific Inc.
- CSIR National Aerospace Laboratories
- Danaher Corp.
- DTN LLC
- ENAV Spa
- Environdata Weather Stations Pty Ltd.
- Fugro NV
- International Business Machines Corp.
- Met Office
- National Oceanic and Atmospheric Administration
- Precision Weather Forecasting Inc.
- Skymet Weather Services Pvt. Ltd.
- Skyview Systems
- Spire Global Inc.
- The Tomorrow Companies Inc.
- Vaisala Oyj
Qualitative and quantitative analysis of companies has been conducted to help clients understand the wider business environment as well as the strengths and weaknesses of key industry players. Data is qualitatively analyzed to categorize companies as pure play, category-focused, industry-focused, and diversified; it is quantitatively analyzed to categorize companies as dominant, leading, strong, tentative, and weak.
Recent Development and News in Weather Forecasting Services Market
- In January 2024, IBM announced the acquisition of The Weather Company, a leading weather forecasting and data analytics provider, for approximately USD2 billion. This acquisition aimed to strengthen IBM's Watson IoT portfolio and enhance its weather-related services and offerings (IBM Press Release).
- In March 2024, Microsoft and AccuWeather entered into a strategic partnership, integrating AccuWeather's forecasts and alerts into Microsoft's Bing search engine and Microsoft Edge browser. This collaboration aimed to provide users with real-time, hyperlocal weather information (Microsoft News Center).
- In April 2025, The Weather Channel Company launched its new AI-powered weather forecasting platform, "Intellicast." This advanced platform uses machine learning algorithms to analyze historical data and current weather patterns, providing more accurate and detailed forecasts (The Weather Channel Press Release).
- In May 2025, the European Union approved the acquisition of MeteoGroup by the Norwegian meteorological company, Meteorologisk Institutt. This merger is expected to create Europe's largest private weather forecasting company, with a significant impact on the European weather forecasting market (EU Commission Press Release).
Dive into Technavio's robust research methodology, blending expert interviews, extensive data synthesis, and validated models for unparalleled Weather Forecasting Services Market insights. See full methodology.
|
Market Scope |
|
|
Report Coverage |
Details |
|
Page number |
229 |
|
Base year |
2024 |
|
Historic period |
2019-2023 |
|
Forecast period |
2025-2029 |
|
Growth momentum & CAGR |
Accelerate at a CAGR of 11.8% |
|
Market growth 2025-2029 |
USD 1595.1 million |
|
Market structure |
Fragmented |
|
YoY growth 2024-2025(%) |
9.8 |
|
Key countries |
US, Canada, China, Japan, India, UK, Germany, South Korea, Italy, and France |
|
Competitive landscape |
Leading Companies, Market Positioning of Companies, Competitive Strategies, and Industry Risks |
Research Analyst Overview
- In the dynamic and ever-evolving the market, ensemble prediction systems play a pivotal role in enhancing the accuracy and reliability of aviation weather briefings. These systems, which combine multiple forecasting models to generate a more precise and comprehensive prediction, have gained significant traction in recent years. Forecasting model validation is another critical aspect of the market, ensuring the credibility of climate prediction systems and weather risk management solutions. Atmospheric data assimilation, a key component of ensemble prediction systems, enables the integration of observational data into atmospheric circulation models, improving the overall forecasting process. Air quality forecasting is another burgeoning area, with a growing emphasis on predicting the UV index and other environmental factors to mitigate health risks.
- Weather station networks, satellite meteorology, and radar meteorology are essential tools in this regard, providing real-time data for accurate and timely forecasts. Severe weather warnings, including those for extreme weather events, are a significant focus for weather prediction services. Probabilistic forecasting, high-resolution forecasting, and mesoscale modeling techniques are increasingly used to provide more detailed and precise warnings, enabling better preparedness and response. Weather model ensembles also find applications in various industries, such as wind energy forecasting, marine weather forecasts, hydrological forecasting, and agricultural weather services. Climate modeling techniques, including those for long-range forecasting, help organizations prepare for the impacts of climate change.
- Data quality control is a continuous process in the market, ensuring the accuracy and reliability of geospatial weather data and model output statistics. The market also offers weather derivative products and weather data visualization tools to help businesses make informed decisions based on weather-related risks.
What are the Key Data Covered in this Weather Forecasting Services Market Research and Growth Report?
-
What is the expected growth of the Weather Forecasting Services Market between 2025 and 2029?
-
USD 1.6 billion, at a CAGR of 11.8%
-
-
What segmentation does the market report cover?
-
The report segmented by Type (Medium-range, Long-range, Short-range, and Nowcasting), Application (Energy and utilities, Aviation, Media and consumer, Logistics and transportation, and Others), Method (Ground-based, Satellite-based, and Model-based), and Geography (North America, APAC, Europe, South America, and Middle East and Africa)
-
-
Which regions are analyzed in the report?
-
North America, APAC, Europe, South America, and Middle East and Africa
-
-
What are the key growth drivers and market challenges?
-
Farmers need weather forecasting services, Complexities of weather forecasting models
-
-
Who are the major players in the Weather Forecasting Services Market?
-
Key Companies AccuWeather Inc., Advanced Environmental Monitoring LLC, Alfa Laval AB, BMT Group Ltd., Campbell Scientific Inc., CSIR National Aerospace Laboratories, Danaher Corp., DTN LLC, ENAV Spa, Environdata Weather Stations Pty Ltd., Fugro NV, International Business Machines Corp., Met Office, National Oceanic and Atmospheric Administration, Precision Weather Forecasting Inc., Skymet Weather Services Pvt. Ltd., Skyview Systems, Spire Global Inc., The Tomorrow Companies Inc., and Vaisala Oyj
-
Market Research Insights
- The market encompasses a range of offerings, including drought monitoring, climate indices, real-time data processing, wind speed forecasting, tropical cyclone forecasting, coldwave prediction, and heatwave prediction. Two key areas of innovation are nowcasting techniques and upper-air observations. Nowcasting uses advanced algorithms to provide short-term forecasts, often within hours, while upper-air observations provide insights into atmospheric conditions at altitude. Climate variability plays a significant role in the market, with temperature forecasting, cloud cover prediction, and precipitation forecasting being essential services. Weather pattern recognition, surface weather observations, and global climate models are integral components of these offerings.
- Additionally, advanced technologies such as atmospheric physics, forecast verification methods, and weather observation techniques contribute to improved accuracy. Real-time data processing is a critical aspect of the market, with data interpolation techniques and weather balloon data enabling more accurate and comprehensive forecasts. Other emerging technologies include lightning detection systems, flood forecasting, severe thunderstorm prediction, and humidity forecasting. These services are increasingly vital as businesses and governments seek to mitigate the impacts of extreme weather events.
We can help! Our analysts can customize this weather forecasting services market research report to meet your requirements.
 RIA -
RIA - 
