Wetgas Meters Market Size 2025-2029
The wetgas meters market size is forecast to increase by USD 739.4 million at a CAGR of 6.2% between 2024 and 2029.
- The market is experiencing significant growth, driven by the global shift towards unconventional oil and gas exploration and production activities. This trend is fueled by the increasing demand for natural gas, particularly in the context of rising LNG trade. However, market expansion is not without challenges. Uncertainties surrounding low crude oil and gas prices pose a significant threat to market growth. Furthermore, regulatory hurdles impact adoption, as stringent regulations governing the use of wetgas meters in various industries necessitate compliance and increase costs. Supply chain inconsistencies also temper growth potential, as suppliers struggle to meet the increasing demand for high-precision wetgas meters. This shift is particularly evident in the maritime industry, where LNG is being increasingly used as a bunker fuel to reduce sulfur oxides and nitrogen oxides emissions. The market encompasses the construction and operation of various facilities, including liquefaction terminals, regasification terminals, and floating LNG terminals.
- To capitalize on market opportunities and navigate challenges effectively, companies must stay abreast of regulatory developments and invest in technological advancements to improve production efficiency and reduce costs. By addressing these challenges and leveraging market trends, players can position themselves for long-term success in the dynamic and evolving market.
What will be the Size of the Wetgas Meters Market during the forecast period?

- In the dynamic oil and gas industry, the adoption of advanced metering solutions, including wetgas meters, is on the rise. These meters, which measure the volume of liquid hydrocarbons and associated gas, play a crucial role in various applications, from shale gas production to power generation and municipal applications. With the increasing focus on unconventional gas reserves and the growing demand for cleaner energy sources, the market for wetgas meters is poised for significant growth. IoT solutions, such as digital connectivity options, are revolutionizing the industry by enabling real-time monitoring and analysis of gas flow rates and pressure drop.
- Sensor technologies, including ultrasonic and coriolis meters, are increasingly being used to ensure accurate measurements in horizontal drilling operations and pharmaceutical applications. Moreover, the integration of smart technologies and sensor data into energy billing systems is enhancing operational efficiency and reducing costs. In the power generation sector, wetgas meters are essential for optimizing energy production and reducing emissions. The oil and gas industry's industrialization trend is driving the demand for advanced flow meters, particularly in chemical processing and transportation applications. The ability of wetgas meters to measure the temperature and pressure of liquid droplets in natural gas streams is crucial for ensuring the safe and efficient production and transportation of this valuable resource.
- In summary, the market for wetgas meters is experiencing robust growth due to the increasing demand for accurate and efficient measurement solutions in the oil and gas industry. The integration of IoT, sensor technologies, and smart technologies is transforming the industry, enabling real-time monitoring and analysis of gas flow rates and pressure drop, and optimizing energy production and reducing costs. Natural Gas Consumption and Imports: A Growing Trend Natural gas consumption has been on the rise in the power sector due to its cleaner burning properties compared to coal and oil.
How is this Wetgas Meters Industry segmented?
The wetgas meters industry research report provides comprehensive data (region-wise segment analysis), with forecasts and estimates in "USD million" for the period 2025-2029, as well as historical data from 2019-2023 for the following segments.
- Application
- Onshore
- Offshore
- Type
- Industrial
- Commercial
- Residential
- Material
- Stainless steel
- Brass
- Product Type
- Natural gas
- Liquefied petroleum gas (LPG)
- Biogas
- Geography
- North America
- US
- Canada
- Europe
- France
- Germany
- Italy
- Russia
- APAC
- China
- India
- Japan
- Rest of World (ROW)
- North America
By Application Insights
The onshore segment is estimated to witness significant growth during the forecast period. Wetgas meters play a crucial role in power generation and industrial settings, particularly in the processing of liquids like glycerin and natural gas. The municipal sector also utilizes wetgas meters for energy billing in liquid applications. Digital connectivity options and sensor technologies have enhanced the functionality of wetgas meters, enabling real-time monitoring and analysis of gas flow rates, temperature, and pressure. The recovery of unconventional gas, such as shale gas, has propelled the demand for wetgas meters in industrialization and shale gas exploration. Industrial applications span across chemical processing, oil and gas production, and gas-based vehicles.

The Onshore segment was valued at USD 1.27 billion in 2019 and showed a gradual increase during the forecast period. The integration of IoT solutions and smart technologies, including AI and wireless communication systems, has streamlined operations and improved efficiency. Sensor technologies, like ultrasonic meters and Coriolis meters, provide accurate measurements and minimize pressure drop, ensuring optimal performance in various industries. Wetgas meters are essential in the municipal sector, where cleaner energy sources are increasingly prioritized, and natural gas is recognized as a viable alternative to carbon-emitting fuels. The World Energy Council emphasizes the importance of onshore oil and gas production in meeting the world's energy demands, with the US, Canada, Russia, and Middle Eastern countries leading the way. The onshore segment includes the market for wetgas meters, which is registering growth due to the rise in onshore oil and gas E and P activities and the expansion of oil refineries.
Regional Analysis
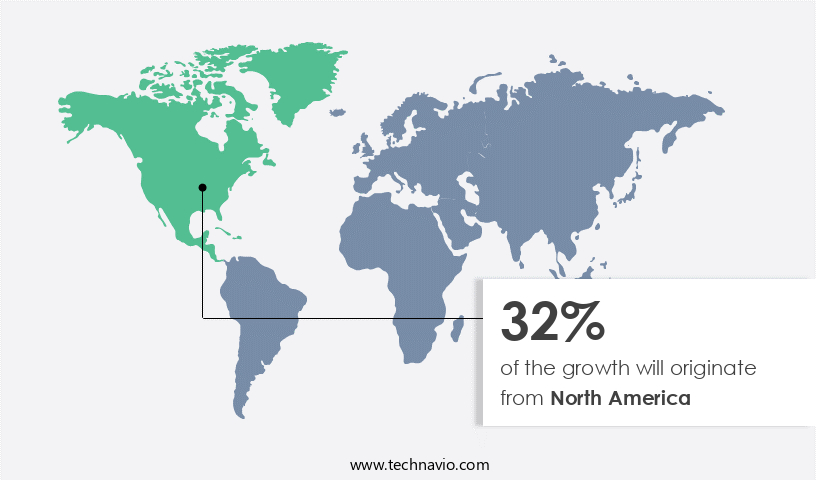
North America is estimated to contribute 32% to the growth of the global market during the forecast period. Technavio's analysts have elaborately explained the regional trends and drivers that shape the market during the forecast period.
Wetgas meters play a crucial role in power generation and industrial processes, particularly in monitoring and measuring the flow rates of liquids, including liquid droplets and glycerin, in various applications. In the municipal sector, these meters are essential for energy billing and ensuring cleaner energy sources, such as natural gas, are utilized efficiently. The integration of digital connectivity options, IoT, and smart technologies in wetgas meters has enabled remote monitoring and real-time data analysis, enhancing operational efficiency and reducing carbon emissions. The exploration and production of recoverable unconventional gas, such as shale gas, have led to an increased demand for wetgas meters in industrial settings.
Sensor technologies and wireless communication systems enable accurate measurement and monitoring of gas flow rates, temperature, and pressure in harsh environments, including oil and gas fields and chemical processing plants. Moreover, the industrialization of gas-based vehicles and the shift towards renewable energy sources have created new opportunities for wetgas meters in transportation applications. IIoT solutions and AI-driven technologies are also transforming the wetgas meter market, providing advanced features such as predictive maintenance and real-time analytics. Despite the environmental concerns associated with carbon emissions, the oil and gas industry continues to explore and produce unconventional gas reserves to meet the world's energy demands.
The World Energy Council anticipates that natural gas will remain a significant part of the energy mix, especially in the municipal and industrial sectors. Therefore, the demand for wetgas meters is expected to remain strong, driven by the need for accurate and reliable measurement and monitoring in various applications.
Market Dynamics
Our researchers analyzed the data with 2024 as the base year, along with the key drivers, trends, and challenges. A holistic analysis of drivers will help companies refine their marketing strategies to gain a competitive advantage.
What are the Wetgas Meters market drivers leading to the rise in the adoption of Industry?
- The transition towards unconventional oil and gas exploration and production (E&P) activities is the primary market driver, as traditional sources become increasingly depleted. In the oil and gas industry, the transition towards unconventional resources, including tight oil, shale oil, shale gas, and coalbed methane (CBM), necessitates advanced on-site processing equipment to maximize return on investment. Wetgas meters play a crucial role in this context, particularly in unconventional, upstream operations where they facilitate the continuous measurement of oil, gas, and water from a hydrocarbon stream without phase separation. These meters are essential for handling heavy oils, which are characterized by high viscosity and density, commonly found in 192 basins worldwide. Among the various types of wetgas meters, three are predominantly used in unconventional oil and gas production: positive displacement, vapor bubble, and thermal mass flow.
- These meters contribute significantly to industrialization efforts, enabling efficient energy billing, transportation applications, and the integration of Industrial Internet of Things (IIoT) solutions and smart technologies in the oil industry. Wetgas meters are integral to the measurement and monitoring of hydrocarbon streams, ensuring accurate and reliable data for temperature and pressure readings, and ensuring the safe and efficient extraction of resources.
What are the Wetgas Meters market trends shaping the Industry?
- An increase in global LNG trade is a key trend prevailing in the wetgas meters market. LNG trading has experienced dynamic changes in recent years. On the supply side, we are seeing growth with new projects being launched around the world. LNG trade is gaining global importance due to the advantages of natural gas as a fuel in the global energy mix. Asia remains the most important region for LNG production. Demand for LNG is increasing in China, India, and other Asian countries, and the liquefied natural gas market in these countries is growing faster than coal and oil. The US has developed extensive liquefaction capacity due to the abundance of shale gas reserves and advancements in hydraulic fracturing, primarily along the Gulf Coast.
- IoT integration in these meters enables real-time data monitoring and analysis, enhancing operational efficiency and reducing costs. The market dynamics are further influenced by factors such as pressure drop and the need for accurate and reliable measurement in various industries, including pharmaceuticals.
How does Wetgas Meters market faces challenges face during its growth?
- The uncertainties posed by low crude oil and gas prices represent a significant challenge to the industry's growth trajectory. The market experiences challenges due to the volatile nature of crude oil and natural gas prices. When prices decline, oil and gas companies may postpone or cancel exploration and production projects, resulting in decreased demand for wetgas meters. Moreover, tight budgets during price downturns can cause companies to defer investments in advanced metering technologies. The unpredictable market environment created by price volatility makes it difficult for manufacturers to accurately forecast demand and manage inventory. Prolonged periods of low prices can lead to industry consolidation, reducing competition and potentially hindering innovation. In the chemical processing sector, the shift towards gas-based vehicles and the utilization of unconventional gas reserves as cleaner energy sources are key trends driving the market.
- The World Energy Council reports that natural gas will continue to play a significant role in the energy mix, particularly in the municipal and industrial sectors. Despite these challenges, the market for wetgas meters remains dynamic, with ongoing advancements in AI and automation technologies offering opportunities for growth. According to varioUS market research firms like the International Energy Agency (IEA), the maritime industry continues to rely heavily on heavy fuel oil (HFO) for fuel.
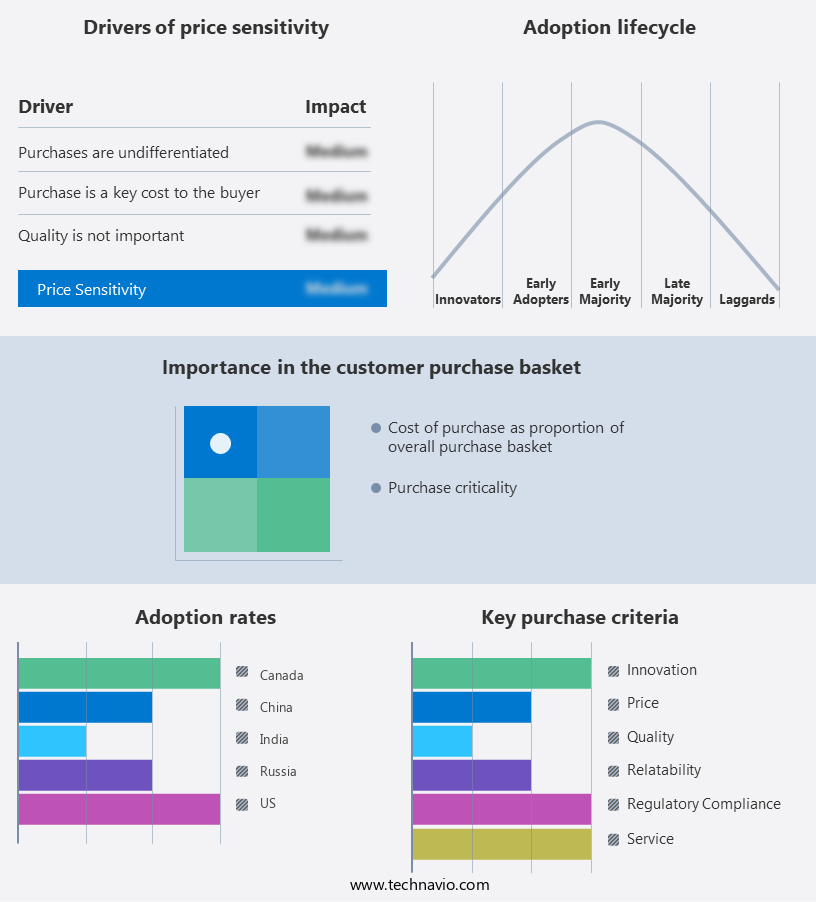
Exclusive Customer Landscape
The wetgas meters market forecasting report includes the adoption lifecycle of the market, covering from the innovator's stage to the laggard's stage. It focuses on adoption rates in different regions based on penetration. Furthermore, the wetgas meters market report also includes key purchase criteria and drivers of price sensitivity to help companies evaluate and develop their market growth analysis strategies.
Customer Landscape
Key Companies & Market Insights
Companies are implementing various strategies, such as strategic alliances, wetgas meters market forecast, partnerships, mergers and acquisitions, geographical expansion, and product/service launches, to enhance their presence in the industry.
Apex Instruments Inc. - The company specializes in providing advanced wetgas metering solutions, including the W-NK wet gas meter.
The industry research and growth report includes detailed analyses of the competitive landscape of the market and information about key companies, including:
- Apex Instruments Inc.
- CX Instrument
- Dermaga Oil and Gas Sdn. Bhd.
- DP Diagnostics
- Dr.Ing. RITTER Apparatebau GmbH and Co. KG
- EMCO Controls AS
- Emerson Electric Co.
- Haimo Technologies Group Corp.
- Instrumentation and Scientific Instruments Pvt. Ltd.
- KROHNE Messtechnik GmbH
- RMG Messtechnik GmbH
- ROSEN Swiss AG
- SEIL ENTERPRISE Co.
- SGS Lab Instruments
- Shinagawa Co. Ltd.
- Tek Trol LLC
- THIOKA Enterprise Co. Ltd.
- Vinci Technologies
- Weatherford International Plc
- Yokogawa Electric Corp.
Qualitative and quantitative analysis of companies has been conducted to help clients understand the wider business environment as well as the strengths and weaknesses of key industry players. Data is qualitatively analyzed to categorize companies as pure play, category-focused, industry-focused, and diversified; it is quantitatively analyzed to categorize companies as dominant, leading, strong, tentative, and weak.
Recent Development and News in Wetgas Meters Market
- In February 2024, Emerson Electric Company, a global technology and engineering leader, introduced the Rosemount 3051S Wet Gas Flowmeter, featuring Ultrasonic Technology for enhanced accuracy and reliability in the oil and gas industry (Emerson Electric Company Press Release, 2024). This new product launch addresses the growing demand for advanced flow measurement solutions in the market.
- In August 2025, ABB and Schneider Electric, two major players in the energy automation industry, announced a strategic partnership to collaborate on the development and implementation of integrated solutions for gas metering applications (ABB Press Release, 2025). This collaboration aims to strengthen their positions in the market by offering comprehensive, end-to-end solutions to their clients.
- In November 2024, Honeywell International Inc. completed the acquisition of Intermec, a leading provider of data capturing and mobility solutions, significantly expanding its portfolio in the market (Honeywell International Inc. Press Release, 2024). This acquisition allows Honeywell to offer integrated solutions, combining advanced metering technologies and data management capabilities.
- In March 2025, the European Union passed the Revised Gas Directive, mandating the installation of advanced metering infrastructure for all natural gas customers by 2027 (European Commission Press Release, 2025). This regulatory approval is expected to boost the demand for wetgas meters in Europe, as the market shifts towards more accurate and efficient measurement solutions.
Research Analyst Overview
Wetgas meters, a critical component in the measurement of natural gas and other liquefied hydrocarbons, continue to play a pivotal role in various sectors, including power generation, municipal applications, industrial settings, and transportation. The ongoing dynamics of this market are shaped by several factors, including the integration of advanced sensor technologies, digital connectivity options, and IIoT solutions. In power generation, wetgas meters are essential in measuring the gas flow rates for efficient and cleaner energy production. The increasing trend towards renewable energy sources and the need for carbon emissions reduction have led to the adoption of wetgas meters in combined cycle power plants and cogeneration systems. The market, encompassing Construction, Alternative Energy Sources, and Renewable Energy, has faced challenges due to the US-China trade dispute since 2023.
The integration of AI and smart technologies in these meters enables real-time monitoring and analysis of gas flow data, enhancing operational efficiency and reducing downtime. Municipal applications of wetgas meters are also evolving, with a focus on digitalization and automation. Municipal sectors are increasingly adopting IoT-enabled meters to optimize energy billing and improve customer service. These meters provide real-time data on gas consumption, enabling timely billing and reducing the need for manual meter readings. The industrial sector continues to be a significant market for wetgas meters, particularly in chemical processing, oil and gas production, and pharmaceutical applications. The use of wetgas meters in these industries is essential for process control, ensuring consistent product quality and safety.
Digitalization and automation are key trends in this sector, with the adoption of wireless communication systems and ultrasonic meters enabling remote monitoring and real-time data analysis. The exploration and production of recoverable unconventional gas resources, such as shale gas, have led to the evolution of wetgas meters in oil and gas applications. Horizontal drilling and advanced drilling techniques have increased the demand for accurate and reliable gas flow measurement. Coriolis meters and other advanced flow measurement technologies are being adopted to ensure precise measurement of gas flow rates and pressure drop in these applications. The transportation sector is another significant market for wetgas meters, particularly in the context of gas-based vehicles and natural gas distribution.
The increasing adoption of natural gas as a cleaner energy source for transportation has led to the development of advanced wetgas meters for accurate measurement and billing of gas volumes in transportation applications. The ongoing industrialization and urbanization trends are driving the demand for wetgas meters in various applications. The World Energy Council estimates that energy demand will increase by 50% by 2050, necessitating the adoption of advanced energy measurement technologies, including wetgas meters. The integration of digitalization, automation, and IIoT solutions in wetgas meters is expected to enhance operational efficiency, reduce downtime, and improve accuracy and reliability in various applications. In conclusion, the market is dynamic and evolving, driven by various factors, including digitalization, automation, and the adoption of advanced sensor technologies and IIoT solutions. The market is expected to continue growing, particularly in power generation, municipal applications, industrial settings, and transportation, as the demand for cleaner and more efficient energy sources increases.
Dive into Technavio's robust research methodology, blending expert interviews, extensive data synthesis, and validated models for unparalleled Wetgas Meters Market insights. See full methodology.
|
Market Scope |
|
|
Report Coverage |
Details |
|
Page number |
227 |
|
Base year |
2024 |
|
Historic period |
2019-2023 |
|
Forecast period |
2025-2029 |
|
Growth momentum & CAGR |
Accelerate at a CAGR of 6.2% |
|
Market growth 2025-2029 |
USD 739.4 million |
|
Market structure |
Fragmented |
|
YoY growth 2024-2025(%) |
5.7 |
|
Key countries |
US, Russia, Germany, China, Canada, India, France, Japan, Italy, and Saudi Arabia |
|
Competitive landscape |
Leading Companies, Market Positioning of Companies, Competitive Strategies, and Industry Risks |
What are the Key Data Covered in this Wetgas Meters Market Research and Growth Report?
- CAGR of the Wetgas Meters industry during the forecast period
- Detailed information on factors that will drive the growth and forecasting between 2025 and 2029
- Precise estimation of the size of the market and its contribution of the industry in focus to the parent market
- Accurate predictions about upcoming growth and trends and changes in consumer behaviour
- Growth of the market across Europe, North America, APAC, Middle East and Africa, and South America
- Thorough analysis of the market's competitive landscape and detailed information about companies
- Comprehensive analysis of factors that will challenge the wetgas meters market growth of industry companies
We can help! Our analysts can customize this wetgas meters market research report to meet your requirements.
 RIA -
RIA - 
