Bunker Fuel Market Analysis, Size, and Forecast 2026-2030: APAC (China, Japan, and South Korea), Europe (Germany, The Netherlands, and UK), Middle East and Africa (UAE, Saudi Arabia, and South Africa), North America (US, Canada, and Mexico), South America (Brazil and Argentina), and Rest of World (ROW)

Bunker Fuel Market Analysis, Size, and Forecast 2026-2030:
APAC (China, Japan, and South Korea), Europe (Germany, The Netherlands, and UK), Middle East and Africa (UAE, Saudi Arabia, and South Africa), North America (US, Canada, and Mexico), South America (Brazil and Argentina), and Rest of World (ROW)

Published: Mar 2026 304 Pages SKU: IRTNTR40326

Market Overview at a Glance

$36.14 B
Market Opportunity
4.6%
CAGR 2025 - 2030
39.5%
APAC Growth
$60.38 B
MGO segment 2024

Bunker Fuel Market Size 2026-2030

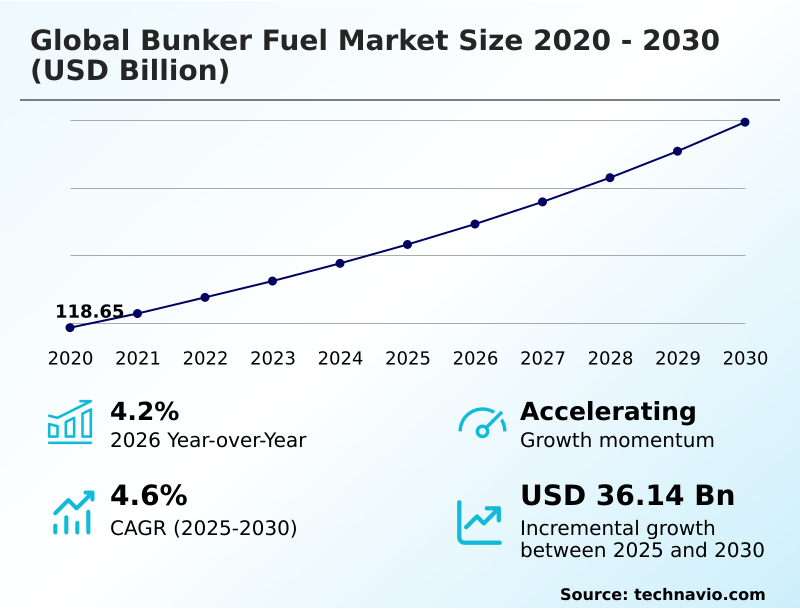
The bunker fuel market size is valued to increase by USD 36.14 billion, at a CAGR of 4.6% from 2025 to 2030. Implementation of rigorous decarbonization mandates and standards will drive the bunker fuel market.

Major Market Trends & Insights

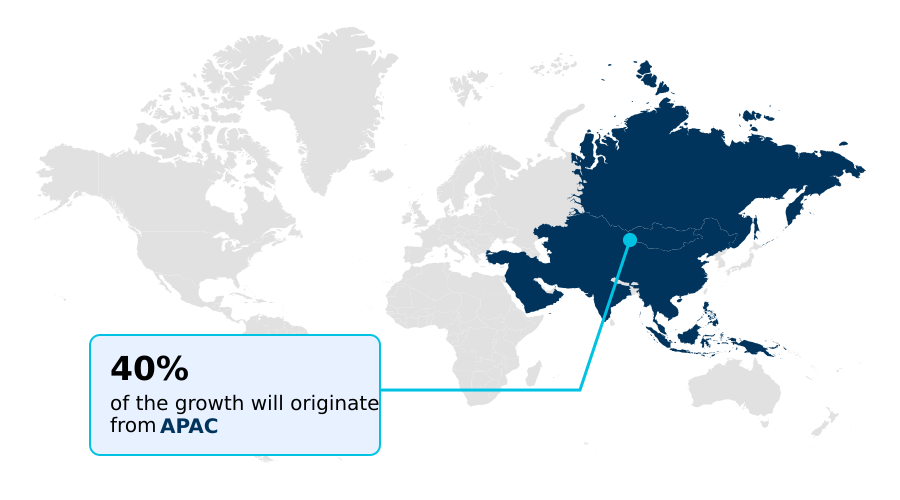
  • APAC dominated the market and accounted for a 39.5% growth during the forecast period.
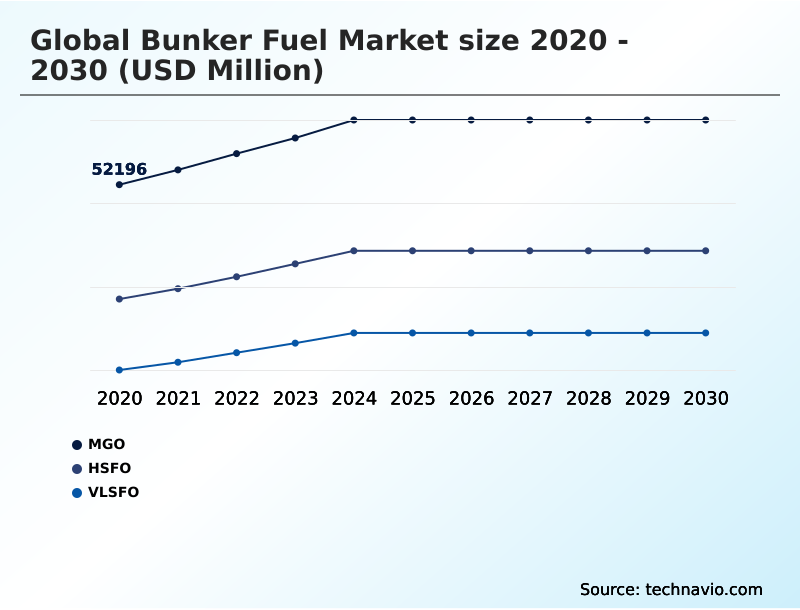
  • By Type - MGO segment was valued at USD 60.38 billion in 2024
  • By Application - Container segment accounted for the largest market revenue share in 2024

Market Size & Forecast

  • Market Opportunities: USD 60.71 billion
  • Market Future Opportunities: USD 36.14 billion
  • CAGR from 2025 to 2030 : 4.6%

Market Summary

  • The Bunker Fuel Market is in a period of unprecedented transformation, moving away from a single-fuel dependency toward a complex, multi-fuel ecosystem. This shift is driven by stringent decarbonization mandates, such as the carbon intensity indicator (CII) regulations and the EU ETS, which penalize greenhouse gas emissions.
  • As a result, shipowners are compelled to explore a range of low-carbon alternatives, including LNG bunkering, biofuels, and green methanol. This transition creates significant challenges, from the high cost of alternative fuel infrastructure to the logistical complexities of a fragmented global supply chain.
  • For instance, a container line planning a voyage from Asia to Europe must now consider not only the price but also the availability of compliant fuels like a B30 blend or VLSFO at various transshipment hubs, balancing the cost of carbon allowances against potential rerouting.
  • The industry is responding with innovation, developing green maritime corridors and adopting digital tools like electronic bunker delivery notes (eBDN) to enhance transparency and efficiency. This dynamic environment demands a strategic approach to fuel procurement and vessel technology investment to maintain competitiveness while navigating the path to net-zero.

What will be the Size of the Bunker Fuel Market during the forecast period?

Get Key Insights on Market Forecast (PDF) Request Free Sample

How is the Bunker Fuel Market Segmented?

The bunker fuel industry research report provides comprehensive data (region-wise segment analysis), with forecasts and estimates in "USD million" for the period 2026-2030, as well as historical data from 2020-2024 for the following segments.

  • Type
    • MGO
    • HSFO
    • VLSFO
  • Application
    • Container
    • Bulk carrier
    • Oil tanker
    • General cargo
    • Chemical tanker
  • Distribution channel
    • IOC or NOC
    • Large independent distributor
    • Small independent distributor
  • Geography
    • APAC
      • China
      • Japan
      • South Korea
    • Europe
      • Germany
      • The Netherlands
      • UK
    • Middle East and Africa
      • UAE
      • Saudi Arabia
      • South Africa
    • North America
      • US
      • Canada
      • Mexico
    • South America
      • Brazil
      • Argentina
    • Rest of World (ROW)

By Type Insights

The mgo segment is estimated to witness significant growth during the forecast period.

The marine gas oil (MGO) segment is a critical compliance pathway, serving vessels in Emission Control Areas (ECAs) with sulfur limits capped at 0.10%. Demand for this distillate, including various bio-distillates, is rising due to expanding regulations.

Its use simplifies onboard handling, and the market is adapting as smaller ports invest in storage, enhancing last-mile delivery.

The move towards bio-blending with components like Fatty Acid Methyl Esters (FAME) is vital for improving a vessel's Carbon Intensity Indicator (CII).

This shift, supported by ISO 8217 standards for fuel quality assurance, is driving investment in refining capacity for middle distillates and drop-in biofuels, moving MGO from a niche product to a strategic necessity.

Request Free Sample

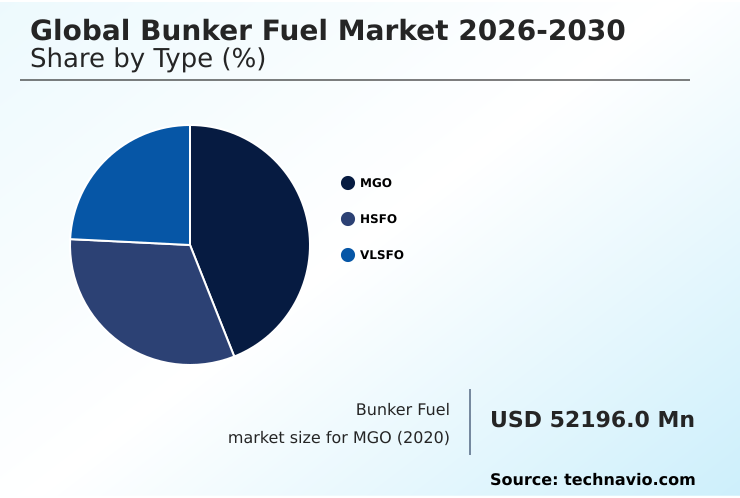
The MGO segment was valued at USD 60.38 billion in 2024 and showed a gradual increase during the forecast period.

Request Free Sample

Regional Analysis

APAC is estimated to contribute 39.5% to the growth of the global market during the forecast period.Technavio’s analysts have elaborately explained the regional trends and drivers that shape the market during the forecast period.

See How Bunker Fuel Market Demand is Rising in APAC Request Free Sample

APAC is central to market dynamics, accounting for 39.5% of incremental growth. Singapore's mandate for mass flow meters has enhanced delivery accuracy by over 99%, setting a standard for the bunker supply chain.

Europe's market, operating within strict Emission Control Areas (ECA), leads the transition toward bio-blending solutions using FAME and HVO. However, this creates a risk of 'bunker tourism'.

The Middle East adapts to geopolitical shifts, with Fujairah expanding capacity, while African ports manage surges from rerouted vessels.

This global landscape requires advanced voyage optimization and robust bunkering safety protocols to manage a complex marine fuel logistics network, including the sourcing of products like a B24 blend.

Market Dynamics

Our researchers analyzed the data with 2025 as the base year, along with the key drivers, trends, and challenges. A holistic analysis of drivers will help companies refine their marketing strategies to gain a competitive advantage.

  • Navigating the modern Bunker Fuel Market requires a sophisticated understanding of competing decarbonization pathways. A central decision for fleet operators is the VLSFO vs HSFO with scrubbers debate, where the ROI of dual-fuel vessel conversion must be weighed against initial capital outlay.
  • The cost of LNG bunkering infrastructure remains a significant barrier for many ports, complicating the widespread adoption of gas-as-a-fuel. Similarly, the challenges of green methanol adoption include sourcing and price volatility. As regulations tighten, understanding marine biofuel blending regulations and the impact of EU ETS on bunkering becomes critical for compliance.
  • The future of heavy fuel oil is increasingly tied to the development of onboard carbon capture technologies. For emerging zero-carbon options, establishing safety protocols for ammonia bunkering and building a resilient supply chain for green hydrogen are monumental tasks. The role of digitalization in bunkering is expanding, with technical standards for e-BDNs essential for mitigating operational risks of fuel compatibility.
  • This digital shift, alongside the mass balance approach for biofuels and investment in multi-fuel terminals, is key to developing green maritime corridors. Effective management of carbon pricing in shipping now hinges on accurate carbon intensity rating calculation, strategic alternative fuel feedstock sourcing, and a clear view of market dynamics.

What are the key market drivers leading to the rise in the adoption of Bunker Fuel Industry?

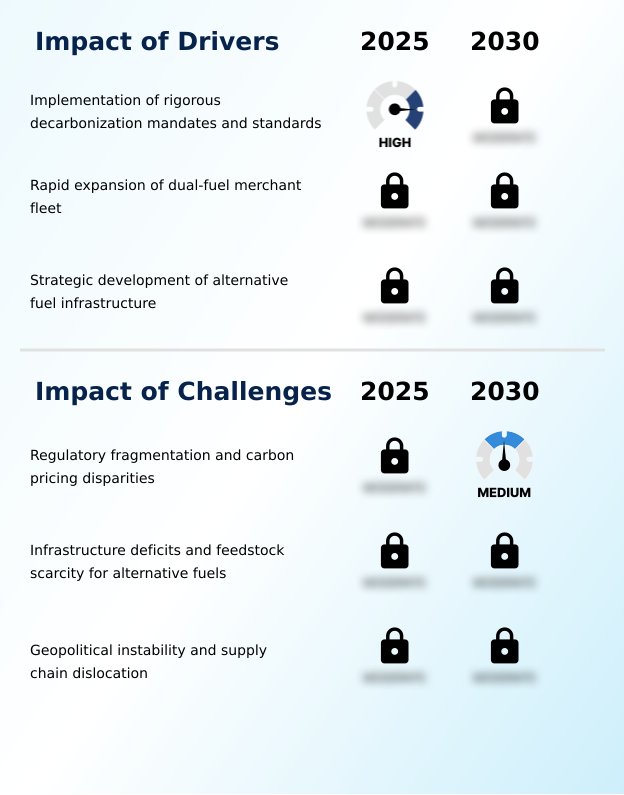
  • The implementation of rigorous decarbonization mandates and standards serves as a key driver for the market's transition toward cleaner fuel alternatives.

  • Stringent regulations like IMO 2020 and the EU ETS are the primary driver, compelling a shift from heavy fuel oil.
  • The FuelEU Maritime regulation, with its mandated greenhouse gas intensity reductions, creates direct financial incentives for adopting biofuels or renewable diesel.
  • The aggressive expansion of the dual-fuel vessel order book, featuring advanced dual-fuel propulsion systems, creates immediate demand for LNG bunkering. This transition from piloting to deployment future-proofs fleets. Strategic investment in alternative fuel infrastructure is also critical.
  • New multi-fuel bunkering services allow vessels to refuel at key chokepoints, while specialized bunker barges reduce turnaround times by over 30%, making new fuels operationally competitive.

What are the market trends shaping the Bunker Fuel Industry?

  • The digitalization of the bunker supply chain is a prominent market trend. It is characterized by the adoption of electronic verification methods to enhance transparency and efficiency.

  • The industry is shifting toward total digitalization, with the adoption of electronic bunker delivery notes (eBDN) improving transparency. Integrating mass flow meter data into digital platforms creates an immutable chain of custody, reducing verification times by over 40%. Green maritime corridors are reshaping the market, focusing on fuels like green methanol.
  • These corridors aim to aggregate demand, potentially lowering the price gap for alternative fuels by 15%. A key trend is the mainstreaming of bio-blending solutions, such as a B30 blend with VLSFO, which utilizes mass balance certification to expand availability of low-carbon alternatives.
  • This digitally tracks sustainability credits, enabling compliance without requiring physical fuel segregation at every stage of the bunker supply chain.

What challenges does the Bunker Fuel Industry face during its growth?

  • Regulatory fragmentation and carbon pricing disparities present a key challenge affecting the industry's operational and financial landscape.

  • A fragmented regulatory landscape and carbon pricing disparities create significant distortions. This incentivizes evasive port calls to transshipment hubs to avoid regional regulations. The gap between ambition and infrastructure readiness is another challenge, particularly for fuels like green ammonia or synthetic methane, where feedstock availability is limited.
  • For vessels with exhaust gas cleaning systems (scrubbers) using HSFO, this isn't an issue, but for those on VLSFO, sourcing compliant fuel is paramount. Geopolitical instability also disrupts supply chains, forcing costly rerouting that leads to bunkering delays exceeding 72 hours in some ports.
  • This volatility complicates fuel procurement strategy and increases operational risk for all fuel types, including gas-to-liquids (GTL) products.

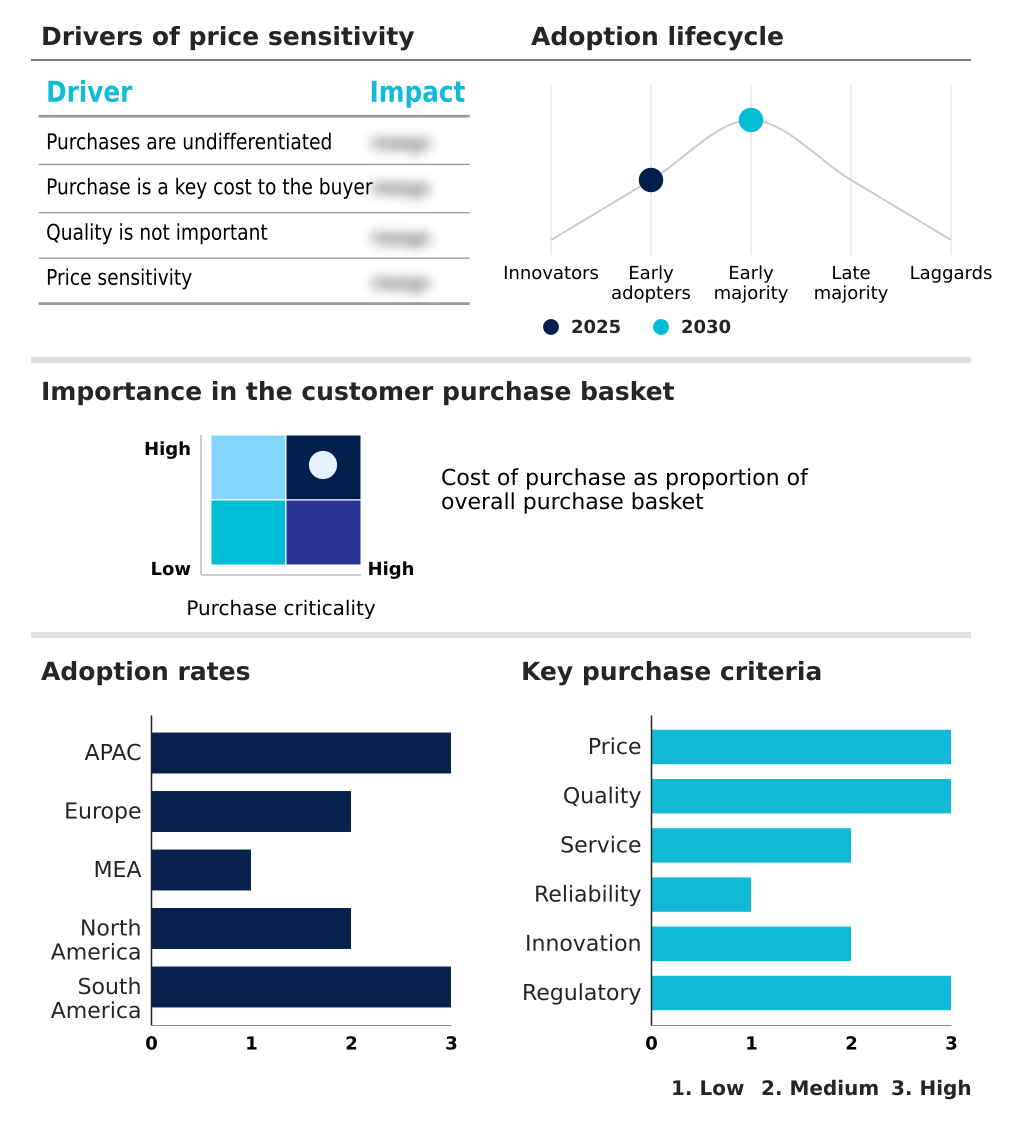
Exclusive Technavio Analysis on Customer Landscape

The bunker fuel market forecasting report includes the adoption lifecycle of the market, covering from the innovator’s stage to the laggard’s stage. It focuses on adoption rates in different regions based on penetration. Furthermore, the bunker fuel market report also includes key purchase criteria and drivers of price sensitivity to help companies evaluate and develop their market growth analysis strategies.

Customer Landscape of Bunker Fuel Industry

Competitive Landscape

Companies are implementing various strategies, such as strategic alliances, bunker fuel market forecast, partnerships, mergers and acquisitions, geographical expansion, and product/service launches, to enhance their presence in the industry.

Aegis Logistics Ltd. - Delivers key marine fuel grades, including marine gas oil (MGO), essential for global vessel propulsion and operational compliance.

The industry research and growth report includes detailed analyses of the competitive landscape of the market and information about key companies, including:

  • Aegis Logistics Ltd.
  • Bunker Oil AS
  • Chevron Corp.
  • Eni SpA
  • Exxon Mobil Corp.
  • Gulf Agency Co. Ltd.
  • Hindustan Petroleum Corp. Ltd.
  • Indian Oil Corp. Ltd.
  • Maritime Optima
  • Petroliam Nasional Berhad
  • Shell plc
  • Shiny Shipping and Logistics Pvt Ltd
  • ShipServ Limited
  • TotalEnergies SE
  • Vizag Chemical International

Qualitative and quantitative analysis of companies has been conducted to help clients understand the wider business environment as well as the strengths and weaknesses of key industry players. Data is qualitatively analyzed to categorize companies as pure play, category-focused, industry-focused, and diversified; it is quantitatively analyzed to categorize companies as dominant, leading, strong, tentative, and weak.

Recent Development and News in Bunker fuel market

  • In November 2024, ZeroNorth integrated its e-bunkering capability with fuel supplier systems in the Port of Rotterdam, enabling seamless transmission of digital bunker delivery notes.
  • In March 2025, Panam LNG Bunkering, a joint venture between AES Corporation and Seaspan Energy, launched commercial LNG bunkering services in Panama, enhancing fuel availability at a key maritime chokepoint.
  • In March 2025, Monjasa completed a B30 biofuel supply operation in the Middle East, utilizing a mass balance chain of custody to provide ISCC-certified proof of sustainability.
  • In May 2025, The Port of Rotterdam Authority announced a revised timeline for its green hydrogen and methanol import terminal, citing supply chain constraints for electrolyzer procurement.

Dive into Technavio’s robust research methodology, blending expert interviews, extensive data synthesis, and validated models for unparalleled Bunker Fuel Market insights. See full methodology.

Market Scope
Page number 304
Base year 2025
Historic period 2020-2024
Forecast period 2026-2030
Growth momentum & CAGR Accelerate at a CAGR of 4.6%
Market growth 2026-2030 USD 36141.0 million
Market structure Fragmented
YoY growth 2025-2026(%) 4.2%
Key countries Singapore, China, Japan, South Korea, India, Indonesia, Germany, The Netherlands, UK, France, Spain, Italy, UAE, Saudi Arabia, South Africa, Qatar, Egypt, US, Canada, Mexico, Brazil, Chile and Argentina
Competitive landscape Leading Companies, Market Positioning of Companies, Competitive Strategies, and Industry Risks

Request Free Sample

Research Analyst Overview

  • The Bunker Fuel Market is undergoing a profound structural shift, driven by regulatory pressures such as IMO 2020 and the EU ETS. This has fragmented the traditional reliance on heavy fuel oil (HFO) and high-sulfur fuel oil (HSFO), creating distinct pathways for compliance. One route involves installing exhaust gas cleaning systems (scrubbers) to continue using HSFO.
  • The other, more common path, is the adoption of compliant fuels like very low sulfur fuel oil (VLSFO) and marine gas oil (MGO). The market is now a multi-fuel ecosystem, with LNG bunkering becoming established and emerging alternatives like green methanol and green ammonia gaining traction.
  • To meet immediate carbon intensity indicator (CII) targets under regulations like FuelEU Maritime, shipowners are turning to drop-in biofuels. These include hydrotreated vegetable oil (HVO) and fatty acid methyl esters (FAME), often supplied as a B24 blend or B30 blend. The rise of dual-fuel propulsion technology is a direct response to this complexity.
  • For transparency, the use of electronic bunker delivery notes (eBDN) is becoming standard, ensuring compliance with ISO 8217.
  • The development of synthetic methane and gas-to-liquids (GTL) products, alongside renewable diesel and green hydrogen, points to a future where fuel choice is a critical boardroom decision, where the implementation of eBDNs has been shown to reduce administrative clearance times by up to 40%.

What are the Key Data Covered in this Bunker Fuel Market Research and Growth Report?

  • What is the expected growth of the Bunker Fuel Market between 2026 and 2030?

    • USD 36.14 billion, at a CAGR of 4.6%

  • What segmentation does the market report cover?

    • The report is segmented by Type (MGO, HSFO, and VLSFO), Application (Container, Bulk carrier, Oil tanker, General cargo, and Chemical tanker), Distribution Channel (IOC or NOC, Large independent distributor, and Small independent distributor) and Geography (APAC, Europe, Middle East and Africa, North America, South America)

  • Which regions are analyzed in the report?

    • APAC, Europe, Middle East and Africa, North America and South America

  • What are the key growth drivers and market challenges?

    • Implementation of rigorous decarbonization mandates and standards, Regulatory fragmentation and carbon pricing disparities

  • Who are the major players in the Bunker Fuel Market?

    • Aegis Logistics Ltd., Bunker Oil AS, Chevron Corp., Eni SpA, Exxon Mobil Corp., Gulf Agency Co. Ltd., Hindustan Petroleum Corp. Ltd., Indian Oil Corp. Ltd., Maritime Optima, Petroliam Nasional Berhad, Shell plc, Shiny Shipping and Logistics Pvt Ltd, ShipServ Limited, TotalEnergies SE and Vizag Chemical International

Market Research Insights

  • The bunker fuel market's dynamics are shaped by a complex interplay of logistical and regulatory factors. An effective fuel procurement strategy is paramount, moving beyond simple spot market purchasing to complex contract structures that ensure fuel compatibility and quality assurance.
  • The entire bunker supply chain is being re-evaluated, with a focus on last-mile delivery and the development of alternative fuel infrastructure to support a multi-fuel bunkering reality. This includes cryogenic fuels, which demand stringent bunkering safety protocols.
  • The rise of green maritime corridors and bio-blending solutions, supported by sustainability credits and a clear chain of custody, is transforming marine fuel logistics. The mass balance approach has expanded low-carbon options by 40% in ports lacking segregated infrastructure.
  • Meanwhile, onboard carbon capture and voyage optimization technologies are critical for improving vessel energy efficiency, helping operators manage carbon pricing mechanisms and navigate transshipment hubs for strategic port call optimization. The use of mass flow meters has also reduced quantity disputes by up to 25%, demonstrating the value of transparency in fuel hedging for both marine distillates and residual fuels.

We can help! Our analysts can customize this bunker fuel market research report to meet your requirements.

Get in touch

1. Executive Summary

1.1 Market overview

Executive Summary - Chart on Market Overview
Executive Summary - Data Table on Market Overview
Executive Summary - Chart on Global Market Characteristics
Executive Summary - Chart on Market by Geography
Executive Summary - Chart on Market Segmentation by Type
Executive Summary - Chart on Market Segmentation by Application
Executive Summary - Chart on Market Segmentation by Distribution Channel
Executive Summary - Chart on Incremental Growth
Executive Summary - Data Table on Incremental Growth
Executive Summary - Chart on Company Market Positioning

2. Technavio Analysis

2.1 Analysis of price sensitivity, lifecycle, customer purchase basket, adoption rates, and purchase criteria

2.2 Criticality of inputs and Factors of differentiation

Chart on Overview on criticality of inputs and factors of differentiation

2.3 Factors of disruption

Chart on Overview on factors of disruption

2.4 Impact of drivers and challenges

Chart on Impact of drivers and challenges in 2025 and 2030

3. Market Landscape

3.1 Market ecosystem

Chart on Parent Market
Data Table on - Parent Market

3.2 Market characteristics

Chart on Market characteristics analysis

3.3 Value chain analysis

Chart on Value chain analysis

4. Market Sizing

4.1 Market definition

Data Table on Offerings of companies included in the market definition

4.2 Market segment analysis

Market segments

4.3 Market size 2025

4.4 Market outlook: Forecast for 2025-2030

Chart on Global - Market size and forecast 2025-2030 ($ million)
Data Table on Global - Market size and forecast 2025-2030 ($ million)
Chart on Global Market: Year-over-year growth 2025-2030 (%)
Data Table on Global Market: Year-over-year growth 2025-2030 (%)

5. Historic Market Size

5.1 Global Bunker Fuel Market 2020 - 2024

Historic Market Size - Data Table on Global Bunker Fuel Market 2020 - 2024 ($ million)

5.2 Type segment analysis 2020 - 2024

Historic Market Size - Type Segment 2020 - 2024 ($ million)

5.3 Application segment analysis 2020 - 2024

Historic Market Size - Application Segment 2020 - 2024 ($ million)

5.4 Distribution Channel segment analysis 2020 - 2024

Historic Market Size - Distribution Channel Segment 2020 - 2024 ($ million)

5.5 Geography segment analysis 2020 - 2024

Historic Market Size - Geography Segment 2020 - 2024 ($ million)

5.6 Country segment analysis 2020 - 2024

Historic Market Size - Country Segment 2020 - 2024 ($ million)

6. Qualitative Analysis

6.1 Impact of AI on Global Bunker Fuel Market

7. Five Forces Analysis

7.1 Five forces summary

Five forces analysis - Comparison between 2025 and 2030

7.2 Bargaining power of buyers

Bargaining power of buyers - Impact of key factors 2025 and 2030

7.3 Bargaining power of suppliers

Bargaining power of suppliers - Impact of key factors in 2025 and 2030

7.4 Threat of new entrants

Threat of new entrants - Impact of key factors in 2025 and 2030

7.5 Threat of substitutes

Threat of substitutes - Impact of key factors in 2025 and 2030

7.6 Threat of rivalry

Threat of rivalry - Impact of key factors in 2025 and 2030

7.7 Market condition

Chart on Market condition - Five forces 2025 and 2030

8. Market Segmentation by Type

8.1 Market segments

Chart on Type - Market share 2025-2030 (%)
Data Table on Type - Market share 2025-2030 (%)

8.2 Comparison by Type

Chart on Comparison by Type
Data Table on Comparison by Type

8.3 MGO - Market size and forecast 2025-2030

Chart on MGO - Market size and forecast 2025-2030 ($ million)
Data Table on MGO - Market size and forecast 2025-2030 ($ million)
Chart on MGO - Year-over-year growth 2025-2030 (%)
Data Table on MGO - Year-over-year growth 2025-2030 (%)

8.4 HSFO - Market size and forecast 2025-2030

Chart on HSFO - Market size and forecast 2025-2030 ($ million)
Data Table on HSFO - Market size and forecast 2025-2030 ($ million)
Chart on HSFO - Year-over-year growth 2025-2030 (%)
Data Table on HSFO - Year-over-year growth 2025-2030 (%)

8.5 VLSFO - Market size and forecast 2025-2030

Chart on VLSFO - Market size and forecast 2025-2030 ($ million)
Data Table on VLSFO - Market size and forecast 2025-2030 ($ million)
Chart on VLSFO - Year-over-year growth 2025-2030 (%)
Data Table on VLSFO - Year-over-year growth 2025-2030 (%)

8.6 Market opportunity by Type

Market opportunity by Type ($ million)
Data Table on Market opportunity by Type ($ million)

9. Market Segmentation by Application

9.1 Market segments

Chart on Application - Market share 2025-2030 (%)
Data Table on Application - Market share 2025-2030 (%)

9.2 Comparison by Application

Chart on Comparison by Application
Data Table on Comparison by Application

9.3 Container - Market size and forecast 2025-2030

Chart on Container - Market size and forecast 2025-2030 ($ million)
Data Table on Container - Market size and forecast 2025-2030 ($ million)
Chart on Container - Year-over-year growth 2025-2030 (%)
Data Table on Container - Year-over-year growth 2025-2030 (%)

9.4 Bulk carrier - Market size and forecast 2025-2030

Chart on Bulk carrier - Market size and forecast 2025-2030 ($ million)
Data Table on Bulk carrier - Market size and forecast 2025-2030 ($ million)
Chart on Bulk carrier - Year-over-year growth 2025-2030 (%)
Data Table on Bulk carrier - Year-over-year growth 2025-2030 (%)

9.5 Oil tanker - Market size and forecast 2025-2030

Chart on Oil tanker - Market size and forecast 2025-2030 ($ million)
Data Table on Oil tanker - Market size and forecast 2025-2030 ($ million)
Chart on Oil tanker - Year-over-year growth 2025-2030 (%)
Data Table on Oil tanker - Year-over-year growth 2025-2030 (%)

9.6 General cargo - Market size and forecast 2025-2030

Chart on General cargo - Market size and forecast 2025-2030 ($ million)
Data Table on General cargo - Market size and forecast 2025-2030 ($ million)
Chart on General cargo - Year-over-year growth 2025-2030 (%)
Data Table on General cargo - Year-over-year growth 2025-2030 (%)

9.7 Chemical tanker - Market size and forecast 2025-2030

Chart on Chemical tanker - Market size and forecast 2025-2030 ($ million)
Data Table on Chemical tanker - Market size and forecast 2025-2030 ($ million)
Chart on Chemical tanker - Year-over-year growth 2025-2030 (%)
Data Table on Chemical tanker - Year-over-year growth 2025-2030 (%)

9.8 Market opportunity by Application

Market opportunity by Application ($ million)
Data Table on Market opportunity by Application ($ million)

10. Market Segmentation by Distribution Channel

10.1 Market segments

Chart on Distribution Channel - Market share 2025-2030 (%)
Data Table on Distribution Channel - Market share 2025-2030 (%)

10.2 Comparison by Distribution Channel

Chart on Comparison by Distribution Channel
Data Table on Comparison by Distribution Channel

10.3 IOC or NOC - Market size and forecast 2025-2030

Chart on IOC or NOC - Market size and forecast 2025-2030 ($ million)
Data Table on IOC or NOC - Market size and forecast 2025-2030 ($ million)
Chart on IOC or NOC - Year-over-year growth 2025-2030 (%)
Data Table on IOC or NOC - Year-over-year growth 2025-2030 (%)

10.4 Large independent distributor - Market size and forecast 2025-2030

Chart on Large independent distributor - Market size and forecast 2025-2030 ($ million)
Data Table on Large independent distributor - Market size and forecast 2025-2030 ($ million)
Chart on Large independent distributor - Year-over-year growth 2025-2030 (%)
Data Table on Large independent distributor - Year-over-year growth 2025-2030 (%)

10.5 Small independent distributor - Market size and forecast 2025-2030

Chart on Small independent distributor - Market size and forecast 2025-2030 ($ million)
Data Table on Small independent distributor - Market size and forecast 2025-2030 ($ million)
Chart on Small independent distributor - Year-over-year growth 2025-2030 (%)
Data Table on Small independent distributor - Year-over-year growth 2025-2030 (%)

10.6 Market opportunity by Distribution Channel

Market opportunity by Distribution Channel ($ million)
Data Table on Market opportunity by Distribution Channel ($ million)

11. Customer Landscape

11.1 Customer landscape overview

Analysis of price sensitivity, lifecycle, customer purchase basket, adoption rates, and purchase criteria

12. Geographic Landscape

12.1 Geographic segmentation

Chart on Market share by geography 2025-2030 (%)
Data Table on Market share by geography 2025-2030 (%)

12.2 Geographic comparison

Chart on Geographic comparison
Data Table on Geographic comparison

12.3 APAC - Market size and forecast 2025-2030

Chart on APAC - Market size and forecast 2025-2030 ($ million)
Data Table on APAC - Market size and forecast 2025-2030 ($ million)
Chart on APAC - Year-over-year growth 2025-2030 (%)
Data Table on APAC - Year-over-year growth 2025-2030 (%)
Chart on Regional Comparison - APAC
Data Table on Regional Comparison - APAC

12.3.1 Singapore - Market size and forecast 2025-2030

Chart on Singapore - Market size and forecast 2025-2030 ($ million)
Data Table on Singapore - Market size and forecast 2025-2030 ($ million)
Chart on Singapore - Year-over-year growth 2025-2030 (%)
Data Table on Singapore - Year-over-year growth 2025-2030 (%)

12.3.2 China - Market size and forecast 2025-2030

Chart on China - Market size and forecast 2025-2030 ($ million)
Data Table on China - Market size and forecast 2025-2030 ($ million)
Chart on China - Year-over-year growth 2025-2030 (%)
Data Table on China - Year-over-year growth 2025-2030 (%)

12.3.3 Japan - Market size and forecast 2025-2030

Chart on Japan - Market size and forecast 2025-2030 ($ million)
Data Table on Japan - Market size and forecast 2025-2030 ($ million)
Chart on Japan - Year-over-year growth 2025-2030 (%)
Data Table on Japan - Year-over-year growth 2025-2030 (%)

12.3.4 South Korea - Market size and forecast 2025-2030

Chart on South Korea - Market size and forecast 2025-2030 ($ million)
Data Table on South Korea - Market size and forecast 2025-2030 ($ million)
Chart on South Korea - Year-over-year growth 2025-2030 (%)
Data Table on South Korea - Year-over-year growth 2025-2030 (%)

12.3.5 India - Market size and forecast 2025-2030

Chart on India - Market size and forecast 2025-2030 ($ million)
Data Table on India - Market size and forecast 2025-2030 ($ million)
Chart on India - Year-over-year growth 2025-2030 (%)
Data Table on India - Year-over-year growth 2025-2030 (%)

12.3.6 Indonesia - Market size and forecast 2025-2030

Chart on Indonesia - Market size and forecast 2025-2030 ($ million)
Data Table on Indonesia - Market size and forecast 2025-2030 ($ million)
Chart on Indonesia - Year-over-year growth 2025-2030 (%)
Data Table on Indonesia - Year-over-year growth 2025-2030 (%)

12.4 Europe - Market size and forecast 2025-2030

Chart on Europe - Market size and forecast 2025-2030 ($ million)
Data Table on Europe - Market size and forecast 2025-2030 ($ million)
Chart on Europe - Year-over-year growth 2025-2030 (%)
Data Table on Europe - Year-over-year growth 2025-2030 (%)
Chart on Regional Comparison - Europe
Data Table on Regional Comparison - Europe

12.4.1 Germany - Market size and forecast 2025-2030

Chart on Germany - Market size and forecast 2025-2030 ($ million)
Data Table on Germany - Market size and forecast 2025-2030 ($ million)
Chart on Germany - Year-over-year growth 2025-2030 (%)
Data Table on Germany - Year-over-year growth 2025-2030 (%)

12.4.2 The Netherlands - Market size and forecast 2025-2030

Chart on The Netherlands - Market size and forecast 2025-2030 ($ million)
Data Table on The Netherlands - Market size and forecast 2025-2030 ($ million)
Chart on The Netherlands - Year-over-year growth 2025-2030 (%)
Data Table on The Netherlands - Year-over-year growth 2025-2030 (%)

12.4.3 UK - Market size and forecast 2025-2030

Chart on UK - Market size and forecast 2025-2030 ($ million)
Data Table on UK - Market size and forecast 2025-2030 ($ million)
Chart on UK - Year-over-year growth 2025-2030 (%)
Data Table on UK - Year-over-year growth 2025-2030 (%)

12.4.4 France - Market size and forecast 2025-2030

Chart on France - Market size and forecast 2025-2030 ($ million)
Data Table on France - Market size and forecast 2025-2030 ($ million)
Chart on France - Year-over-year growth 2025-2030 (%)
Data Table on France - Year-over-year growth 2025-2030 (%)

12.4.5 Spain - Market size and forecast 2025-2030

Chart on Spain - Market size and forecast 2025-2030 ($ million)
Data Table on Spain - Market size and forecast 2025-2030 ($ million)
Chart on Spain - Year-over-year growth 2025-2030 (%)
Data Table on Spain - Year-over-year growth 2025-2030 (%)

12.4.6 Italy - Market size and forecast 2025-2030

Chart on Italy - Market size and forecast 2025-2030 ($ million)
Data Table on Italy - Market size and forecast 2025-2030 ($ million)
Chart on Italy - Year-over-year growth 2025-2030 (%)
Data Table on Italy - Year-over-year growth 2025-2030 (%)

12.5 Middle East and Africa - Market size and forecast 2025-2030

Chart on Middle East and Africa - Market size and forecast 2025-2030 ($ million)
Data Table on Middle East and Africa - Market size and forecast 2025-2030 ($ million)
Chart on Middle East and Africa - Year-over-year growth 2025-2030 (%)
Data Table on Middle East and Africa - Year-over-year growth 2025-2030 (%)
Chart on Regional Comparison - Middle East and Africa
Data Table on Regional Comparison - Middle East and Africa

12.5.1 UAE - Market size and forecast 2025-2030

Chart on UAE - Market size and forecast 2025-2030 ($ million)
Data Table on UAE - Market size and forecast 2025-2030 ($ million)
Chart on UAE - Year-over-year growth 2025-2030 (%)
Data Table on UAE - Year-over-year growth 2025-2030 (%)

12.5.2 Saudi Arabia - Market size and forecast 2025-2030

Chart on Saudi Arabia - Market size and forecast 2025-2030 ($ million)
Data Table on Saudi Arabia - Market size and forecast 2025-2030 ($ million)
Chart on Saudi Arabia - Year-over-year growth 2025-2030 (%)
Data Table on Saudi Arabia - Year-over-year growth 2025-2030 (%)

12.5.3 South Africa - Market size and forecast 2025-2030

Chart on South Africa - Market size and forecast 2025-2030 ($ million)
Data Table on South Africa - Market size and forecast 2025-2030 ($ million)
Chart on South Africa - Year-over-year growth 2025-2030 (%)
Data Table on South Africa - Year-over-year growth 2025-2030 (%)

12.5.4 Qatar - Market size and forecast 2025-2030

Chart on Qatar - Market size and forecast 2025-2030 ($ million)
Data Table on Qatar - Market size and forecast 2025-2030 ($ million)
Chart on Qatar - Year-over-year growth 2025-2030 (%)
Data Table on Qatar - Year-over-year growth 2025-2030 (%)

12.5.5 Egypt - Market size and forecast 2025-2030

Chart on Egypt - Market size and forecast 2025-2030 ($ million)
Data Table on Egypt - Market size and forecast 2025-2030 ($ million)
Chart on Egypt - Year-over-year growth 2025-2030 (%)
Data Table on Egypt - Year-over-year growth 2025-2030 (%)

12.6 North America - Market size and forecast 2025-2030

Chart on North America - Market size and forecast 2025-2030 ($ million)
Data Table on North America - Market size and forecast 2025-2030 ($ million)
Chart on North America - Year-over-year growth 2025-2030 (%)
Data Table on North America - Year-over-year growth 2025-2030 (%)
Chart on Regional Comparison - North America
Data Table on Regional Comparison - North America

12.6.1 US - Market size and forecast 2025-2030

Chart on US - Market size and forecast 2025-2030 ($ million)
Data Table on US - Market size and forecast 2025-2030 ($ million)
Chart on US - Year-over-year growth 2025-2030 (%)
Data Table on US - Year-over-year growth 2025-2030 (%)

12.6.2 Canada - Market size and forecast 2025-2030

Chart on Canada - Market size and forecast 2025-2030 ($ million)
Data Table on Canada - Market size and forecast 2025-2030 ($ million)
Chart on Canada - Year-over-year growth 2025-2030 (%)
Data Table on Canada - Year-over-year growth 2025-2030 (%)

12.6.3 Mexico - Market size and forecast 2025-2030

Chart on Mexico - Market size and forecast 2025-2030 ($ million)
Data Table on Mexico - Market size and forecast 2025-2030 ($ million)
Chart on Mexico - Year-over-year growth 2025-2030 (%)
Data Table on Mexico - Year-over-year growth 2025-2030 (%)

12.7 South America - Market size and forecast 2025-2030

Chart on South America - Market size and forecast 2025-2030 ($ million)
Data Table on South America - Market size and forecast 2025-2030 ($ million)
Chart on South America - Year-over-year growth 2025-2030 (%)
Data Table on South America - Year-over-year growth 2025-2030 (%)
Chart on Regional Comparison - South America
Data Table on Regional Comparison - South America

12.7.1 Brazil - Market size and forecast 2025-2030

Chart on Brazil - Market size and forecast 2025-2030 ($ million)
Data Table on Brazil - Market size and forecast 2025-2030 ($ million)
Chart on Brazil - Year-over-year growth 2025-2030 (%)
Data Table on Brazil - Year-over-year growth 2025-2030 (%)

12.7.2 Chile - Market size and forecast 2025-2030

Chart on Chile - Market size and forecast 2025-2030 ($ million)
Data Table on Chile - Market size and forecast 2025-2030 ($ million)
Chart on Chile - Year-over-year growth 2025-2030 (%)
Data Table on Chile - Year-over-year growth 2025-2030 (%)

12.7.3 Argentina - Market size and forecast 2025-2030

Chart on Argentina - Market size and forecast 2025-2030 ($ million)
Data Table on Argentina - Market size and forecast 2025-2030 ($ million)
Chart on Argentina - Year-over-year growth 2025-2030 (%)
Data Table on Argentina - Year-over-year growth 2025-2030 (%)

12.8 Market opportunity by geography

Market opportunity by geography ($ million)
Data Tables on Market opportunity by geography ($ million)

13. Drivers, Challenges, and Opportunity

13.1 Market drivers

Implementation of rigorous decarbonization mandates and standards
Rapid expansion of dual-fuel merchant fleet
Strategic development of alternative fuel infrastructure

13.2 Market challenges

Regulatory fragmentation and carbon pricing disparities
Infrastructure deficits and feedstock scarcity for alternative fuels
Geopolitical instability and supply chain dislocation

13.3 Impact of drivers and challenges

Impact of drivers and challenges in 2025 and 2030

13.4 Market opportunities

Digitalization of bunker supply chain and electronic verification
Proliferation of green maritime corridors
Mainstreaming of bio-blending and mass balance solutions

14. Competitive Landscape

14.1 Overview

14.2

Overview on criticality of inputs and factors of differentiation

14.3 Landscape disruption

Overview on factors of disruption

14.4 Industry risks

Impact of key risks on business

15. Competitive Analysis

15.1 Companies profiled

Companies covered

15.2 Company ranking index

15.3 Market positioning of companies

Matrix on companies position and classification

15.4 Aegis Logistics Ltd.

Aegis Logistics Ltd. - Overview
Aegis Logistics Ltd. - Business segments
Aegis Logistics Ltd. - Key offerings
Aegis Logistics Ltd. - Segment focus
SWOT

15.5 Bunker Oil AS

Bunker Oil AS - Overview
Bunker Oil AS - Product / Service
Bunker Oil AS - Key offerings
SWOT

15.6 Chevron Corp.

Chevron Corp. - Overview
Chevron Corp. - Business segments
Chevron Corp. - Key news
Chevron Corp. - Key offerings
Chevron Corp. - Segment focus
SWOT

15.7 Eni SpA

Eni SpA - Overview
Eni SpA - Business segments
Eni SpA - Key news
Eni SpA - Key offerings
Eni SpA - Segment focus
SWOT

15.8 Exxon Mobil Corp.

Exxon Mobil Corp. - Overview
Exxon Mobil Corp. - Business segments
Exxon Mobil Corp. - Key offerings
Exxon Mobil Corp. - Segment focus
SWOT

15.9 Gulf Agency Co. Ltd.

Gulf Agency Co. Ltd. - Overview
Gulf Agency Co. Ltd. - Product / Service
Gulf Agency Co. Ltd. - Key offerings
SWOT

15.10 Hindustan Petroleum Corp. Ltd.

Hindustan Petroleum Corp. Ltd. - Overview
Hindustan Petroleum Corp. Ltd. - Business segments
Hindustan Petroleum Corp. Ltd. - Key news
Hindustan Petroleum Corp. Ltd. - Key offerings
Hindustan Petroleum Corp. Ltd. - Segment focus
SWOT

15.11 Indian Oil Corp. Ltd.

Indian Oil Corp. Ltd. - Overview
Indian Oil Corp. Ltd. - Business segments
Indian Oil Corp. Ltd. - Key news
Indian Oil Corp. Ltd. - Key offerings
Indian Oil Corp. Ltd. - Segment focus
SWOT

15.12 Maritime Optima

Maritime Optima - Overview
Maritime Optima - Product / Service
Maritime Optima - Key offerings
SWOT

15.13 Petroliam Nasional Berhad

Petroliam Nasional Berhad - Overview
Petroliam Nasional Berhad - Business segments
Petroliam Nasional Berhad - Key offerings
Petroliam Nasional Berhad - Segment focus
SWOT

15.14 Shell plc

Shell plc - Overview
Shell plc - Business segments
Shell plc - Key news
Shell plc - Key offerings
Shell plc - Segment focus
SWOT

15.15 Shiny Shipping and Logistics Pvt Ltd

Shiny Shipping and Logistics Pvt Ltd - Overview
Shiny Shipping and Logistics Pvt Ltd - Product / Service
Shiny Shipping and Logistics Pvt Ltd - Key offerings
SWOT

15.16 ShipServ Limited

ShipServ Limited - Overview
ShipServ Limited - Product / Service
ShipServ Limited - Key offerings
SWOT

15.17 TotalEnergies SE

TotalEnergies SE - Overview
TotalEnergies SE - Business segments
TotalEnergies SE - Key news
TotalEnergies SE - Key offerings
TotalEnergies SE - Segment focus
SWOT

15.18 Vizag Chemical International

Vizag Chemical International - Overview
Vizag Chemical International - Product / Service
Vizag Chemical International - Key offerings
SWOT

16. Appendix

16.1 Scope of the report

Market definition
Objectives
Notes and caveats

16.2 Inclusions and exclusions checklist

Inclusions checklist
Exclusions checklist

16.3 Currency conversion rates for US$

16.4 Research methodology

16.5 Data procurement

Information sources

16.6 Data validation

16.7 Validation techniques employed for market sizing

16.8 Data synthesis

16.9 360 degree market analysis

16.10 List of abbreviations

Research Methodology

Technavio presents a detailed picture of the market by way of study, synthesis, and summation of data from multiple sources. The analysts have presented the various facets of the market with a particular focus on identifying the key industry influencers. The data thus presented is comprehensive, reliable, and the result of extensive research, both primary and secondary.

INFORMATION SOURCES

Primary sources

  • Manufacturers and suppliers
  • Channel partners
  • Industry experts
  • Strategic decision makers

Secondary sources

  • Industry journals and periodicals
  • Government data
  • Financial reports of key industry players
  • Historical data
  • Press releases

DATA ANALYSIS

Data Synthesis

  • Collation of data
  • Estimation of key figures
  • Analysis of derived insights

Data Validation

  • Triangulation with data models
  • Reference against proprietary databases
  • Corroboration with industry experts

REPORT WRITING

Qualitative

  • Market drivers
  • Market challenges
  • Market trends
  • Five forces analysis

Quantitative

  • Market size and forecast
  • Market segmentation
  • Geographical insights
  • Competitive landscape

Interested in this report?

Get your sample now to see our research methodology and insights!

Download Now

Frequently Asked Questions

Bunker Fuel market growth will increase by USD 36141.0 million during 2026-2030.

The Bunker Fuel market is expected to grow at a CAGR of 4.6% during 2026-2030.

Bunker Fuel market is segmented by Type (MGO, HSFO, VLSFO) Application (Container, Bulk carrier, Oil tanker, General cargo, Chemical tanker) Distribution channel (IOC or NOC, Large independent distributor, Small independent distributor)

Aegis Logistics Ltd., Bunker Oil AS, Chevron Corp., Eni SpA, Exxon Mobil Corp., Gulf Agency Co. Ltd., Hindustan Petroleum Corp. Ltd., Indian Oil Corp. Ltd., Maritime Optima, Petroliam Nasional Berhad, Shell plc, Shiny Shipping and Logistics Pvt Ltd, ShipServ Limited, TotalEnergies SE, Vizag Chemical International are a few of the key vendors in the Bunker Fuel market.

APAC will register the highest growth rate of 39.5% among the other regions. Therefore, the Bunker Fuel market in APAC is expected to garner significant business opportunities for the vendors during the forecast period.

Singapore, China, Japan, South Korea, India, Indonesia, Germany, The Netherlands, UK, France, Spain, Italy, UAE, Saudi Arabia, South Africa, Qatar, Egypt, US, Canada, Mexico, Brazil, Chile, Argentina

  • Implementation of rigorous decarbonization mandates and standards is the driving factor this market.

The Bunker Fuel market vendors should focus on grabbing business opportunities from the Type segment as it accounted for the largest market share in the base year.