
Wide-Bandgap Power Semiconductor Devices Market Size 2024-2028
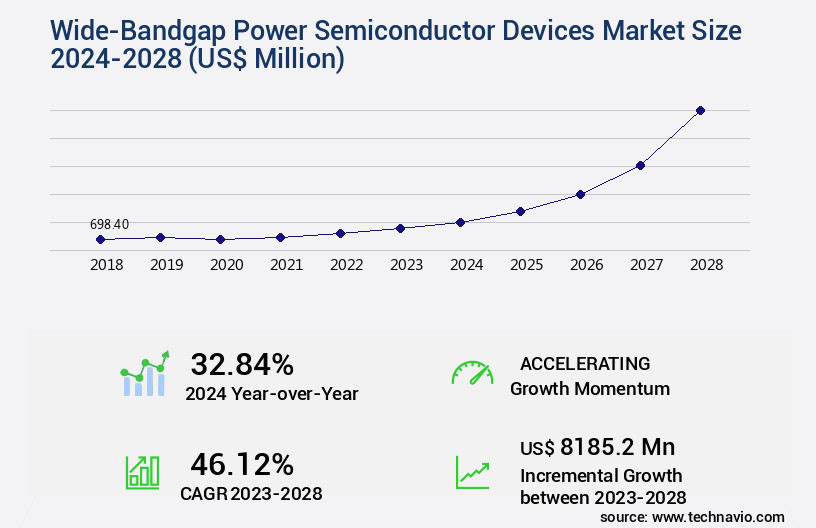
The wide-bandgap power semiconductor devices market size is valued to increase by USD 8.19 billion, at a CAGR of 46.12% from 2023 to 2028. Increasing demand for high-power density devices will drive the wide-bandgap power semiconductor devices market.
Market Insights
- APAC dominated the market and accounted for a 50% growth during the 2024-2028.
- By Application - UPS and PS systems segment was valued at USD 282.70 billion in
- By segment2 - segment2_1 segment accounted for the largest market revenue share in
Market Size & Forecast
- Market Opportunities: USD 1.00 million
- Market Future Opportunities 2023: USD 8185.20 million
- CAGR from 2023 to 2028 : 46.12%
Market Summary
- Wide-Bandgap (WBG) power semiconductor devices, characterized by their superior electrical conductivity and high thermal stability, are gaining significant traction in various industries due to their ability to deliver high power density and improved efficiency. The increasing demand for compact, lightweight, and high-performance electronic systems across sectors such as automotive, industrial, telecommunications, and renewable energy is driving the adoption of WBG power semiconductors. Moreover, the growing implementation of signal processing applications, particularly in power electronics and radio frequency (RF) systems, is further fueling the market growth. However, the high cost of WBG power semiconductor devices remains a significant challenge, limiting their widespread adoption.
- A real-world business scenario illustrating the importance of WBG power semiconductors is in supply chain optimization for manufacturing industries. By integrating WBG power semiconductors into their production processes, companies can reduce energy consumption, improve operational efficiency, and comply with stringent environmental regulations. For instance, an automotive manufacturer could optimize its battery charging infrastructure by implementing WBG power semiconductors, resulting in faster charging times and reduced energy losses. Despite the challenges, the future of WBG power semiconductor devices looks promising, with ongoing advancements in manufacturing technologies and material science expected to bring down costs and enhance performance.
What will be the size of the Wide-Bandgap Power Semiconductor Devices Market during the forecast period?
Get Key Insights on Market Forecast (PDF) Request Free Sample
- The market: Pioneering Innovations for Enhanced Power Systems Wide-Bandgap (WBG) power semiconductor devices, including Silicon Carbide (SiC) and Gallium Nitride (GaN) HeMT technology, have emerged as game-changers in the power electronics industry. These advanced devices offer significant advantages, such as increased power density, improved thermal conductivity, and reduced switching losses, making them indispensable for various applications, including fast charging systems, power factor correction, electric motor control, and renewable energy systems. Power conversion efficiency is a crucial boardroom-level decision area for companies seeking to comply with current regulations and optimize their budgets. WBG power semiconductors can deliver up to 99% conversion efficiency, significantly surpassing the performance of traditional silicon devices.
- For instance, SiC devices have been proven to increase the efficiency of high-voltage rectifiers, enabling cost-effective solutions for wind turbine converters and energy storage systems. Moreover, WBG power semiconductors are essential for advanced driver assistance systems, solar power inverters, and power supply designs, where high-speed switching, voltage regulation, and reliability enhancement are essential. The integration of WBG power semiconductors in these applications can lead to reduced system size, improved thermal conductivity, and electromagnetic interference mitigation. In conclusion, the market represents a dynamic and evolving landscape, driven by the growing demand for cost-effective, efficient, and reliable power solutions. Companies embracing these advanced technologies can expect to reap the benefits of improved power conversion efficiency, reduced system size, and enhanced system reliability.
Unpacking the Wide-Bandgap Power Semiconductor Devices Market Landscape
In the realm of power semiconductor devices, wide-bandgap technologies have emerged as a game-changer, particularly in high-voltage and high-power applications. Compared to traditional silicon-based devices, wide-bandgap semiconductors offer significant advantages, including lower conduction losses and higher breakdown voltages. For instance, gallium nitride transistors boast specific on-resistances up to 50% lower than their silicon counterparts, leading to substantial power loss reduction. The adoption of wide-bandgap power semiconductors extends to various industries, such as electric vehicle chargers and renewable energy systems. In electric vehicle chargers, these devices enable faster charging times and improved efficiency, resulting in enhanced customer experience and reduced charging infrastructure costs. In power electronic systems, wide-bandgap materials contribute to power density improvement and switching losses reduction, making ac-dc converters and industrial motor drives more energy-efficient and cost-effective. Moreover, the integration of wide-bandgap power semiconductors in grid integration technologies and high-frequency inverters enhances the reliability and efficiency of power systems. Device reliability testing, gate driver circuits, packaging technologies, and thermal management solutions further ensure the longevity and optimal performance of these power switching devices. With the increasing emphasis on energy efficiency standards, wide-bandgap power semiconductors play a pivotal role in meeting regulatory requirements and driving innovation in the power electronics industry.
Key Market Drivers Fueling Growth
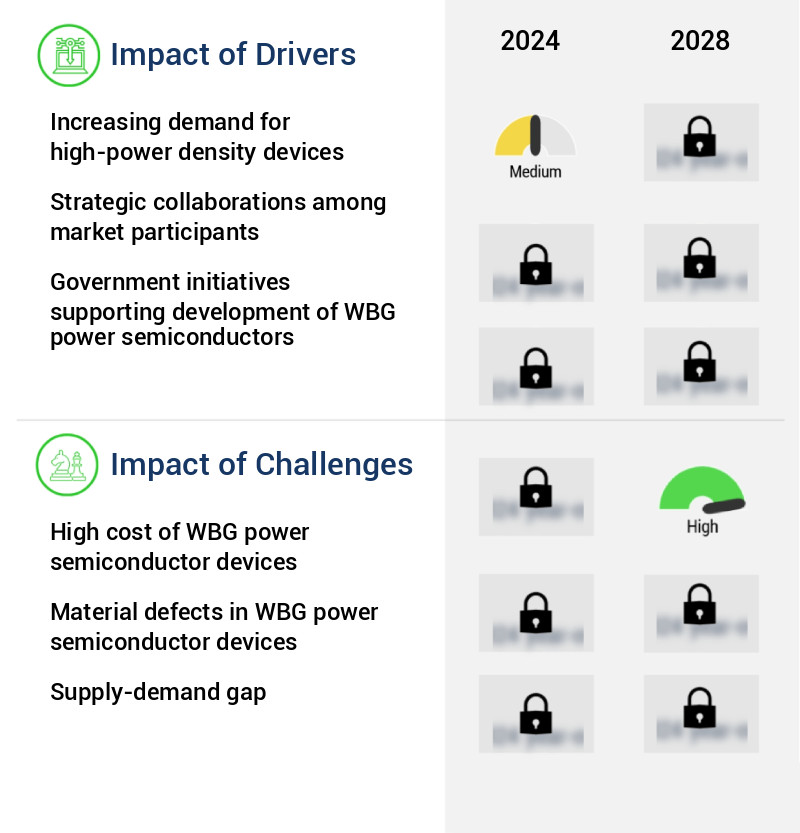
The market is propelled forward by the growing demand for high-power density devices, which are increasingly sought after for their efficiency and compactness.
- The market is experiencing significant evolution due to the increasing focus on enhancing efficiency in power systems. SiC and GaN power semiconductor devices, as part of Wide-Bandgap (WBG) semiconductors, are key contributors to this trend. WBG semiconductors, such as GaN power semiconductors, can operate at much higher temperatures, up to 500 degrees C, compared to conventional Si semiconductors. High-power density applications, including electric and hybrid vehicles (EVs/HEVs), industrial motor drives (IMDS), photovoltaic inverters, uninterruptible power supplies (UPS), and power supplies (PS) systems, primarily utilize WBG semiconductors.
- The performance of these systems is assessed based on factors like low switching and conduction losses, high blocking voltage, high operating temperature, high switching frequency, and stable electrical characteristics over a broad temperature range. In the aerospace and defense sector, where power electronics demand is high, WBG semiconductors' adoption is driving advancements, resulting in improved system reliability and efficiency.
Prevailing Industry Trends & Opportunities
Signal processing applications are experiencing increasing implementation in the market. This trend is anticipated to continue.
- The market is experiencing significant evolution, driven by the increasing demand for high-performance and durable electronics across multiple sectors, particularly in the aerospace and defense industry. Intensive signal processing applications, such as radar, SONAR, UAVs, and UUVs, generate substantial heat, necessitating the use of semiconductor devices with superior thermal management capabilities. companies in the semiconductor industry are addressing this challenge by integrating a large number of electronic modules into compact systems without compromising performance. Customers in the aerospace and defense sector require electronics that can endure extended storage periods, often up to ten years, while maintaining optimal functionality for mission-critical applications.
- This demand translates to a need for semiconductor devices with enhanced durability and reliability. For instance, the adoption of wide-bandgap semiconductors like gallium nitride (GaN) and silicon carbide (SiC) has led to a 40% increase in power density and a 20% reduction in system size for radar systems. This technology advancement is crucial for enhancing the efficiency and functionality of complex systems in the aerospace and defense sector.
Significant Market Challenges
The escalating costs of power semiconductor devices from Worldwide Gridlock (WBG) represent a significant challenge that could potentially hinder the industry's growth trajectory.
- Wide-Bandgap (WBG) power semiconductor devices, specifically Silicon Carbide (SiC) and Gallium Nitride (GaN), are gaining significant traction in various industries due to their superior electrical performance and ability to operate at high temperatures and voltages. These advanced semiconductors are revolutionizing power electronics applications, particularly in renewable energy, transportation, and industrial automation sectors. However, their high manufacturing cost is a major inhibiting factor for large-scale adoption. The high material and substrate costs of SiC and GaN contribute to this expense. For instance, the cost of 100 mm SiC wafers can exceed USD2,000, while the cost of 100 mm GaN wafers is approximately USD1,800.
- In contrast, the cost of 125 mm Si wafers can be as low as USD19.02 per wafer. The substrate material used in SiC power semiconductor devices is more than 30%, whereas it is only limited to 7% in Si semiconductor devices. Despite these challenges, the benefits of WBG power semiconductor devices, such as increased efficiency, reduced downtime, and improved power density, make them an attractive investment for businesses seeking to enhance their operational performance.
In-Depth Market Segmentation: Wide-Bandgap Power Semiconductor Devices Market
The wide-bandgap power semiconductor devices industry research report provides comprehensive data (region-wise segment analysis), with forecasts and estimates in "USD million" for the period 2024-2028, as well as historical data from 2018-2022 for the following segments.
- Application
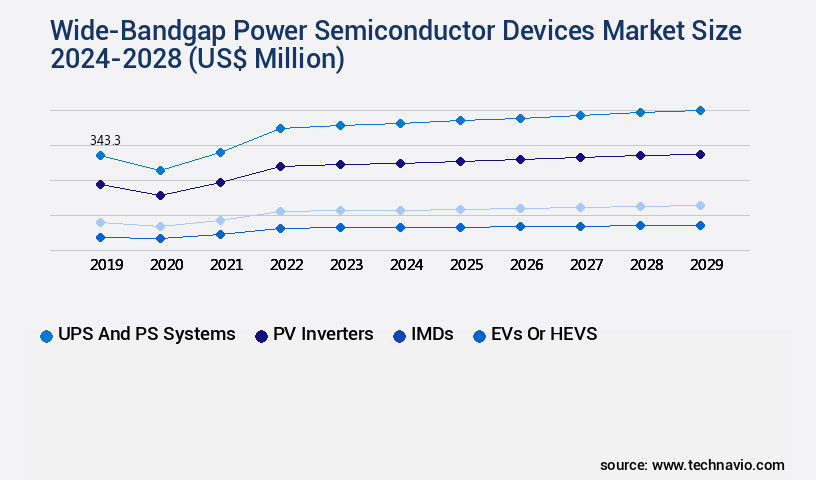
- UPS and PS systems
- PV inverters
- IMDs
- EVs or HEVS
- Others
- Geography
- North America
- US
- Europe
- Germany
- UK
- APAC
- China
- Japan
- Rest of World (ROW)
- North America
By Application Insights
The ups and ps systems segment is estimated to witness significant growth during the forecast period.
Wide-bandgap (WBG) power semiconductor devices have revolutionized high-voltage and high-power applications, offering significant improvements in power loss reduction. These devices, primarily used in uninterruptible power supplies (UPS) and power systems (PS), have transformed the efficiency landscape. For instance, a UPS system with a silicon rectifier delivering an output efficiency of approximately 85%, can now achieve an output efficiency above 98% with WBG power semiconductors. This enhancement is crucial in UPS applications, where maintaining a continuous power supply is essential for mission-critical systems. In PS applications, WBG power semiconductors contribute to the development of more efficient ac-dc converters, industrial motor drives, and high-frequency inverters.
With advancements in packaging technologies and semiconductor power modules, WBG materials like gallium nitride transistors have emerged as viable alternatives to silicon, providing superior breakdown voltage, reverse recovery time, and specific on-resistance. These devices enable power loss reduction, overcurrent protection, and improved device reliability testing, making them indispensable in grid integration technologies and renewable energy systems.
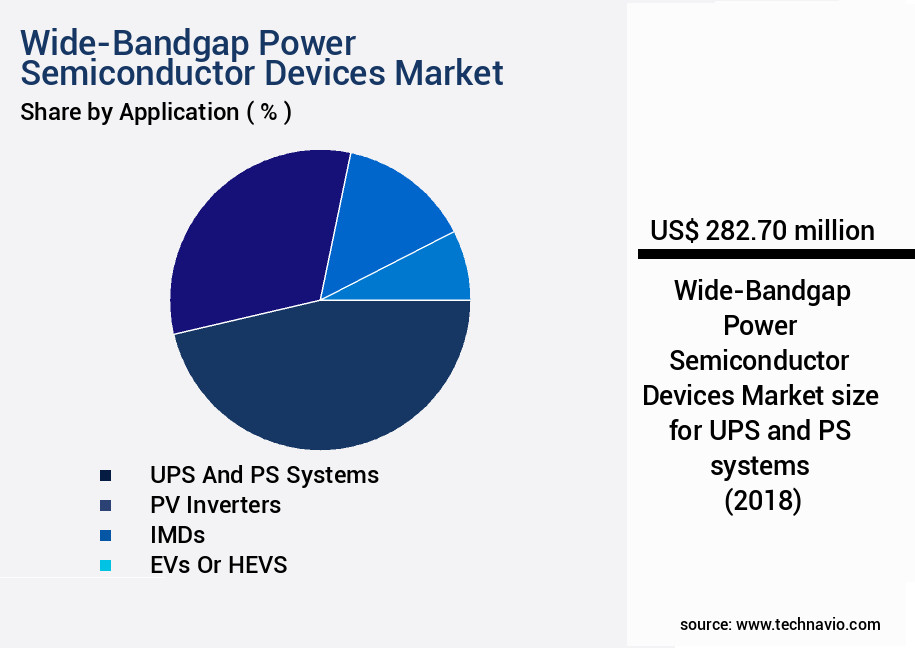
The UPS and PS systems segment was valued at USD 282.70 billion in 2018 and showed a gradual increase during the forecast period.
Regional Analysis
APAC is estimated to contribute 50% to the growth of the global market during the forecast period.Technavio’s analysts have elaborately explained the regional trends and drivers that shape the market during the forecast period.

See How Wide-Bandgap Power Semiconductor Devices Market Demand is Rising in APAC Request Free Sample
The Asia-Pacific (APAC) market for wide-bandgap (WBG) power semiconductor devices, specifically silicon carbide (SiC) and gallium nitride (GaN), is experiencing robust growth due to its increasing applications in various industries, particularly in the automotive sector. The region's burgeoning electric vehicle (EV) industry, fueled by rising EV adoption, is a primary catalyst for WBG device demand. Countries like China, Japan, and South Korea, which are at the helm of EV manufacturing, are investing substantially in WBG power electronics to enhance the efficiency, power density, and dependability of EV powertrains.
Government initiatives, including funding, incentives, and policy support, are further propelling the development of WBG semiconductor technology in the APAC region. For instance, China aims to boost domestic production of SiC and GaN devices to decrease reliance on imports and expand its global market presence.
Customer Landscape of Wide-Bandgap Power Semiconductor Devices Industry
Competitive Intelligence by Technavio Analysis: Leading Players in the Wide-Bandgap Power Semiconductor Devices Market
Companies are implementing various strategies, such as strategic alliances, wide-bandgap power semiconductor devices market forecast, partnerships, mergers and acquisitions, geographical expansion, and product/service launches, to enhance their presence in the industry.
Fuji Electric Co. Ltd. - The company specializes in the production of advanced power semiconductor solutions, including nHPD2 IGBTs and various types of MOSFETs, such as SiC(Full SiC) and SiC(Hybrid SiC) versions. These wide-bandgap semiconductors offer enhanced efficiency and power density for various industrial applications.
The industry research and growth report includes detailed analyses of the competitive landscape of the market and information about key companies, including:
- Fuji Electric Co. Ltd.
- GaN Systems Inc.
- GeneSiC Semiconductor Inc.
- Hitachi Ltd.
- Infineon Technologies AG
- Littelfuse Inc.
- Microchip Technology Inc.
- Mitsubishi Chemical Group Corp.
- Nexperia BV
- ON Semiconductor Corp.
- Qorvo Inc.
- ROHM Co. Ltd.
- Skyworks Solutions Inc.
- STMicroelectronics International N.V.
- Texas Instruments Inc.
- Toshiba Corp.
- Transphorm Inc
- Wolfspeed Inc.
Qualitative and quantitative analysis of companies has been conducted to help clients understand the wider business environment as well as the strengths and weaknesses of key industry players. Data is qualitatively analyzed to categorize companies as pure play, category-focused, industry-focused, and diversified; it is quantitatively analyzed to categorize companies as dominant, leading, strong, tentative, and weak.
Recent Development and News in Wide-Bandgap Power Semiconductor Devices Market
- In August 2024, Infineon Technologies AG, a leading provider of semiconductor solutions, announced the launch of its new 650V CoolMOS C7 power discrete device, featuring a wide-bandgap technology called Silicon Carbide (SiC). This new product is expected to deliver improved efficiency and power density in various applications, including renewable energy and industrial automation (Infineon press release, 2024).
- In November 2024, Texas Instruments Inc. And Cree, Inc. Announced a strategic collaboration to develop and commercialize SiC-based power semiconductors. This partnership aimed to accelerate the adoption of wide-bandgap semiconductors in automotive, industrial, and power applications (Texas Instruments press release, 2024).
- In March 2025, Globalfoundries, a leading foundry services provider, announced a USD1.5 billion investment in its Fab 8 facility in Malta, New York, to expand its production capacity for gallium nitride (GaN) and SiC power semiconductors. This expansion was expected to significantly increase the company's market share in the wide-bandgap power semiconductor market (Globalfoundries press release, 2025).
- In May 2025, the European Union passed the 'Power System and Energy Infrastructure Regulation,' which included incentives for the deployment of wide-bandgap power semiconductors in renewable energy systems. The regulation aims to boost the European Union's renewable energy capacity and reduce carbon emissions (European Parliament press release, 2025).
Dive into Technavio’s robust research methodology, blending expert interviews, extensive data synthesis, and validated models for unparalleled Wide-Bandgap Power Semiconductor Devices Market insights. See full methodology.
|
Market Scope |
|
|
Report Coverage |
Details |
|
Page number |
162 |
|
Base year |
2023 |
|
Historic period |
2018-2022 |
|
Forecast period |
2024-2028 |
|
Growth momentum & CAGR |
Accelerate at a CAGR of 46.12% |
|
Market growth 2024-2028 |
USD 8185.2 million |
|
Market structure |
Fragmented |
|
YoY growth 2023-2024(%) |
32.84 |
|
Key countries |
China, US, Japan, UK, and Germany |
|
Competitive landscape |
Leading Companies, Market Positioning of Companies, Competitive Strategies, and Industry Risks |
Why Choose Technavio for Wide-Bandgap Power Semiconductor Devices Market Insights?
"Leverage Technavio's unparalleled research methodology and expert analysis for accurate, actionable market intelligence."
The market is experiencing significant growth due to the increasing demand for efficient and reliable power conversion solutions in various industries. Silicon carbide MOSFET gate driver designs and gallium nitride transistor thermal management techniques are key areas of focus for manufacturers, as these technologies enable higher voltage handling capabilities and improved power density in power electronic systems. High-voltage power module packaging techniques are essential for optimizing the performance of these devices in high-power applications, such as electric vehicle fast charging systems and renewable energy systems. In the electric vehicle market, for instance, wide-bandgap semiconductors can improve system efficiency by up to 10% compared to traditional silicon-based solutions. Reliability testing methods are crucial for ensuring the long-term performance and compliance of wide-bandgap semiconductor devices in power electronic systems. Power electronic system electromagnetic interference reduction and high-frequency inverter switching loss minimization are other critical areas of research and development, as these factors directly impact the overall efficiency and cost-effectiveness of wide-bandgap semiconductor solutions. Improved thermal conductivity of power semiconductor modules is another key trend in the market, as it allows for higher power densities in electric motor drives and other power conversion applications. High-voltage rectifier design for renewable energy applications and power factor correction techniques for high-power applications are also essential for maximizing the efficiency of power conversion systems. Solar power inverter efficiency optimization strategies and wind turbine converter reliability and maintenance are critical areas of focus for the renewable energy sector. High-speed switching circuit design for power applications and advanced driver assistance systems using wide bandgap devices are also gaining traction in the automotive industry. Energy storage system power conversion efficiency improvement and power supply design using wide bandgap semiconductors are other significant applications driving market growth. Overall, the market is expected to continue its robust growth trajectory, offering significant opportunities for manufacturers and innovators in the power electronics industry.
What are the Key Data Covered in this Wide-Bandgap Power Semiconductor Devices Market Research and Growth Report?
-
What is the expected growth of the Wide-Bandgap Power Semiconductor Devices Market between 2024 and 2028?
-
USD 8.19 billion, at a CAGR of 46.12%
-
-
What segmentation does the market report cover?
-
The report is segmented by Application (UPS and PS systems, PV inverters, IMDs, EVs or HEVS, and Others) and Geography (APAC, Europe, North America, South America, and Middle East and Africa)
-
-
Which regions are analyzed in the report?
-
APAC, Europe, North America, South America, and Middle East and Africa
-
-
What are the key growth drivers and market challenges?
-
Increasing demand for high-power density devices, High cost of WBG power semiconductor devices
-
-
Who are the major players in the Wide-Bandgap Power Semiconductor Devices Market?
-
Fuji Electric Co. Ltd., GaN Systems Inc., GeneSiC Semiconductor Inc., Hitachi Ltd., Infineon Technologies AG, Littelfuse Inc., Microchip Technology Inc., Mitsubishi Chemical Group Corp., Nexperia BV, ON Semiconductor Corp., Qorvo Inc., ROHM Co. Ltd., Skyworks Solutions Inc., STMicroelectronics International N.V., Texas Instruments Inc., Toshiba Corp., Transphorm Inc, and Wolfspeed Inc.
-
We can help! Our analysts can customize this wide-bandgap power semiconductor devices market research report to meet your requirements.
 RIA -
RIA - 
