Wood Fuels Market Analysis, Size, and Forecast 2024-2028: North America (US and Canada), Europe (France, Germany, Italy, and UK), Middle East and Africa (Egypt, KSA, Oman, and UAE), APAC (China, India, and Japan), South America (Argentina and Brazil), and Rest of World (ROW)

Wood Fuels Market Analysis, Size, and Forecast 2024-2028:
North America (US and Canada), Europe (France, Germany, Italy, and UK), Middle East and Africa (Egypt, KSA, Oman, and UAE), APAC (China, India, and Japan), South America (Argentina and Brazil), and Rest of World (ROW)

Published: Dec 2023 149 Pages SKU: IRTNTR76768

Market Overview at a Glance

$9.79 B
Market Opportunity
10.27%
CAGR
9.53
YoY growth 2023-2024(%)

Wood Fuels Market Size 2024-2028

The wood fuels market size is forecast to increase by USD 9.79 billion at a CAGR of 10.27% between 2023 and 2028.

  • The market is experiencing significant shifts due to increasing regulations on carbon dioxide emissions and the declining use of coal in the power industry. These factors are driving the demand for renewable and sustainable energy sources, with wood fuels emerging as a viable alternative. The installation requirement for biomass boilers and feedstock storage systems further underscores this trend. However, challenges persist in the form of complex regulatory frameworks and the need for substantial upfront investments in infrastructure. These obstacles necessitate strategic planning and a strong understanding of the market dynamics to effectively capitalize on opportunities and navigate challenges. Companies seeking to enter or expand in the market must stay abreast of regulatory developments and explore innovative financing solutions to mitigate the initial investment burden.
  • By doing so, they can position themselves to benefit from the growing demand for sustainable energy sources and contribute to the transition towards a low-carbon economy.

What will be the Size of the Wood Fuels Market during the forecast period?

Wood Fuels Market Size

 Request Free Sample

  • The market continues to evolve, driven by various factors including renewable fuel mandates, residential heating needs, and carbon emissions reduction targets. Fuel blending with lignocellulosic biomass, wood pellets, and wood chips is increasingly popular in the energy sector, contributing to electricity generation and industrial heating. Sustainability standards and emission regulations shape market dynamics, influencing biomass certification and combustion efficiency. Energy management and smart grid integration are crucial for optimizing wood fuel usage, while wood processing techniques like pelletizing, wood chipping, and wood waste utilization enhance thermal efficiency. Sustainable energy sources, such as solar thermal and heat pumps, complement wood fuels in meeting energy demands.
  • Carbon capture and storage, as well as air pollution control, are essential considerations in the market. Forest residues and agricultural residues offer potential for expanding the biomass supply chain, ensuring a continuous fuel source. Government incentives and Energy Storage solutions further bolster market growth, making wood fuels a vital component of the renewable energy landscape.

How is this Wood Fuels Industry segmented?

The wood fuels industry research report provides comprehensive data (region-wise segment analysis), with forecasts and estimates in "USD billion" for the period 2024-2028, as well as historical data from 2018-2022 for the following segments.

  • Type
    • Wood pellets
    • Wood chips
    • Firewood
  • Application
    • Residential Heating
    • Industrial Power Generation
    • Commercial
  • Source
    • Forest Residues
    • Recycled Wood
    • Sawmill Byproducts
  • Distribution Channel
    • Direct Sales
    • Retail
    • Online Platforms
  • Geography
    • North America
      • US
      • Canada
    • Europe
      • France
      • Germany
      • Italy
      • UK
    • Middle East and Africa
      • Egypt
      • KSA
      • Oman
      • UAE
    • APAC
      • China
      • India
      • Japan
    • South America
      • Argentina
      • Brazil
    • Rest of World (ROW)

By Type Insights

The wood pellets segment is estimated to witness significant growth during the forecast period.

The market encompasses various segments, with wood pellets holding the largest share in 2023. Wood pellets, derived from sawdust or other woody biomass, are cylindrical in shape and used extensively in industrial boilers as an eco-friendly alternative to natural gas and coal. They are also employed in thermal and gasification Power Generation. Renewable energy promotion initiatives by governments and the increasing adoption of wood pellets as a fuel source in industries, particularly power, are driving the segment's growth. Sustainability standards and emission standards are crucial factors influencing the market. Lignocellulosic biomass, wood waste, forest residues, and agricultural residues are significant sources of wood fuels.

Wood processing, energy management, and smart grid technologies are essential for optimizing the wood fuels supply chain's efficiency and reducing environmental impact. Biomass certification and energy storage solutions ensure the sustainability of wood fuels and their compatibility with renewable energy systems. Heating systems, including pellet, log, and biomass boilers, as well as heat pumps, contribute to the market's growth. Wood drying, pelletizing, and carbon capture technologies enhance combustion efficiency and minimize air pollution. The energy sector's transition towards renewable energy sources and the increasing focus on sustainability are key trends shaping the market. Wood-fired power plants, biomass gasification, and biomass boilers are integral components of this transition.

Wood briquettes and wood chips are alternative wood fuel forms gaining popularity due to their thermal efficiency. Government incentives and subsidies for renewable energy and sustainable energy solutions further boost the market's growth. The market's future potential lies in the integration of wood fuels with solar thermal and electricity generation, as well as energy storage solutions.

Wood Fuels Market Size

Request Free Sample

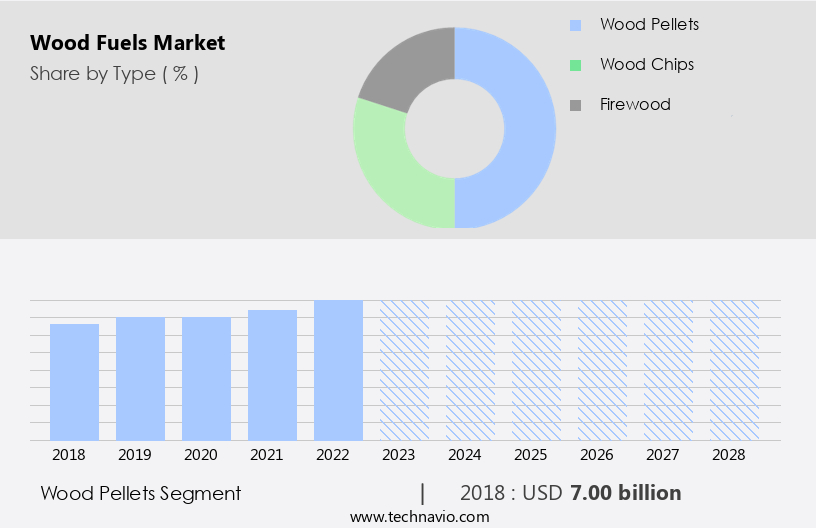
The Wood pellets segment was valued at USD 7.00 billion in 2018 and showed a gradual increase during the forecast period.

Regional Analysis

Europe is estimated to contribute 59% to the growth of the global market during the forecast period.Technavio's analysts have elaborately explained the regional trends and drivers that shape the market during the forecast period.

Wood Fuels Market Share by Geography

 Request Free Sample

The market is experiencing significant growth due to renewable fuel mandates and the need to reduce carbon emissions. European countries, in particular, are leading consumers of wood pellets, with the UK, Italy, Germany, Denmark, Sweden, France, and Belgium being the top consumers. Strict policies aimed at increasing the share of renewables in final energy consumption and mitigating climate change are driving this trend. Europe's dependence on fossil fuel imports and the constant fluctuation in oil prices have led to energy security concerns, making locally sourced wood fuels an attractive alternative. Wood processing, energy management, and smart grid technologies are also playing a role in the market's evolution.

Lignocellulosic biomass, wood pellets, and wood chips are popular forms of wood fuel, with thermal efficiency and combustion efficiency being key considerations. Sustainability standards and emission standards are crucial in ensuring the environmental impact of wood fuels is minimized. Biomass certification, energy storage, and heating systems, including wood-fired power plants, pellet boilers, and log boilers, are also important market trends. Industrial heating, forest residues, and agricultural residues are other areas of focus in the biomass supply chain. Government incentives for renewable energy and carbon capture technologies are further boosting the market. Wood drying, wood pelletizing, and carbon capture are essential processes in the production of wood fuels.

The market is also exploring the potential of biomass gasification, biomass boilers, and commercial heating to increase efficiency and reduce air pollution. The market is a dynamic and evolving sector, with various entities working together to promote sustainable energy and address the challenges of energy security and climate change.

Market Dynamics

The Wood Fuels Market is advancing sustainable energy with high-efficiency wood pellets and carbon-neutral wood fuels for residential heating and industrial applications. Innovations like torrefied biomass pellets, next-generation torrefaction, and zero-waste pellet production enhance efficiency, while low-emission biomass burners and automated biomass boilers reduce environmental impact. Smart pellet stoves and portable pellet heaters cater to off-grid heating and camping, supported by AI-optimized wood fuel production processes and smart fuel monitoring systems. Eco-friendly charcoal production and green pellet binders promote sustainability, alongside biomass fuel traceability and sustainable wood sourcing. High-energy-density briquettes and renewable syngas production drive cogeneration, positioning best wood fuel suppliers for renewable energy and green energy solutions.

Our researchers analyzed the data with 2023 as the base year, along with the key drivers, trends, and challenges. A holistic analysis of drivers will help companies refine their marketing strategies to gain a competitive advantage.

What are the key market drivers leading to the rise in the adoption of Wood Fuels Industry?

  • Strict regulations mandating carbon dioxide emissions serve as the primary market driver. 
  • The renewable fuels market is experiencing significant growth due to increasing government mandates to reduce carbon emissions and promote sustainability in the energy sector. Biomass, specifically wood fuels such as wood pellets and lignocellulosic biomass, are gaining popularity as carbon-neutral alternatives to coal-fired power generation. The environmental concerns surrounding coal's large contribution to greenhouse gas (GHG) emissions have led to international agreements, such as the Kyoto Protocol, and national regulations, like the US Environmental Protection Agency's (EPA) targets, pushing for a shift towards renewable energy sources. Moreover, the integration of energy management systems, smart grids, and fuel blending in residential heating applications is further propelling the demand for wood fuels.
  • The emphasis on sustainability standards ensures that the production and utilization of wood fuels are done in a harmonious and responsible manner. The energy sector's transition towards renewable fuels not only contributes to the reduction of carbon emissions but also aligns with the global efforts to combat climate change.

What are the market trends shaping the Wood Fuels Industry?

  • The decline in coal usage is becoming a prominent trend in the power industry. It is essential for businesses to adapt to this shift towards more sustainable energy sources.
  • The global energy landscape is shifting towards renewable and low-emission sources, with coal power gradually being replaced due to its high carbon footprint. Renewable energy, including wood fuels, is becoming increasingly popular as it generates electricity with minimal emissions. In fact, wood fuels, such as wood waste and biomass, are expected to play a significant role in the energy mix, particularly in heating systems and electricity generation. Biomass certification and carbon capture technologies are crucial in mitigating the environmental impact of wood fuel usage. Moreover, energy storage solutions and solar thermal integration can enhance the efficiency and reliability of wood fuel-based power generation.
  • Biomass gasification is another promising technology that can improve combustion efficiency and reduce emissions. Recent research indicates that the demand for wood fuels is on the rise due to their environmental benefits and their potential to substitute coal in various applications. For instance, China, the world's largest energy consumer, has pledged to support green and low-carbon energies in developing countries while avoiding new coal power projects. This trend is expected to accelerate the adoption of wood fuels as a viable alternative to coal for power generation and heating systems. In conclusion, the global energy transition towards low-emission sources is creating opportunities for wood fuels to become a significant player in the energy market.
  • With advancements in technology and supportive government policies, wood fuels are poised to make a substantial contribution to the global energy mix while minimizing their environmental impact.

What challenges does the Wood Fuels Industry face during its growth?

  • The installation requirements for biomass boilers, including feedstock storage, pose a significant challenge and significantly impact the growth of the industry. 
  • Biomass boilers, fueled by wood, are larger than traditional boilers and necessitate on-site fuel storage solutions, such as wood chips, pellets, or logs. The challenge of fuel storage is particularly pertinent for industries located in densely populated areas due to space constraints. The installation of biomass boilers involves adhering to stringent design, construction, operation, and maintenance standards set by governments, which may differ across regions. Compared to conventional boilers, biomass boilers are relatively novel, leading to technological hurdles in terms of boiler design, emission control, and size.
  • Despite these challenges, the shift towards sustainable energy sources, including wood-fired power plants and wood briquettes, is gaining momentum due to their potential to reduce CO2 emissions. Thermal efficiency is a crucial factor in the biomass supply chain, ensuring the optimal use of fuel and minimizing environmental impact.

Exclusive Customer Landscape

The wood fuels market forecasting report includes the adoption lifecycle of the market, covering from the innovator's stage to the laggard's stage. It focuses on adoption rates in different regions based on penetration. Furthermore, the wood fuels market report also includes key purchase criteria and drivers of price sensitivity to help companies evaluate and develop their market growth analysis strategies.
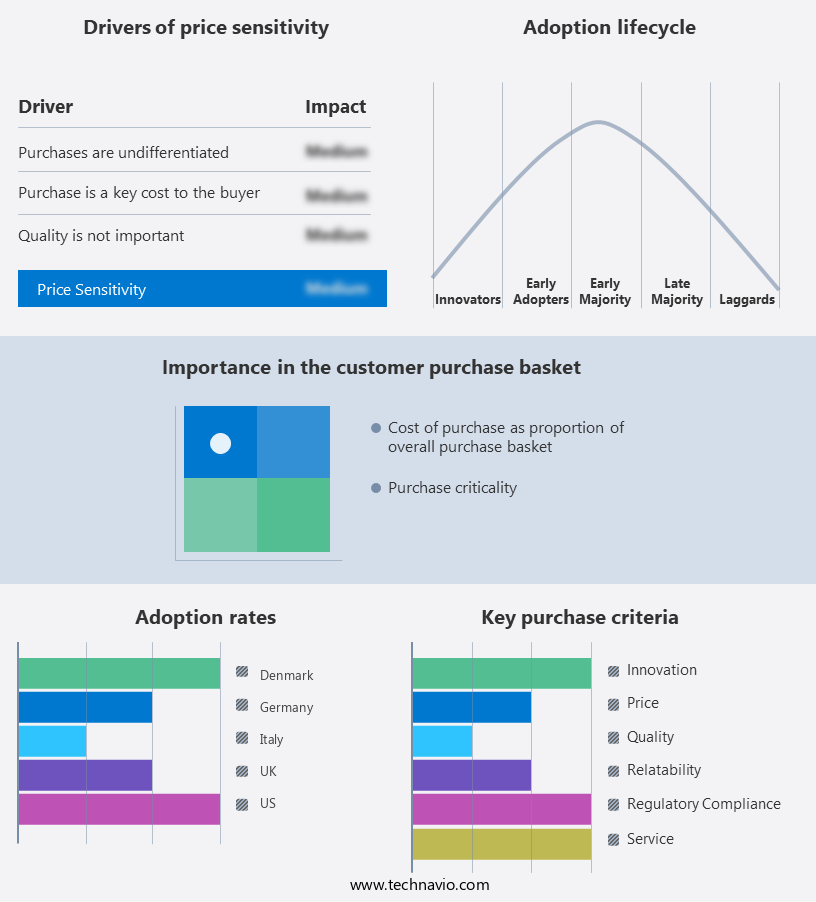
Wood Fuels Market Share by Geography

 Customer Landscape

Key Companies & Market Insights

Companies are implementing various strategies, such as strategic alliances, wood fuels market forecast, partnerships, mergers and acquisitions, geographical expansion, and product/service launches, to enhance their presence in the industry.

Asia Pulp & Paper Co. Ltd. - Wood pellets, a sustainable alternative to fossil fuels, are gaining prominence in the global energy sector.

The industry research and growth report includes detailed analyses of the competitive landscape of the market and information about key companies, including:

  • Asia Pulp & Paper Co. Ltd.
  • Biomass Secure Power Inc.
  • Drax Group Plc
  • Enviva Partners LP
  • Fram Renewable Fuels LLC
  • Georgia Biomass LLC
  • German Pellets GmbH
  • Graanul Invest AS
  • Highland Pellets LLC
  • Holzindustrie Schweighofer GmbH
  • Innogy SE
  • Pacific BioEnergy Corp.
  • Pfeifer Group
  • Pinnacle Renewable Energy Inc.
  • Rentech Inc.
  • Stora Enso Oyj
  • Sumitomo Forestry Co. Ltd.
  • UPM-Kymmene Corp.
  • Vattenfall AB
  • Viridis Energy Inc.

Qualitative and quantitative analysis of companies has been conducted to help clients understand the wider business environment as well as the strengths and weaknesses of key industry players. Data is qualitatively analyzed to categorize companies as pure play, category-focused, industry-focused, and diversified; it is quantitatively analyzed to categorize companies as dominant, leading, strong, tentative, and weak.

Recent Development and News in Wood Fuels Market

  • In February 2024, Drax Group, a leading wood fuel producer, announced the launch of its innovative biomass pellet production facility in the United States. This new plant, located in Mississippi, is expected to produce 2.6 million metric tons of sustainable biomass pellets annually, making it the largest of its kind in North America (Drax Group, 2024).
  • In June 2024, Finnish energy company Fortum and Swedish forest industry giant Södra entered into a strategic partnership to develop a large-scale wood fuel production and logistics network in Sweden. The collaboration aims to increase the use of wood fuels in the Nordic region and reduce greenhouse gas emissions (Fortum, 2025).
  • In October 2024, the European Commission approved the €1.3 billion funding for the Horizon 2020 BioTWIN project, which focuses on the development and implementation of advanced bio-based technologies, including those for wood fuels. The project is expected to create significant market growth opportunities and contribute to the European Union's goal of achieving climate neutrality by 2050 (European Commission, 2024).
  • In March 2025, Lignocellulose Energy, a leading wood fuel technology company, successfully demonstrated its advanced gasification technology, which converts wood waste into syngas with over 90% efficiency. The breakthrough technology has the potential to significantly reduce greenhouse gas emissions and increase the competitiveness of wood fuels in the global energy market (Lignocellulose Energy, 2025).

Research Analyst Overview

The market is experiencing significant activity and trends, driven by the push for energy independence and emission reduction. Biomass Power Generation plays a crucial role in energy diversification and climate change mitigation, contributing to the renewable energy portfolio. The availability of biomass feedstock, such as wood and agricultural residues, is a key factor in the growth of this market. Biomass processing technologies, including gasification and pyrolysis, are advancing to improve energy yield and reduce moisture content. Boiler efficiency and sustainable forestry practices are essential for carbon neutral energy production. Biomass gasification plants employing advanced biofuels and biomass upgrading technologies are increasingly popular.

Circular economy principles are shaping the supply chain logistics of the market, with a focus on carbon sequestration and sustainable development. Renewable energy market policies and renewable fuel standards are promoting the use of biomass as a sustainable alternative to fossil fuels. Biomass gasification technologies and biomass processing technologies are essential for converting biomass into valuable energy sources. Ash content and wood density are critical factors in the production of high-quality biomass fuels. The heating value of biomass fuels is a significant consideration in their adoption as a renewable energy source. In the context of the renewable energy market, biomass utilization is a vital component of a comprehensive energy strategy.

The reduction of greenhouse gas emissions and the promotion of sustainable forestry practices are essential for a carbon-neutral energy future. Bioenergy innovation is driving the development of new technologies and applications for biomass fuels, further expanding their role in the energy landscape.

Dive into Technavio's robust research methodology, blending expert interviews, extensive data synthesis, and validated models for unparalleled Wood Fuels Market insights. See full methodology.

Market Scope

Report Coverage

Details

Page number

149

Base year

2023

Historic period

2018-2022

Forecast period

2024-2028

Growth momentum & CAGR

Accelerate at a CAGR of 10.27%

Market growth 2024-2028

USD 9.79 billion

Market structure

Fragmented

YoY growth 2023-2024(%)

9.53

Key countries

US, Canada, Germany, UK, Italy, France, China, India, Japan, Brazil, Egypt, UAE, Oman, Argentina, KSA, UAE, Brazil, and Rest of World (ROW)

Competitive landscape

Leading Companies, Market Positioning of Companies, Competitive Strategies, and Industry Risks

Request Free Sample

What are the Key Data Covered in this Wood Fuels Market Research and Growth Report?

  • CAGR of the Wood Fuels industry during the forecast period
  • Detailed information on factors that will drive the growth and forecasting between 2024 and 2028
  • Precise estimation of the size of the market and its contribution of the industry in focus to the parent market
  • Accurate predictions about upcoming growth and trends and changes in consumer behaviour
  • Growth of the market across Europe, North America, APAC, Middle East and Africa, and South America
  • Thorough analysis of the market's competitive landscape and detailed information about companies
  • Comprehensive analysis of factors that will challenge the wood fuels market growth of industry companies

We can help! Our analysts can customize this wood fuels market research report to meet your requirements.

Get in touch

1 Executive Summary

  • 1.1 Market overview
    • Exhibit 01: Executive Summary – Chart on Market Overview
    • Exhibit 02: Executive Summary – Data Table on Market Overview
    • Exhibit 03: Executive Summary – Chart on Global Market Characteristics
    • Exhibit 04: Executive Summary – Chart on Market by Geography
    • Exhibit 05: Executive Summary – Chart on Market Segmentation by Type
    • Exhibit 06: Executive Summary – Chart on Market Segmentation by Application
    • Exhibit 07: Executive Summary – Chart on Incremental Growth
    • Exhibit 08: Executive Summary – Data Table on Incremental Growth
    • Exhibit 09: Executive Summary – Chart on Vendor Market Positioning

2 Market Landscape

  • 2.1 Market ecosystem
    • Exhibit 10: Parent market
    • Exhibit 11: Market Characteristics

3 Market Sizing

  • 3.1 Market definition
    • Exhibit 12: Offerings of vendors included in the market definition
  • 3.2 Market segment analysis
    • Exhibit 13: Market segments
  • 3.3 Market size 2023
    • 3.4 Market outlook: Forecast for 2023-2028
      • Exhibit 14: Chart on Global - Market size and forecast 2023-2028 ($ million)
      • Exhibit 15: Data Table on Global - Market size and forecast 2023-2028 ($ million)
      • Exhibit 16: Chart on Global Market: Year-over-year growth 2023-2028 (%)
      • Exhibit 17: Data Table on Global Market: Year-over-year growth 2023-2028 (%)

    4 Historic Market Size

    • 4.1 Global wood fuels market 2018 - 2022
      • Exhibit 18: Historic Market Size – Data Table on global wood fuels market 2018 - 2022 ($ million)
    • 4.2 Type Segment Analysis 2018 - 2022
      • Exhibit 19: Historic Market Size – Type Segment 2018 - 2022 ($ million)
    • 4.3 Application Segment Analysis 2018 - 2022
      • Exhibit 20: Historic Market Size – Application Segment 2018 - 2022 ($ million)
    • 4.4 Geography Segment Analysis 2018 - 2022
      • Exhibit 21: Historic Market Size – Geography Segment 2018 - 2022 ($ million)
    • 4.5 Country Segment Analysis 2018 - 2022
      • Exhibit 22: Historic Market Size – Country Segment 2018 - 2022 ($ million)

    5 Five Forces Analysis

    • 5.1 Five forces summary
      • Exhibit 23: Five forces analysis - Comparison between 2023 and 2028
    • 5.2 Bargaining power of buyers
      • Exhibit 24: Chart on Bargaining power of buyers – Impact of key factors 2023 and 2028
    • 5.3 Bargaining power of suppliers
      • Exhibit 25: Bargaining power of suppliers – Impact of key factors in 2023 and 2028
    • 5.4 Threat of new entrants
      • Exhibit 26: Threat of new entrants – Impact of key factors in 2023 and 2028
    • 5.5 Threat of substitutes
      • Exhibit 27: Threat of substitutes – Impact of key factors in 2023 and 2028
    • 5.6 Threat of rivalry
      • Exhibit 28: Threat of rivalry – Impact of key factors in 2023 and 2028
    • 5.7 Market condition
      • Exhibit 29: Chart on Market condition - Five forces 2023 and 2028

    6 Market Segmentation by Type

    • 6.1 Market segments
      • Chart on Type - Market share (2023-2028) (%)
      • Data Table on Type - Market share (2023-2028) (%)
    • 6.2 Comparison by Type
      • Chart on Comparison by Type
      • Data Table on Comparison by Type
    • 6.3 Wood pellets - Market size and forecast (2023-2028)
      • Chart on Wood pellets - Market size and forecast (2023-2028) ($ million)
      • Data Table on Wood pellets - Market size and forecast (2023-2028) ($ million)
      • Chart on Wood pellets - Year-over-year growth (2023-2028) (%)
      • Data Table on Wood pellets - Year-over-year growth (2023-2028) (%)
    • 6.4 Wood chips - Market size and forecast (2023-2028)
      • Chart on Wood chips - Market size and forecast (2023-2028) ($ million)
      • Data Table on Wood chips - Market size and forecast (2023-2028) ($ million)
      • Chart on Wood chips - Year-over-year growth (2023-2028) (%)
      • Data Table on Wood chips - Year-over-year growth (2023-2028) (%)
    • 6.5 Firewood - Market size and forecast (2023-2028)
      • Chart on Firewood - Market size and forecast (2023-2028) ($ million)
      • Data Table on Firewood - Market size and forecast (2023-2028) ($ million)
      • Chart on Firewood - Year-over-year growth (2023-2028) (%)
      • Data Table on Firewood - Year-over-year growth (2023-2028) (%)
    • 6.6 Market opportunity by Type
      • Market opportunity by Type ($ million)
      • Data Table on Market opportunity by Type ($ million)

    7 Market Segmentation by Application

    • 7.1 Market segments
      • Chart on Application - Market share (2023-2028) (%)
      • Data Table on Application - Market share (2023-2028) (%)
    • 7.2 Comparison by Application
      • Chart on Comparison by Application
      • Data Table on Comparison by Application
    • 7.3 Residential Heating - Market size and forecast (2023-2028)
      • Chart on Residential Heating - Market size and forecast (2023-2028) ($ million)
      • Data Table on Residential Heating - Market size and forecast (2023-2028) ($ million)
      • Chart on Residential Heating - Year-over-year growth (2023-2028) (%)
      • Data Table on Residential Heating - Year-over-year growth (2023-2028) (%)
    • 7.4 Industrial Power Generation - Market size and forecast (2023-2028)
      • Chart on Industrial Power Generation - Market size and forecast (2023-2028) ($ million)
      • Data Table on Industrial Power Generation - Market size and forecast (2023-2028) ($ million)
      • Chart on Industrial Power Generation - Year-over-year growth (2023-2028) (%)
      • Data Table on Industrial Power Generation - Year-over-year growth (2023-2028) (%)
    • 7.5 Commercial - Market size and forecast (2023-2028)
      • Chart on Commercial - Market size and forecast (2023-2028) ($ million)
      • Data Table on Commercial - Market size and forecast (2023-2028) ($ million)
      • Chart on Commercial - Year-over-year growth (2023-2028) (%)
      • Data Table on Commercial - Year-over-year growth (2023-2028) (%)
    • 7.6 Market opportunity by Application
      • Market opportunity by Application ($ million)
      • Data Table on Market opportunity by Application ($ million)

    8 Market Segmentation by Source

    • 8.1 Market segments
      • Chart on Source - Market share (2023-2028) (%)
      • Data Table on Source - Market share (2023-2028) (%)
    • 8.2 Comparison by Source
      • Chart on Comparison by Source
      • Data Table on Comparison by Source
    • 8.3 Forest Residues - Market size and forecast (2023-2028)
      • Chart on Forest Residues - Market size and forecast (2023-2028) ($ million)
      • Data Table on Forest Residues - Market size and forecast (2023-2028) ($ million)
      • Chart on Forest Residues - Year-over-year growth (2023-2028) (%)
      • Data Table on Forest Residues - Year-over-year growth (2023-2028) (%)
    • 8.4 Recycled Wood - Market size and forecast (2023-2028)
      • Chart on Recycled Wood - Market size and forecast (2023-2028) ($ million)
      • Data Table on Recycled Wood - Market size and forecast (2023-2028) ($ million)
      • Chart on Recycled Wood - Year-over-year growth (2023-2028) (%)
      • Data Table on Recycled Wood - Year-over-year growth (2023-2028) (%)
    • 8.5 Sawmill Byproducts - Market size and forecast (2023-2028)
      • Chart on Sawmill Byproducts - Market size and forecast (2023-2028) ($ million)
      • Data Table on Sawmill Byproducts - Market size and forecast (2023-2028) ($ million)
      • Chart on Sawmill Byproducts - Year-over-year growth (2023-2028) (%)
      • Data Table on Sawmill Byproducts - Year-over-year growth (2023-2028) (%)
    • 8.6 Market opportunity by Source
      • Market opportunity by Source ($ million)
      • Data Table on Market opportunity by Source ($ million)

    9 Market Segmentation by Distribution Channel

    • 9.1 Market segments
      • Chart on Distribution Channel - Market share (2023-2028) (%)
      • Data Table on Distribution Channel - Market share (2023-2028) (%)
    • 9.2 Comparison by Distribution Channel
      • Chart on Comparison by Distribution Channel
      • Data Table on Comparison by Distribution Channel
    • 9.3 Direct Sales - Market size and forecast (2023-2028)
      • Chart on Direct Sales - Market size and forecast (2023-2028) ($ million)
      • Data Table on Direct Sales - Market size and forecast (2023-2028) ($ million)
      • Chart on Direct Sales - Year-over-year growth (2023-2028) (%)
      • Data Table on Direct Sales - Year-over-year growth (2023-2028) (%)
    • 9.4 Retail - Market size and forecast (2023-2028)
      • Chart on Retail - Market size and forecast (2023-2028) ($ million)
      • Data Table on Retail - Market size and forecast (2023-2028) ($ million)
      • Chart on Retail - Year-over-year growth (2023-2028) (%)
      • Data Table on Retail - Year-over-year growth (2023-2028) (%)
    • 9.5 Online Platforms - Market size and forecast (2023-2028)
      • Chart on Online Platforms - Market size and forecast (2023-2028) ($ million)
      • Data Table on Online Platforms - Market size and forecast (2023-2028) ($ million)
      • Chart on Online Platforms - Year-over-year growth (2023-2028) (%)
      • Data Table on Online Platforms - Year-over-year growth (2023-2028) (%)
    • 9.6 Market opportunity by Distribution Channel
      • Market opportunity by Distribution Channel ($ million)
      • Data Table on Market opportunity by Distribution Channel ($ million)

    8 Customer Landscape

    • 8.1 Customer landscape overview
      • Exhibit 62: Analysis of price sensitivity, lifecycle, customer purchase basket, adoption rates, and purchase criteria

    9 Geographic Landscape

    • 9.1 Geographic segmentation
      • Exhibit 63: Chart on Market share by geography 2023-2028 (%)
      • Exhibit 64: Data Table on Market share by geography 2023-2028 (%)
    • 9.2 Geographic comparison
      • Exhibit 65: Chart on Geographic comparison
      • Exhibit 66: Data Table on Geographic comparison
    • 9.3 Europe - Market size and forecast 2023-2028
      • Exhibit 67: Chart on Europe - Market size and forecast 2023-2028 ($ million)
      • Exhibit 68: Data Table on Europe - Market size and forecast 2023-2028 ($ million)
      • Exhibit 69: Chart on Europe - Year-over-year growth 2023-2028 (%)
      • Exhibit 70: Data Table on Europe - Year-over-year growth 2023-2028 (%)
    • 9.4 North America - Market size and forecast 2023-2028
      • Exhibit 71: Chart on North America - Market size and forecast 2023-2028 ($ million)
      • Exhibit 72: Data Table on North America - Market size and forecast 2023-2028 ($ million)
      • Exhibit 73: Chart on North America - Year-over-year growth 2023-2028 (%)
      • Exhibit 74: Data Table on North America - Year-over-year growth 2023-2028 (%)
    • 9.5 APAC - Market size and forecast 2023-2028
      • Exhibit 75: Chart on APAC - Market size and forecast 2023-2028 ($ million)
      • Exhibit 76: Data Table on APAC - Market size and forecast 2023-2028 ($ million)
      • Exhibit 77: Chart on APAC - Year-over-year growth 2023-2028 (%)
      • Exhibit 78: Data Table on APAC - Year-over-year growth 2023-2028 (%)
    • 9.6 Middle East and Africa - Market size and forecast 2023-2028
      • Exhibit 79: Chart on Middle East and Africa - Market size and forecast 2023-2028 ($ million)
      • Exhibit 80: Data Table on Middle East and Africa - Market size and forecast 2023-2028 ($ million)
      • Exhibit 81: Chart on Middle East and Africa - Year-over-year growth 2023-2028 (%)
      • Exhibit 82: Data Table on Middle East and Africa - Year-over-year growth 2023-2028 (%)
    • 9.7 South America - Market size and forecast 2023-2028
      • Exhibit 83: Chart on South America - Market size and forecast 2023-2028 ($ million)
      • Exhibit 84: Data Table on South America - Market size and forecast 2023-2028 ($ million)
      • Exhibit 85: Chart on South America - Year-over-year growth 2023-2028 (%)
      • Exhibit 86: Data Table on South America - Year-over-year growth 2023-2028 (%)
    • 9.8 UK - Market size and forecast 2023-2028
      • Exhibit 87: Chart on UK - Market size and forecast 2023-2028 ($ million)
      • Exhibit 88: Data Table on UK - Market size and forecast 2023-2028 ($ million)
      • Exhibit 89: Chart on UK - Year-over-year growth 2023-2028 (%)
      • Exhibit 90: Data Table on UK - Year-over-year growth 2023-2028 (%)
    • 9.9 Italy - Market size and forecast 2023-2028
      • Exhibit 91: Chart on Italy - Market size and forecast 2023-2028 ($ million)
      • Exhibit 92: Data Table on Italy - Market size and forecast 2023-2028 ($ million)
      • Exhibit 93: Chart on Italy - Year-over-year growth 2023-2028 (%)
      • Exhibit 94: Data Table on Italy - Year-over-year growth 2023-2028 (%)
    • 9.10 US - Market size and forecast 2023-2028
      • Exhibit 95: Chart on US - Market size and forecast 2023-2028 ($ million)
      • Exhibit 96: Data Table on US - Market size and forecast 2023-2028 ($ million)
      • Exhibit 97: Chart on US - Year-over-year growth 2023-2028 (%)
      • Exhibit 98: Data Table on US - Year-over-year growth 2023-2028 (%)
    • 9.11 Denmark - Market size and forecast 2023-2028
      • Exhibit 99: Chart on Denmark - Market size and forecast 2023-2028 ($ million)
      • Exhibit 100: Data Table on Denmark - Market size and forecast 2023-2028 ($ million)
      • Exhibit 101: Chart on Denmark - Year-over-year growth 2023-2028 (%)
      • Exhibit 102: Data Table on Denmark - Year-over-year growth 2023-2028 (%)
    • 9.12 Germany - Market size and forecast 2023-2028
      • Exhibit 103: Chart on Germany - Market size and forecast 2023-2028 ($ million)
      • Exhibit 104: Data Table on Germany - Market size and forecast 2023-2028 ($ million)
      • Exhibit 105: Chart on Germany - Year-over-year growth 2023-2028 (%)
      • Exhibit 106: Data Table on Germany - Year-over-year growth 2023-2028 (%)
    • 9.13 Market opportunity by geography
      • Exhibit 107: Market opportunity by geography ($ million)
      • Exhibit 108: Data Tables on Market opportunity by geography ($ million)
    • 11.14 Canada - Market size and forecast (2023-2028)
      • Chart on Canada - Market size and forecast (2023-2028) ($ million)
      • Data Table on Canada - Market size and forecast (2023-2028) ($ million)
      • Chart on Canada - Year-over-year growth (2023-2028) (%)
      • Data Table on Canada - Year-over-year growth (2023-2028) (%)
    • 11.15 France - Market size and forecast (2023-2028)
      • Chart on France - Market size and forecast (2023-2028) ($ million)
      • Data Table on France - Market size and forecast (2023-2028) ($ million)
      • Chart on France - Year-over-year growth (2023-2028) (%)
      • Data Table on France - Year-over-year growth (2023-2028) (%)
    • 11.16 China - Market size and forecast (2023-2028)
      • Chart on China - Market size and forecast (2023-2028) ($ million)
      • Data Table on China - Market size and forecast (2023-2028) ($ million)
      • Chart on China - Year-over-year growth (2023-2028) (%)
      • Data Table on China - Year-over-year growth (2023-2028) (%)
    • 11.17 India - Market size and forecast (2023-2028)
      • Chart on India - Market size and forecast (2023-2028) ($ million)
      • Data Table on India - Market size and forecast (2023-2028) ($ million)
      • Chart on India - Year-over-year growth (2023-2028) (%)
      • Data Table on India - Year-over-year growth (2023-2028) (%)
    • 11.18 Japan - Market size and forecast (2023-2028)
      • Chart on Japan - Market size and forecast (2023-2028) ($ million)
      • Data Table on Japan - Market size and forecast (2023-2028) ($ million)
      • Chart on Japan - Year-over-year growth (2023-2028) (%)
      • Data Table on Japan - Year-over-year growth (2023-2028) (%)
    • 11.19 Brazil - Market size and forecast (2023-2028)
      • Chart on Brazil - Market size and forecast (2023-2028) ($ million)
      • Data Table on Brazil - Market size and forecast (2023-2028) ($ million)
      • Chart on Brazil - Year-over-year growth (2023-2028) (%)
      • Data Table on Brazil - Year-over-year growth (2023-2028) (%)
    • 11.20 Egypt - Market size and forecast (2023-2028)
      • Chart on Egypt - Market size and forecast (2023-2028) ($ million)
      • Data Table on Egypt - Market size and forecast (2023-2028) ($ million)
      • Chart on Egypt - Year-over-year growth (2023-2028) (%)
      • Data Table on Egypt - Year-over-year growth (2023-2028) (%)
    • 11.21 UAE - Market size and forecast (2023-2028)
      • Chart on UAE - Market size and forecast (2023-2028) ($ million)
      • Data Table on UAE - Market size and forecast (2023-2028) ($ million)
      • Chart on UAE - Year-over-year growth (2023-2028) (%)
      • Data Table on UAE - Year-over-year growth (2023-2028) (%)
    • 11.22 Oman - Market size and forecast (2023-2028)
      • Chart on Oman - Market size and forecast (2023-2028) ($ million)
      • Data Table on Oman - Market size and forecast (2023-2028) ($ million)
      • Chart on Oman - Year-over-year growth (2023-2028) (%)
      • Data Table on Oman - Year-over-year growth (2023-2028) (%)
    • 11.23 Argentina - Market size and forecast (2023-2028)
      • Chart on Argentina - Market size and forecast (2023-2028) ($ million)
      • Data Table on Argentina - Market size and forecast (2023-2028) ($ million)
      • Chart on Argentina - Year-over-year growth (2023-2028) (%)
      • Data Table on Argentina - Year-over-year growth (2023-2028) (%)
    • 11.24 KSA - Market size and forecast (2023-2028)
      • Chart on KSA - Market size and forecast (2023-2028) ($ million)
      • Data Table on KSA - Market size and forecast (2023-2028) ($ million)
      • Chart on KSA - Year-over-year growth (2023-2028) (%)
      • Data Table on KSA - Year-over-year growth (2023-2028) (%)
    • 11.25 Rest of World (ROW) - Market size and forecast (2023-2028)
      • Chart on Rest of World (ROW) - Market size and forecast (2023-2028) ($ million)
      • Data Table on Rest of World (ROW) - Market size and forecast (2023-2028) ($ million)
      • Chart on Rest of World (ROW) - Year-over-year growth (2023-2028) (%)
      • Data Table on Rest of World (ROW) - Year-over-year growth (2023-2028) (%)

    10 Drivers, Challenges, and Trends

    • 10.1 Market drivers
      • 10.2 Market challenges
        • 10.3 Impact of drivers and challenges
          • Exhibit 109: Impact of drivers and challenges in 2023 and 2028
        • 10.4 Market trends

          11 Vendor Landscape

          • 11.1 Overview
            • 11.2 Vendor landscape
              • Exhibit 110: Overview on Criticality of inputs and Factors of differentiation
            • 11.3 Landscape disruption
              • Exhibit 111: Overview on factors of disruption
            • 11.4 Industry risks
              • Exhibit 112: Impact of key risks on business

            14 Competitive Analysis

            • 14.1 Companies profiled
              • Companies covered
            • 14.2 Market positioning of companies
              • Matrix on companies position and classification
            • 14.3 Asia Pulp & Paper Co. Ltd.
              • Asia Pulp & Paper Co. Ltd. - Overview
              • Asia Pulp & Paper Co. Ltd. - Product / Service
              • Asia Pulp & Paper Co. Ltd. - Key offerings
            • 14.4 Biomass Secure Power Inc.
              • Biomass Secure Power Inc. - Overview
              • Biomass Secure Power Inc. - Product / Service
              • Biomass Secure Power Inc. - Key offerings
            • 14.5 Drax Group Plc
              • Drax Group Plc - Overview
              • Drax Group Plc - Product / Service
              • Drax Group Plc - Key offerings
            • 14.6 Enviva Partners LP
              • Enviva Partners LP - Overview
              • Enviva Partners LP - Product / Service
              • Enviva Partners LP - Key offerings
            • 14.7 Fram Renewable Fuels LLC
              • Fram Renewable Fuels LLC - Overview
              • Fram Renewable Fuels LLC - Product / Service
              • Fram Renewable Fuels LLC - Key offerings
            • 14.8 Georgia Biomass LLC
              • Georgia Biomass LLC - Overview
              • Georgia Biomass LLC - Product / Service
              • Georgia Biomass LLC - Key offerings
            • 14.9 German Pellets GmbH
              • German Pellets GmbH - Overview
              • German Pellets GmbH - Product / Service
              • German Pellets GmbH - Key offerings
            • 14.10 Graanul Invest AS
              • Graanul Invest AS - Overview
              • Graanul Invest AS - Product / Service
              • Graanul Invest AS - Key offerings
            • 14.11 Highland Pellets LLC
              • Highland Pellets LLC - Overview
              • Highland Pellets LLC - Product / Service
              • Highland Pellets LLC - Key offerings
            • 14.12 Holzindustrie Schweighofer GmbH
              • Holzindustrie Schweighofer GmbH - Overview
              • Holzindustrie Schweighofer GmbH - Product / Service
              • Holzindustrie Schweighofer GmbH - Key offerings
            • 14.13 Innogy SE
              • Innogy SE - Overview
              • Innogy SE - Product / Service
              • Innogy SE - Key offerings
            • 14.14 Pacific BioEnergy Corp.
              • Pacific BioEnergy Corp. - Overview
              • Pacific BioEnergy Corp. - Product / Service
              • Pacific BioEnergy Corp. - Key offerings
            • 14.15 Pfeifer Group
              • Pfeifer Group - Overview
              • Pfeifer Group - Product / Service
              • Pfeifer Group - Key offerings
            • 14.16 Pinnacle Renewable Energy Inc.
              • Pinnacle Renewable Energy Inc. - Overview
              • Pinnacle Renewable Energy Inc. - Product / Service
              • Pinnacle Renewable Energy Inc. - Key offerings
            • 14.17 Rentech Inc.
              • Rentech Inc. - Overview
              • Rentech Inc. - Product / Service
              • Rentech Inc. - Key offerings
            • 14.18 Stora Enso Oyj
              • Stora Enso Oyj - Overview
              • Stora Enso Oyj - Product / Service
              • Stora Enso Oyj - Key offerings
            • 14.19 Sumitomo Forestry Co. Ltd.
              • Sumitomo Forestry Co. Ltd. - Overview
              • Sumitomo Forestry Co. Ltd. - Product / Service
              • Sumitomo Forestry Co. Ltd. - Key offerings
            • 14.20 UPM-Kymmene Corp.
              • UPM-Kymmene Corp. - Overview
              • UPM-Kymmene Corp. - Product / Service
              • UPM-Kymmene Corp. - Key offerings
            • 14.21 Vattenfall AB
              • Vattenfall AB - Overview
              • Vattenfall AB - Product / Service
              • Vattenfall AB - Key offerings
            • 14.22 Viridis Energy Inc.
              • Viridis Energy Inc. - Overview
              • Viridis Energy Inc. - Product / Service
              • Viridis Energy Inc. - Key offerings
            • 14.23 Andritz AG
              • Andritz AG - Overview
              • Andritz AG - Product / Service
              • Andritz AG - Key offerings
            • 14.24 AS Graanul Invest
              • AS Graanul Invest - Overview
              • AS Graanul Invest - Product / Service
              • AS Graanul Invest - Key offerings
            • 14.25 BALT WOOD ENTERPRISE SIA
              • BALT WOOD ENTERPRISE SIA - Overview
              • BALT WOOD ENTERPRISE SIA - Product / Service
              • BALT WOOD ENTERPRISE SIA - Key offerings
            • 14.26 Biogra
              • Biogra - Overview
              • Biogra - Product / Service
              • Biogra - Key offerings
            • 14.27 BIOMAC sro
              • BIOMAC sro - Overview
              • BIOMAC sro - Product / Service
              • BIOMAC sro - Key offerings
            • 14.28 BMK Woods
              • BMK Woods - Overview
              • BMK Woods - Product / Service
              • BMK Woods - Key offerings
            • 14.29 Drax Group Plc
              • Drax Group Plc - Overview
              • Drax Group Plc - Product / Service
              • Drax Group Plc - Key offerings
            • 14.30 Energy Queensland Ltd
              • Energy Queensland Ltd - Overview
              • Energy Queensland Ltd - Product / Service
              • Energy Queensland Ltd - Key offerings
            • 14.31 Enviva Inc.
              • Enviva Inc. - Overview
              • Enviva Inc. - Product / Service
              • Enviva Inc. - Key offerings
            • 14.32 Fram Renewable Fuels
              • Fram Renewable Fuels - Overview
              • Fram Renewable Fuels - Product / Service
              • Fram Renewable Fuels - Key offerings
            • 14.33 Granules LG
              • Granules LG - Overview
              • Granules LG - Product / Service
              • Granules LG - Key offerings
            • 14.34 Norfolk Oak
              • Norfolk Oak - Overview
              • Norfolk Oak - Product / Service
              • Norfolk Oak - Key offerings
            • 14.35 Nugreen Energy Pvt. Ltd.
              • Nugreen Energy Pvt. Ltd. - Overview
              • Nugreen Energy Pvt. Ltd. - Product / Service
              • Nugreen Energy Pvt. Ltd. - Key offerings
            • 14.36 Pfeifer Holding GmbH
              • Pfeifer Holding GmbH - Overview
              • Pfeifer Holding GmbH - Product / Service
              • Pfeifer Holding GmbH - Key offerings
            • 14.37 Premium Pellet Ltd.
              • Premium Pellet Ltd. - Overview
              • Premium Pellet Ltd. - Product / Service
              • Premium Pellet Ltd. - Key offerings
            • 14.38 VIRIDIS ENERGY INC.
              • VIRIDIS ENERGY INC. - Overview
              • VIRIDIS ENERGY INC. - Product / Service
              • VIRIDIS ENERGY INC. - Key offerings
            • 14.39 Well Seasoned Wood
              • Well Seasoned Wood - Overview
              • Well Seasoned Wood - Product / Service
              • Well Seasoned Wood - Key offerings
            • 14.40 Wismar Pellets GmbH
              • Wismar Pellets GmbH - Overview
              • Wismar Pellets GmbH - Product / Service
              • Wismar Pellets GmbH - Key offerings

            13 Appendix

            • 13.1 Scope of the report
              • 13.2 Inclusions and exclusions checklist
                • Exhibit 164: Inclusions checklist
                • Exhibit 165: Exclusions checklist
              • 13.3 Currency conversion rates for US$
                • Exhibit 166: Currency conversion rates for US$
              • 13.4 Research methodology
                • Exhibit 167: Research methodology
                • Exhibit 168: Validation techniques employed for market sizing
                • Exhibit 169: Information sources
              • 13.5 List of abbreviations
                • Exhibit 170: List of abbreviations

              Research Methodology

              Technavio presents a detailed picture of the market by way of study, synthesis, and summation of data from multiple sources. The analysts have presented the various facets of the market with a particular focus on identifying the key industry influencers. The data thus presented is comprehensive, reliable, and the result of extensive research, both primary and secondary.

              INFORMATION SOURCES

              Primary sources

              • Manufacturers and suppliers
              • Channel partners
              • Industry experts
              • Strategic decision makers

              Secondary sources

              • Industry journals and periodicals
              • Government data
              • Financial reports of key industry players
              • Historical data
              • Press releases

              DATA ANALYSIS

              Data Synthesis

              • Collation of data
              • Estimation of key figures
              • Analysis of derived insights

              Data Validation

              • Triangulation with data models
              • Reference against proprietary databases
              • Corroboration with industry experts

              REPORT WRITING

              Qualitative

              • Market drivers
              • Market challenges
              • Market trends
              • Five forces analysis

              Quantitative

              • Market size and forecast
              • Market segmentation
              • Geographical insights
              • Competitive landscape

              Interested in this report?

              Get your sample now to see our research methodology and insights!

              Download Now

              Frequently Asked Questions

              Wood Fuels market growth will increase by $ 9.79 bn during 2024-2028 .

              The Wood Fuels market is expected to grow at a CAGR of 10.27% during 2024-2028 .

              Wood Fuels market is segmented by Type( Wood pellets, Wood chips, Firewood) Application( Residential Heating, Industrial Power Generation, Commercial)

              Asia Pulp & Paper Co. Ltd., Biomass Secure Power Inc., Drax Group Plc, Enviva Partners LP, Fram Renewable Fuels LLC, Georgia Biomass LLC, German Pellets GmbH, Graanul Invest AS, Highland Pellets LLC, Holzindustrie Schweighofer GmbH, Innogy SE, Pacific BioEnergy Corp., Pfeifer Group, Pinnacle Renewable Energy Inc., Rentech Inc., Stora Enso Oyj, Sumitomo Forestry Co. Ltd., UPM-Kymmene Corp., Vattenfall AB, Viridis Energy Inc. are a few of the key vendors in the Wood Fuels market.

              Europe will register the highest growth rate of 59% among the other regions. Therefore, the Wood Fuels market in Europe is expected to garner significant business opportunities for the vendors during the forecast period.

              US, Canada, Germany, UK, Italy, France, China, India, Japan, Brazil, Egypt, UAE, Oman, Argentina, KSA, UAE, Brazil, Rest of World (ROW)

              • Stringent regulations on carbon dioxide emissionsEmissions from burning coal account for the largest share of CO2 emissions from human activity. Globally is the driving factor this market.
              • government bodies are focusing on reducing GHG emissions. Amid international agreements such as the Kyoto Protocol is the driving factor this market.
              • the foothold of coal-powered electricity generation in the global energy mix is uncertain. Agencies such as the Environmental Protection Agency (EPA) is the driving factor this market.
              • the Intergovernmental Panel on Climate Change is the driving factor this market.
              • and the Climate Change Act of 2008 have targets to reduce GHG emissions. These regulations encourage the use of alternatives such as bioenergy. Biomass is a carbon-neutral energy source is the driving factor this market.
              • which makes it beneficial to create a low-pollution environment and contributes to the targets set by the governments. Such factors will drive the growth of the global wood fuels market during the forecast period. is the driving factor this market.

              The Wood Fuels market vendors should focus on grabbing business opportunities from the Wood pellets segment as it accounted for the largest market share in the base year.